
0 ITEMS

Traditional Advertising Agency Financial Model Excel Template
The Advertising Agency Financial Model helps founders, agency owners, consultants, analysts, and business planners create a structured five-year forecast without building a spreadsheet from scratch. It is designed for marketing agencies, creative agencies, digital advertising firms, performance marketing teams, and startup service businesses that need to estimate revenue assumptions, startup costs, operating expenses, payroll, cash flow, profitability, and funding needs in a clear, investor-ready format. This template gives users a practical way to connect the main drivers of an advertising agency business, including client acquisition, service mix, billable hours, hourly rates, retainers, project work, campaign services, staffing, freelancer costs, software, marketing spend, and overhead. Instead of relying on disconnected estimates, users can enter key assumptions into a ready-made model and review how those inputs flow through revenue forecasts, expense planning, profit and loss projections, cash flow, balance sheet outputs, and decision-making dashboards. Built for both business planning and funding preparation, the Advertising Agency Financial Model supports scenario analysis, profitability review, break-even analysis, and stakeholder reporting. It can help users understand whether their agency plan has enough margin, whether client acquisition targets are realistic, how much initial capital may be required, and when the business may become financially sustainable. The model is useful for preparing investor discussions, bank loan applications, internal budgets, pitch materials, and strategic growth plans. The template is fully editable and can be customized for different agency models, from small boutique studios to growing full-service advertising agencies. Users can adapt revenue streams, adjust payroll and operating expenses, revise startup investment assumptions, test low, base, and high scenarios, and review key performance indicators through visual charts and dashboards. By organizing the financial planning process into a professional structure, this model helps users make more informed decisions about pricing, staffing, marketing spend, cash management, profitability targets, and long-term agency growth.
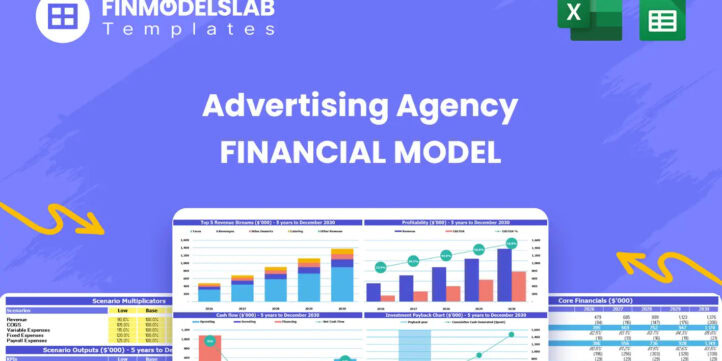


Financial Model Overview
The Advertising Agency Financial Model is a ready-to-use financial model template built to help entrepreneurs, agency founders, consultants, analysts, and business owners plan the financial future of an advertising agency with greater structure and confidence. It brings together the major financial planning areas that matter for a service-based agency, including revenue assumptions, client acquisition, billable hours, pricing, staffing, operating expenses, startup investment, cash flow, profitability, and funding needs. Instead of starting with a blank spreadsheet, users can work from a professional model designed around how advertising agencies generate revenue and manage costs. The template can be used for business plans, investor discussions, bank submissions, internal budgeting, expansion planning, and ongoing decision-making. It is editable in Excel and Google Sheets, allowing users to replace the pre-built assumptions with their own numbers and create a forecast that reflects their service mix, growth strategy, and operating model.
All-in-One Dashboard
The all-in-one dashboard gives users a central view of the model’s most important inputs and outputs, making it easier to understand the financial position of the advertising agency without moving through every worksheet manually. This section typically brings together core assumptions such as revenue drivers, client growth, pricing, cost structure, payroll, marketing spend, startup investment, and funding inputs, then connects them to high-level outputs such as revenue, EBITDA, net profit, cash balance, margins, and return metrics. For an advertising agency, this is especially useful because the business depends on several moving parts, including client acquisition cost, retainer volume, billable hours, freelancer usage, and staff capacity. The dashboard helps users quickly see whether the agency is moving toward sustainable profitability, whether cash reserves are adequate, and whether assumptions need to be adjusted before presenting the plan to investors, lenders, partners, or internal stakeholders.
Low, Base, and High Scenario Analysis
The low, base, and high scenario analysis component allows users to test how the advertising agency may perform under different market and operating conditions. The base case can reflect the most realistic plan, while the low case can show what happens if client acquisition is slower, hourly rates are lower, project demand is weaker, or operating expenses are higher than expected. The high case can model a stronger outcome, such as faster client growth, improved conversion rates, higher retainer adoption, increased billable utilization, or better pricing power. This section helps generate comparative outputs for revenue, cash flow, profitability, funding needs, and long-term financial performance. Scenario planning is valuable for decision-making because it shows which assumptions have the biggest impact on results and helps users prepare for uncertainty. For funding conversations, it also demonstrates that the agency’s financial plan has been tested beyond a single optimistic forecast and can be evaluated across multiple possible outcomes.
Professional Charts
The professional charts component turns the financial forecast into visual outputs that are easier to understand, share, and present. This section may include charts for revenue growth, operating expenses, gross profit, EBITDA, net income, cash flow, cash balance, margins, and other key trends across the forecast period. For an advertising agency, charts are particularly useful because they can show how early investments in marketing, staff, software, branding, and client acquisition translate into future revenue growth and improved margins. Visual reports help users explain the story behind the numbers during investor meetings, lender reviews, partner discussions, or internal planning sessions. Instead of asking stakeholders to interpret rows of spreadsheet data, the model presents key results in a format that supports quick interpretation and better discussion. These charts can also help management identify financial turning points, such as when losses narrow, when EBITDA becomes positive, when cash stabilizes, or when revenue streams begin contributing meaningfully to growth.
ROE Components and DuPont Analysis
The ROE components and DuPont analysis section helps users evaluate return on equity by breaking performance into the drivers that influence shareholder returns. Rather than looking at return on equity as a single number, this component can separate the impact of profitability, asset efficiency, and financial leverage, giving users a more detailed view of how the advertising agency is generating returns. Inputs and linked outputs may include net profit, revenue, total assets, equity, margins, asset turnover, and leverage ratios. For an advertising agency, this can be helpful because the business may not require heavy physical assets, but it still depends on disciplined cash use, efficient staffing, strong margins, and careful reinvestment. DuPont analysis provides a more investor-oriented view of financial performance and helps users understand whether returns are being driven by healthy operating performance or by financial structure. It is useful for evaluating long-term value creation, comparing scenarios, and improving the credibility of the model in stakeholder discussions.
Revenue Inputs
The revenue inputs component is where users define the core assumptions that drive the advertising agency’s sales forecast. It may include active client counts, new client acquisition, customer acquisition cost, marketing budget, service mix, hourly rates, billable hours, monthly retainers, project-based campaigns, strategy and audit work, performance marketing services, and expected growth over time. This section is essential because revenue forecasting for an agency depends on the relationship between how many clients are acquired, what services they purchase, how much time is billed, and what rate is charged. By organizing these assumptions in one place, the template helps users build a revenue forecast that is connected to realistic operating drivers rather than broad top-down estimates. It also allows users to test strategic decisions, such as increasing rates, shifting toward recurring retainers, expanding performance marketing services, or improving client acquisition efficiency. Strong revenue inputs make the rest of the model more reliable because they feed directly into profitability, cash flow, staffing needs, and funding requirements.
Bank-Ready Reports
The bank-ready reports component provides lender-friendly financial outputs that can support financing applications, credit reviews, and formal business planning documents. This section typically consolidates financial statements and summaries in a clear format, including projected profit and loss, cash flow, balance sheet, funding needs, repayment capacity, and key financial metrics. For an advertising agency seeking a loan, line of credit, or working capital facility, lenders need to see whether the business can generate enough cash to cover operating costs, debt obligations, and unexpected shortfalls. Bank-ready reporting helps users present the agency’s plan in a structured way, with assumptions clearly linked to financial outcomes. It also helps users evaluate their own borrowing needs before approaching lenders by showing monthly and annual cash trends, profitability timing, and capital requirements. A professionally formatted reporting section saves time, improves clarity, and makes the model more useful for both external financing discussions and internal financial control.
Revenue Breakdown
The revenue breakdown component gives users a detailed view of how total agency revenue is generated across different service lines and client offerings. For an advertising agency, this may include monthly retainer campaigns, project-based campaigns, strategy and audit services, performance marketing, creative production, media management, or other customizable revenue streams. This section helps users understand which services contribute most to sales, which lines may have stronger margins, and how the service mix changes over time. It may use assumptions such as number of clients by service type, billable hours per client, pricing, frequency of purchase, and growth rates to calculate revenue by category. This is useful for planning because not all revenue is equal in an agency business. Retainers may create more predictable cash flow, while projects may generate larger but less consistent revenue. A clear revenue breakdown helps users make decisions about positioning, sales focus, staffing, pricing, and resource allocation while also giving investors and stakeholders a more transparent view of the agency’s commercial model.
KPI Dashboard
The KPI dashboard component tracks the key performance indicators that matter most for an advertising agency’s financial health and growth strategy. This section may include metrics such as revenue growth, gross margin, EBITDA margin, net profit margin, customer acquisition cost, cash balance, burn rate, runway, return on equity, payback period, break-even timing, and other performance benchmarks. For agency owners and founders, these KPIs help translate the financial model into practical management insights. Rather than focusing only on annual profit, users can monitor whether client acquisition is efficient, whether margins are improving, whether expenses are under control, and whether the business has enough liquidity to support growth. The KPI dashboard is also useful for presentations because it summarizes complex financial outputs into a concise performance view that investors, lenders, advisors, and leadership teams can understand quickly. By tracking these metrics over time, the agency can identify issues earlier, compare results against targets, and make better strategic decisions about marketing spend, hiring, pricing, and expansion.
Startup Cost and Initial Capital Planning
The startup cost and initial capital planning component helps users estimate how much funding is required before and during the early stages of launching or expanding an advertising agency. This section can include one-time expenses such as office furniture, IT equipment, laptops, software setup, website development, branding, legal and accounting fees, deposits, initial marketing campaigns, recruitment costs, and working capital reserves. It can also help users separate essential startup investments from optional spending, which is important for avoiding over-capitalization before the agency has consistent client revenue. The outputs from this component can show total launch costs, required initial funding, early cash runway, and the amount of capital needed to cover operating losses before the business becomes profitable. For founders preparing a business plan or funding request, this section is valuable because it provides a detailed explanation of how startup funds will be used. It also supports better decision-making by helping users determine whether to launch lean, raise additional capital, delay certain expenses, or prioritize spending that directly supports client acquisition and service delivery.
Break-Even Analysis
The break-even analysis component helps users identify when the advertising agency is expected to cover its cumulative costs and begin operating from a more sustainable financial position. This section may consider startup investments, fixed operating expenses, payroll, variable costs, freelancer costs, marketing spend, client acquisition costs, revenue growth, and gross profit contribution. The model can use these assumptions to estimate the break-even point by month or year, showing when revenues are sufficient to offset both ongoing costs and earlier losses. For an agency business, break-even analysis is especially useful because the first stages often require investment in marketing, tools, talent, branding, and sales before client revenue becomes stable. Understanding break-even timing helps users plan funding needs, manage cash flow, set realistic growth targets, and evaluate whether pricing or cost assumptions need to change. It also gives investors and lenders a clear milestone for assessing financial viability. If the break-even point appears too far away, users can test ways to improve it, such as increasing hourly rates, focusing on higher-margin retainers, improving client acquisition efficiency, reducing overhead, or managing staffing more carefully.
File types:
Excel – Single-User: .xlsx
Excel – Multi-User: .xlsx
Similar ProductsOther customers were also interested in...


 HenrySheykin
Direct Marketing Agency Financial Model Excel Temp...
The Direct Marketing Agency Financial Model helps turn an agency concept into a structured financial... Read more

Content Marketing Agency Financial Model Excel Tem...
The Marketing Agency Financial Model is a ready-to-use financial model template built to help agency... Read more

 City Finance
Digital Advertising Agency Finance Model Excel Tem...
A comprehensive editable 5 Year 3 Statement, MS Excel spreadsheet for tracking Digital Advertising A... Read more

Affiliate Marketing Agency Finance Model 5 Year 3 ...
A comprehensive editable, MS Excel spreadsheet for tracking Affiliate Marketing Agency finances, int... Read more
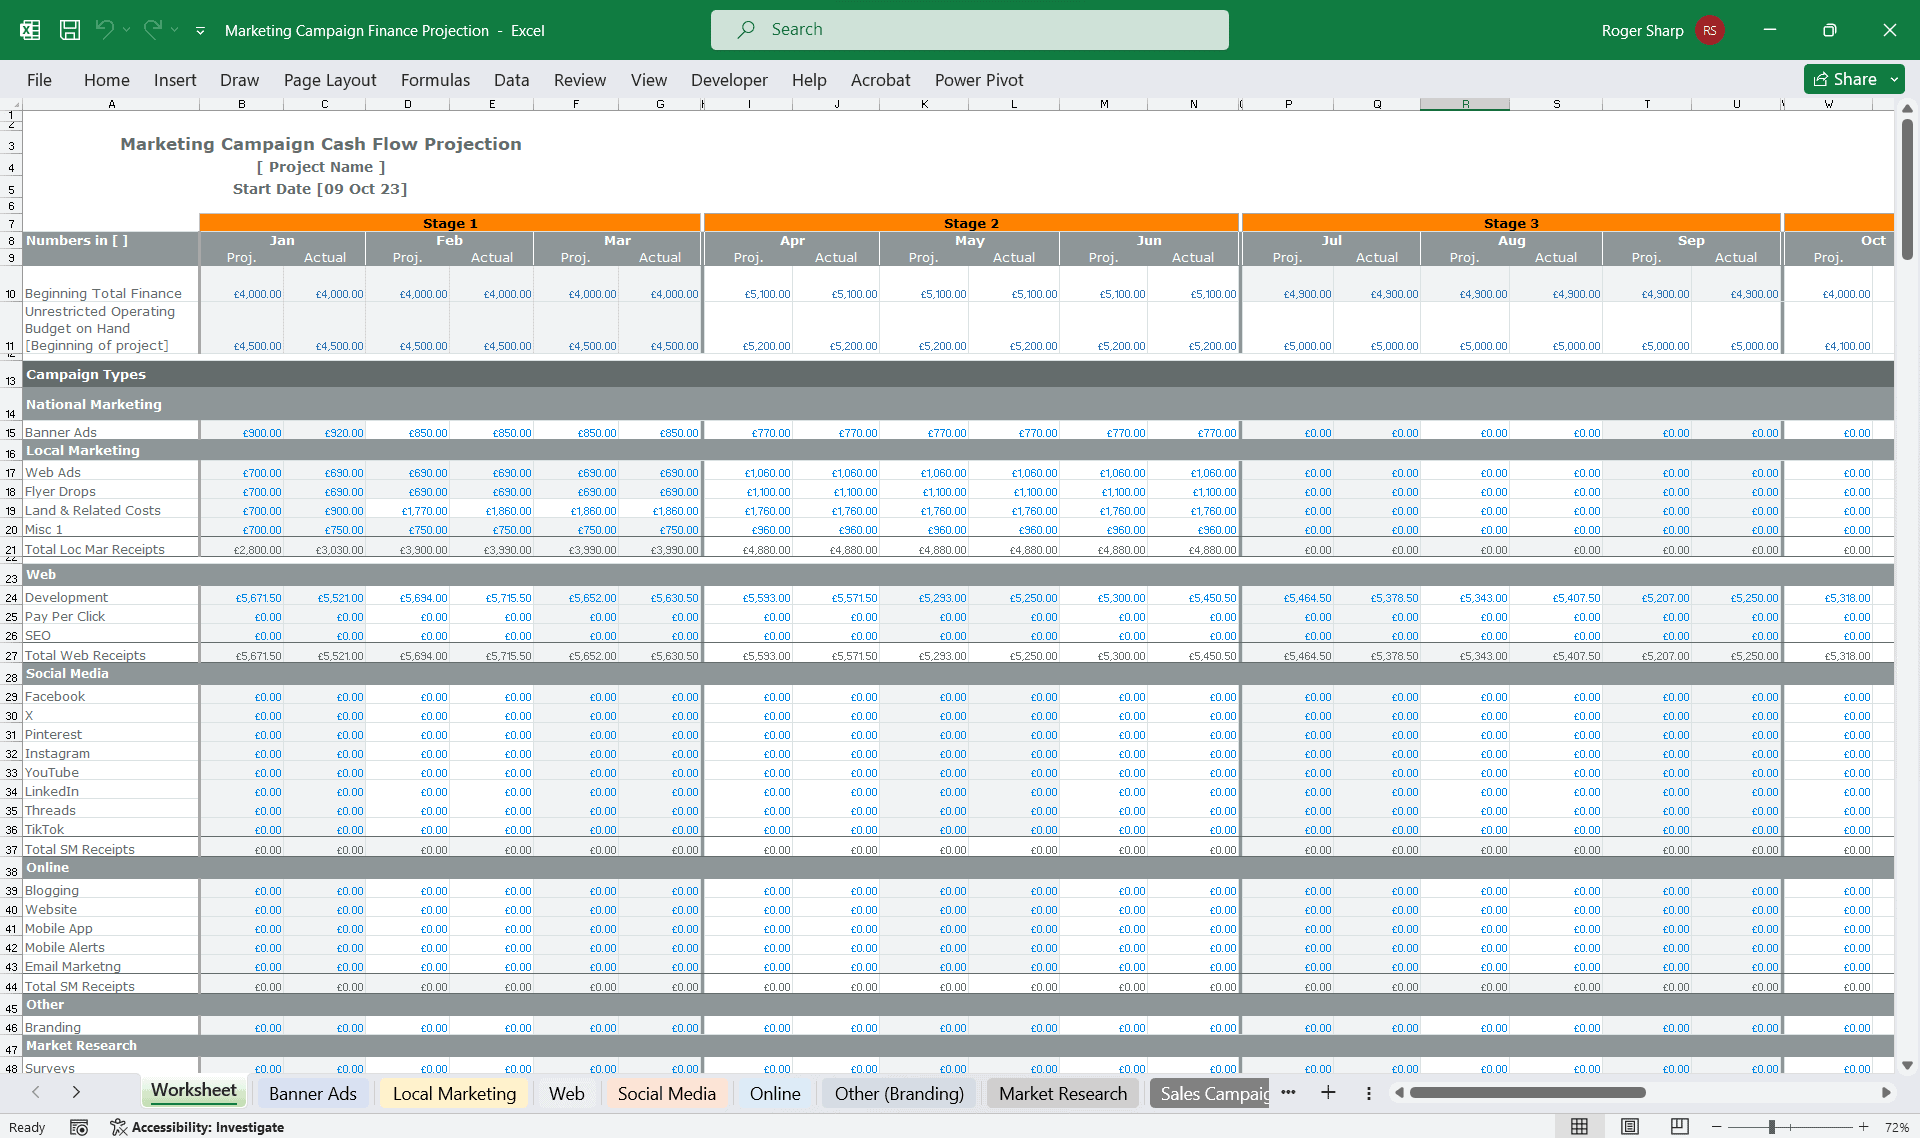
Marketing Campaign Financial Projection Model
Comprehensive editable, Excel spreadsheet for tracking marketing campaign financials in months or st... Read more

Digital Marketing Agency Financial Model Excel Tem...
The Digital Marketing Agency Financial Model helps agency founders, business owners, consultants, an... Read more

Social Media Agency Financial Model Excel Template
The Social Media Agency Financial Model helps users turn an agency concept, launch plan, or growth s... Read more

Public Relations Agency Financial Model Excel Temp...
The Public Relations Agency Financial Model helps entrepreneurs, agency founders, consultants, analy... Read more

Email Marketing Agency Financial Model Excel Templ...
The Email Marketing Agency Financial Model helps founders, agency owners, consultants, analysts, and... Read more
Real Estate Agency Financial Model Excel Template
The Real Estate Brokerage Financial Model Financial Model Template helps users build a structured fo... Read more
You must log in to submit a review.