
0 ITEMS

Branding Agency Financial Model Excel Template
The Branding Agency Financial Model helps users turn a creative services business plan into a structured financial forecast. Instead of starting with a blank spreadsheet, entrepreneurs, founders, consultants, analysts, and agency owners can work from a ready-to-use model designed around the financial drivers of a branding agency. The template helps organize revenue assumptions, startup costs, operating expenses, payroll, cash flow, profitability, and funding needs into one editable planning tool that can support launch planning, expansion decisions, investor discussions, or lender submissions. Built for branding firms, creative agencies, marketing consultants, and service-based business planners, the model gives users a practical way to estimate how client volume, service pricing, billable hours, retainers, project work, and cost structure affect financial performance over time. It is especially useful for people preparing business plans, pitch materials, loan applications, or internal budgets because it connects commercial assumptions with projected revenue, margins, cash flow, and profit outcomes. Users can adjust the inputs to reflect their own positioning, service mix, hiring strategy, pricing model, and growth expectations. The template supports financial planning by making the key moving parts of an agency easier to understand. Users can review how revenue streams contribute to total sales, how expenses scale as the business grows, how payroll and freelance support affect margins, and how cash balances change month by month. It also helps evaluate profitability and break-even timing, giving decision-makers a clearer view of when the agency may become self-sustaining and what assumptions need to hold true for the plan to work. Because the Branding Agency Financial Model is editable and compatible with Excel and Google Sheets, it can be customized for startups, established agencies, boutique studios, or consultants planning a more formal agency structure. It saves time, improves consistency, and provides a professional framework for testing scenarios, reviewing financial statements, and presenting a credible forecast to stakeholders. For anyone who needs a more disciplined way to plan, budget, and make financial decisions for a branding agency, this template provides a practical foundation.
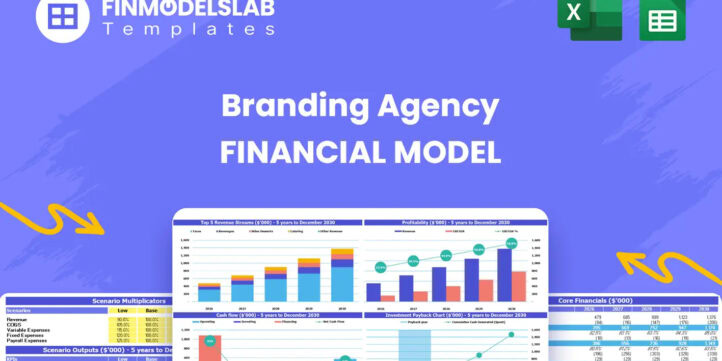


Financial Model Overview
The Branding Agency Financial Model is a ready-to-use financial planning template created for entrepreneurs, agency founders, business owners, consultants, and analysts who need to forecast the financial performance of a branding agency. It brings together the core assumptions behind a creative services business, including client acquisition, service pricing, billable work, retainers, startup investment, operating expenses, payroll, cash flow, profitability, and investor-facing outputs. The model is designed to help users move beyond rough estimates and build a structured financial plan that can be edited for a specific agency concept, market, team size, and growth strategy. Whether the goal is to launch a boutique branding studio, expand an existing creative agency, prepare a business plan, support a loan application, or discuss funding with investors, the template provides a practical framework for connecting business assumptions to financial outcomes over a multi-year forecast period.
All-in-One Dashboard
The all-in-one dashboard gives users a central view of the model’s most important inputs and outputs, making it easier to understand the financial health of the branding agency without moving through every worksheet manually. This section typically brings together core assumptions such as client growth, service pricing, revenue expectations, operating costs, staffing levels, capital requirements, and cash flow results, then translates them into high-level financial indicators. For a branding agency, this is especially useful because performance depends on multiple connected drivers, including the number of active clients, average project size, recurring retainers, utilization, payroll, freelance support, and marketing spend. The dashboard helps users quickly review projected revenue, EBITDA, cash balance, profitability, investment needs, and other decision-making metrics in one place. It is valuable for founders who need a fast planning snapshot, consultants preparing recommendations, and stakeholders who want to understand whether the agency plan appears financially viable before reviewing the detailed assumptions.
Low, Base, and High Scenario Analysis
The low, base, and high scenario analysis component allows users to test how the branding agency may perform under different business conditions. Instead of relying on one forecast, users can compare a conservative case, a realistic base case, and an optimistic growth case by adjusting important drivers such as customer acquisition cost, marketing effectiveness, client retention, hourly rates, project volume, retainer adoption, payroll timing, and operating expense levels. This is valuable because branding agencies can experience variable demand, uneven project pipelines, and different growth speeds depending on market conditions and sales execution. A low scenario can help identify cash flow risk, margin pressure, or slower break-even timing, while a high scenario can show the upside from stronger client acquisition, better pricing, or faster expansion. The scenario structure supports better strategic planning because it helps users understand which assumptions have the greatest impact on revenue, margins, cash flow, and funding requirements, giving decision-makers a more realistic view of risks and opportunities.
Professional Charts
The professional charts component turns key financial data into visual reports that are easier to understand, present, and discuss. Instead of reviewing only rows of numbers, users can see trends in revenue growth, expense structure, profitability, cash flow, client volume, margins, and other important metrics through presentation-ready visuals. For a branding agency, charts are useful because the business model often includes a mix of one-off brand identity projects, recurring brand management retainers, strategy workshops, and other service lines that may grow at different rates. Visualizing these patterns helps users explain how revenue is expected to scale, how costs change over time, and how profitability improves as the agency gains clients and operational efficiency. These charts can support investor presentations, bank meetings, internal planning sessions, and business plan documents by making the financial story clearer. They also help founders and managers spot trends more quickly, such as rising payroll as a percentage of revenue, improving margins, or potential cash flow pressure during growth periods.
ROE Components and DuPont Analysis
The ROE components and DuPont analysis section helps users evaluate return on equity by breaking profitability into its underlying drivers. Rather than looking only at a single return percentage, this component can separate performance into factors such as net profit margin, asset efficiency, and financial leverage, helping users understand why returns are improving or declining. For a branding agency, this type of analysis is useful because the business is typically asset-light but highly dependent on pricing power, labor productivity, client retention, and expense control. Users can examine whether projected returns are driven mainly by stronger margins, better use of resources, or changes in financing structure. This can be particularly helpful for investors, partners, or owners who want to understand the quality of the agency’s financial performance rather than simply seeing headline profit figures. By connecting return on equity to operational assumptions, the model supports more informed decision-making about pricing, staffing, reinvestment, debt, owner equity, and growth strategy.
Revenue Inputs
The revenue inputs component gives users a structured place to define the assumptions that drive the branding agency’s sales forecast. This may include the number of active clients, expected new client acquisition, average billable hours, hourly rates, project fees, monthly retainers, workshop pricing, marketing spend, customer acquisition cost, conversion expectations, and pricing growth over time. For a branding agency, revenue is rarely generated from one simple source, so this section is important for modeling different services such as brand identity packages, ongoing brand management, strategy workshops, naming projects, visual identity systems, and consulting engagements. The template can help users connect marketing efforts and sales assumptions to client volume, then connect service pricing and delivery assumptions to total revenue. Because these inputs are editable, users can tailor the model to a premium agency, niche studio, freelancer-led firm, or larger team-based operation. This section is useful for planning because it makes the sales forecast transparent, testable, and easier to explain to investors, lenders, partners, and internal teams.
Bank-Ready Reports
The bank-ready reports component organizes the model’s financial outputs into a format suitable for lenders, financing discussions, and formal business planning. These reports may include projected income statements, cash flow forecasts, balance sheet summaries, debt service assumptions, profitability metrics, and other financial statements that help a bank or stakeholder assess repayment capacity and business stability. For a branding agency seeking a startup loan, working capital facility, equipment financing, or expansion funding, lender-friendly reporting is important because it shows how revenue, expenses, cash flow, and profit are expected to develop over time. This section helps users present the forecast in a professional and consistent format, rather than submitting scattered assumptions or informal calculations. It can also help identify whether the agency has enough cash to cover operating needs, payroll, software, rent, marketing, and debt obligations. By providing structured outputs, the model supports more credible conversations with lenders, advisors, and decision-makers who need clear financial evidence before approving funding or moving forward.
Revenue Breakdown
The revenue breakdown component provides a detailed view of how each service line contributes to total agency revenue. For a branding agency, this may separate revenue from brand identity packages, ongoing brand management retainers, strategy workshops, consulting, creative direction, campaign development, naming, visual systems, or other service categories. This section helps users understand not only how much revenue the agency may generate, but where that revenue is coming from and how dependent the business is on specific offerings. Inputs may include service pricing, client volume, billable hours, project frequency, retainer duration, and expected growth by revenue stream. The outputs can show the percentage contribution of each service, year-over-year changes, and the impact of shifting the service mix toward higher-margin or more predictable income sources. This is useful for budgeting and decision-making because it helps agency owners identify which services deserve more sales focus, which offerings may need pricing adjustments, and how recurring revenue can improve stability compared with one-off project work.
KPI Dashboard
The KPI dashboard focuses on performance metrics and benchmarks that help users monitor whether the branding agency is operating according to plan. This section may track key indicators such as revenue growth, gross margin, EBITDA margin, cash balance, client count, average revenue per client, customer acquisition cost, payback period, utilization, operating expense ratios, and profitability benchmarks. For a branding agency, KPIs are essential because financial success depends on both creative output and operational discipline. A growing agency may appear healthy from a revenue standpoint but still face pressure if payroll expands too quickly, freelancers are overused, client acquisition costs rise, or retainers fail to renew. The KPI dashboard helps users compare projected performance against internal goals or industry standards and identify potential issues before they become major financial problems. It is also useful for stakeholder reporting because it turns the forecast into a concise management view that supports regular reviews, investor updates, strategic decisions, and performance improvement discussions.
Startup Cost Breakdown
The startup cost breakdown component helps users estimate the initial investment required to launch or prepare the branding agency for operations. This section may include office setup, furniture, computers, design equipment, software subscriptions, website development, legal and registration fees, branding materials, initial marketing, deposits, insurance, professional services, and working capital reserves. For a branding agency, startup costs can vary widely depending on whether the business begins as a remote studio, a small office-based team, or a more formal agency with dedicated workstations and client-facing space. By separating one-time launch expenses from recurring operating costs, the model helps users understand how much funding may be needed before the agency begins generating reliable revenue. This is useful for founders preparing a capital plan, applying for financing, or deciding whether to bootstrap the business. A clear startup cost view also helps prevent underfunding by showing the cash required to cover setup needs, early marketing, technology, and the first months of operations before client collections become consistent.
Break-Even Analysis
The break-even analysis component helps users identify when the branding agency’s total revenue is expected to cover total costs. This section typically uses revenue assumptions, fixed expenses, variable costs, payroll, freelance costs, and gross margin inputs to calculate the point at which the business becomes self-sustaining. For a branding agency, break-even timing is a critical milestone because early months may include upfront setup costs, marketing investment, hiring decisions, and uneven client collections. The model helps users understand how many clients, projects, retainers, or billable hours may be needed to cover monthly costs, and how pricing or expense changes can accelerate or delay profitability. This is valuable for planning because it gives founders a concrete financial target and helps them evaluate whether the business model is realistic under current assumptions. It also supports funding conversations by showing investors, lenders, and partners when the agency may no longer depend on startup capital or external financing to cover operating expenses.
File types:
Excel – Single-User: .xlsx
Excel – Multi-User: .xlsx
Similar ProductsOther customers were also interested in...


 HenrySheykin
Digital Marketing Agency Financial Model Excel Tem...
The Digital Marketing Agency Financial Model helps agency founders, business owners, consultants, an... Read more

Digital Strategy Agency Financial Model Excel Temp...
The Digital Transformation Agency Financial Model helps founders, consultants, analysts, and busines... Read more

Direct Marketing Agency Financial Model Excel Temp...
The Direct Marketing Agency Financial Model helps turn an agency concept into a structured financial... Read more

Public Relations Agency Financial Model Excel Temp...
The Public Relations Agency Financial Model helps entrepreneurs, agency founders, consultants, analy... Read more

Content Marketing Agency Financial Model Excel Tem...
The Marketing Agency Financial Model is a ready-to-use financial model template built to help agency... Read more
Traditional Advertising Agency Financial Model Exc...
The Advertising Agency Financial Model helps founders, agency owners, consultants, analysts, and bus... Read more
CRM Software Financial Model Excel Template
The CRM Software Financial Model is a ready-to-use financial model template designed to help founder... Read more

Email Marketing Agency Financial Model Excel Templ...
The Email Marketing Agency Financial Model helps founders, agency owners, consultants, analysts, and... Read more
Real Estate Agency Financial Model Excel Template
The Real Estate Brokerage Financial Model Financial Model Template helps users build a structured fo... Read more

Social Media Agency Financial Model Excel Template
The Social Media Agency Financial Model helps users turn an agency concept, launch plan, or growth s... Read more
You must log in to submit a review.