
0 ITEMS

Digital Strategy Agency Financial Model Excel Template
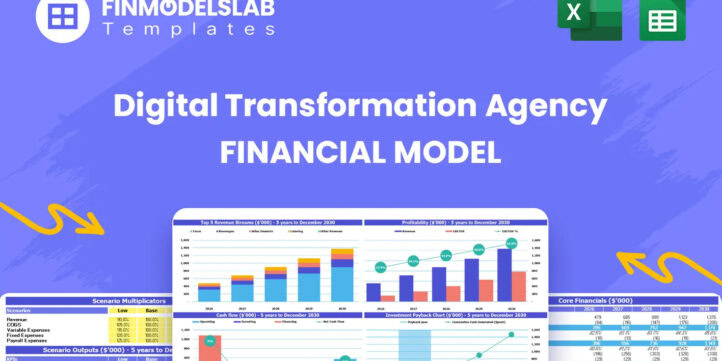
The Digital Transformation Agency Financial Model helps founders, consultants, analysts, and business owners turn a service-based growth idea into a structured financial forecast. Instead of starting with a blank spreadsheet, users can work from a ready-to-use financial model template designed around the economics of a digital transformation agency, including client acquisition, billable service delivery, retainers, technology infrastructure, staffing, startup costs, and ongoing operating expenses. It gives users a practical way to estimate how the agency may perform before launch, expansion, investor discussions, or lender review. This template is especially useful for entrepreneurs preparing a business plan, consultants building forecasts for clients, agency owners planning a new service line, and finance professionals who need a clear framework for decision-making. The model supports financial planning by connecting revenue assumptions with the underlying drivers of the agency, such as active customers, billable hours, service pricing, project work, recurring retainers, payroll, subcontractor costs, and customer acquisition costs. By adjusting editable assumptions, users can see how changes in pricing, staffing, utilization, sales growth, or cost structure affect revenue, cash flow, profitability, and long-term performance. The Digital Transformation Agency Financial Model also helps users evaluate startup costs, operating expenses, and funding needs with more confidence. It organizes the initial investment required to launch or scale the business, while also forecasting monthly and annual cash flow so users can identify liquidity needs before they become problems. Automated financial statements, dashboards, charts, and investor-ready outputs help translate the forecast into a professional presentation format for internal planning, funding documents, stakeholder meetings, or strategic reviews. Because digital transformation agencies often combine consulting projects, automation retainers, analytics retainers, cybersecurity services, and managed advisory work, a flexible model is essential. This financial model template allows users to test low, base, and high scenarios, review profitability, estimate break-even timing, and understand whether the business can scale sustainably. It is built to support better decision-making by showing not only what the agency could earn, but what resources, costs, margins, and cash flow discipline are required to reach sustainable profitability.


Financial Model Overview
The Digital Transformation Agency Financial Model is a ready-to-use financial model template built for entrepreneurs, agency founders, consultants, analysts, and business owners who need to forecast the financial performance of a digital transformation consulting business. A digital transformation agency typically earns revenue through advisory projects, implementation roadmaps, process automation, analytics support, managed cybersecurity, and recurring transformation retainers, which means the forecast must connect service demand, billable capacity, pricing, staffing, delivery costs, and client growth in one structured model. This template helps users estimate revenue, operating expenses, payroll, startup investment, profitability, cash flow, and funding needs over a multi-year planning period. It is useful for business planning, investor presentations, bank discussions, internal budgeting, and strategic decision-making because it turns assumptions into clear financial outputs. Instead of manually building formulas and reports from scratch, users can customize the editable assumptions, review automated calculations, and use the model to understand how the agency could perform under realistic operating conditions.
All-in-One Dashboard
The all-in-one dashboard brings the most important inputs and outputs of the Digital Transformation Agency Financial Model into one clear planning area. This component is designed to help users quickly understand the overall financial position of the agency without moving through every underlying tab or calculation. It may include core assumptions such as service pricing, customer growth, billable hours, cost percentages, payroll structure, startup investment, and working capital requirements, while also displaying outputs such as revenue, EBITDA, net profit, cash balance, funding needs, and return metrics. For a digital transformation agency, this is especially helpful because the business model depends on several connected drivers, including client acquisition, consultant utilization, retainer growth, and service mix. The dashboard allows founders and finance users to check whether the model is producing a practical financial story and to spot issues quickly if revenue growth, margins, or liquidity do not look sustainable. It is useful for planning and decision-making because it gives users a central view of the forecast and makes it easier to communicate the business case to investors, lenders, partners, or internal stakeholders.
Low Base High Scenario Analysis
The low, base, and high scenario analysis component helps users evaluate how the agency may perform under different market conditions and operating assumptions. A digital transformation agency can experience wide variations in performance depending on sales cycle length, client conversion rates, average billable hours, retainer adoption, consultant utilization, subcontractor costs, and customer acquisition cost. This section allows users to compare a conservative case, an expected case, and an upside case so they can understand how changes in key assumptions affect revenue, margins, cash flow, and profitability. For example, a low scenario may assume slower client acquisition, lower billable utilization, or higher marketing costs, while a high scenario may reflect stronger demand, more recurring retainers, better pricing power, or improved delivery efficiency. The outputs help users assess risk, set realistic targets, and identify the amount of capital required if growth is slower than planned. This component is valuable for investor and lender discussions because it demonstrates that the user has considered uncertainty rather than relying on a single optimistic forecast. It also supports strategic decision-making by showing which assumptions have the greatest impact on financial outcomes.
Professional Charts
The professional charts component converts financial model outputs into visual summaries that are easier to interpret and present. Digital transformation agency forecasts often contain many moving parts, including monthly revenue growth, operating expenses, payroll, gross margin, EBITDA, cash flow, client volume, and service line performance. Charts help simplify those details by showing trends, comparisons, and performance patterns over time. This section may include visuals for revenue growth, expense categories, cash balance, profitability, break-even timing, margins, and key performance indicators. These charts are useful for founders preparing pitch decks, consultants presenting to clients, analysts summarizing planning results, or business owners reviewing forecasts with partners and advisors. Because financial projections can be difficult for non-financial audiences to digest, visual outputs make the forecast more accessible and help stakeholders quickly understand the agency’s financial direction. The charts also help users identify whether expenses are growing too quickly, whether cash flow is improving, whether revenue is becoming more recurring, and whether the business is moving toward sustainable profitability. This presentation-ready component improves the professionalism of the model and supports clearer communication in funding, planning, and review meetings.
ROE Components and DuPont Analysis
The ROE components and DuPont analysis section helps users understand the drivers behind return on equity rather than looking at a single return percentage in isolation. For a digital transformation agency, return on equity can be influenced by profit margin, asset efficiency, capital structure, and the way the business uses owner or investor capital to generate earnings. This component breaks down return performance into more meaningful parts, helping users evaluate whether returns are being driven by strong profitability, efficient use of assets, appropriate leverage, or a combination of factors. Inputs may include net income, revenue, assets, equity, debt, and other balance sheet and income statement figures. Outputs may include return on equity, profit margin, asset turnover, equity multiplier, and related performance indicators. This is useful for investors, analysts, and agency owners because it provides a more detailed view of financial efficiency and capital productivity. If the agency is generating revenue but producing weak returns, the DuPont-style analysis can help identify whether the issue is low margins, underutilized resources, excess overhead, or an inefficient capital structure. It supports better decision-making by showing how operational performance and financing choices combine to affect investor returns.
Revenue Inputs
The revenue inputs component is where users define the main commercial assumptions that drive the digital transformation agency forecast. This section is especially important because agency revenue is typically created through billable service lines, recurring retainers, project engagements, and advisory packages. Inputs may include the number of active customers, expected customer growth, average billable hours per client, hourly rates, monthly retainer fees, service line adoption, churn assumptions, and ramp-up timing. A digital transformation agency may offer services such as digital transformation roadmaps, process automation retainers, data analytics retainers, managed cybersecurity retainers, systems integration, change management, and technology advisory support. By entering or adjusting these assumptions, users can model how different service offerings contribute to total revenue over time. This component helps users avoid vague top-down revenue estimates and instead build a forecast from the operational drivers of the business. It is useful for business planning because it shows what level of client activity, pricing, and delivery capacity is needed to reach the desired revenue target. It also helps users evaluate whether assumptions are realistic, whether the agency has enough staffing to deliver the projected work, and whether recurring revenue can improve stability and profitability.
Bank-Ready Reports
The bank-ready reports component organizes the financial outputs into a format suitable for lender review, credit discussions, and formal funding documentation. Banks and lenders typically want to see structured financial statements, clear assumptions, debt capacity, cash flow coverage, profitability projections, and evidence that the business can meet its obligations. This section may include income statement forecasts, cash flow statements, balance sheet projections, loan repayment schedules, EBITDA summaries, working capital analysis, and key ratios relevant to financing decisions. For a digital transformation agency, lender-friendly reporting is important because the business may require startup capital for office setup, IT infrastructure, software tools, training, certifications, marketing, hiring, and working capital before revenue reaches a stable level. These reports help users present a credible financial case by showing how the agency expects to generate revenue, manage expenses, maintain liquidity, and repay borrowed funds. The component is useful for entrepreneurs applying for loans, founders preparing funding packages, consultants supporting client financing applications, or owners planning expansion. It saves time by producing organized financial outputs that can be reviewed, exported, shared, or incorporated into a larger business plan.
Revenue Breakdown
The revenue breakdown component provides a detailed view of revenue by stream, service category, or business line. A digital transformation agency rarely relies on one source of income, so this section helps users understand how each service contributes to total sales and profitability. Revenue streams may include one-time transformation roadmaps, implementation projects, process automation retainers, data analytics retainers, managed cybersecurity retainers, technology advisory packages, ongoing optimization support, and custom consulting engagements. Inputs may include pricing, billable hours, retainer rates, customer counts, service adoption rates, renewal assumptions, and timing of new contracts. Outputs may show monthly and annual revenue by service line, percentage contribution by stream, growth trends, and the balance between project-based and recurring revenue. This is useful because not all revenue streams have the same margin, delivery effort, predictability, or cash flow profile. For example, roadmap projects may generate strong upfront revenue, while retainers can create more stable recurring income and improve forecasting reliability. By reviewing the revenue breakdown, users can decide which services to prioritize, whether to adjust pricing, where to allocate sales resources, and how to build a more resilient revenue mix. It supports strategic planning by connecting service strategy with measurable financial outcomes.
KPI Dashboard and Performance Benchmarks
The KPI dashboard and performance benchmarks component gives users a focused view of the operational and financial metrics that matter most for a digital transformation agency. Key performance indicators may include revenue growth, gross margin, EBITDA margin, net profit margin, cash balance, customer acquisition cost, payback period, consultant utilization, average revenue per client, recurring revenue share, churn, return on equity, and break-even timing. Benchmarking allows users to compare their forecasted performance against reasonable industry standards or internal targets, helping validate assumptions and identify areas that need improvement. This section is valuable because agency owners often need to manage both financial results and operational performance. A forecast may show revenue growth, but the KPI dashboard can reveal whether that growth depends on unrealistic utilization, excessive customer acquisition costs, or margins that are below target. It helps users monitor whether the agency is becoming more efficient as it scales and whether operating performance supports long-term profitability. For investor presentations and management reviews, KPI outputs provide a concise way to communicate progress, risks, and priorities. This component supports better decision-making by turning detailed financial projections into measurable business performance indicators.
Startup and Operating Cost Planning
The startup and operating cost planning component helps users estimate the investment required to launch and run a digital transformation agency. Startup costs may include office setup, furnishings, initial IT infrastructure, servers, laptops, software subscriptions, cybersecurity tools, website development, branding, legal fees, accounting setup, insurance, initial marketing, consultant training, professional certifications, and working capital reserves. Operating expenses may include payroll, contractor fees, software licenses, rent, utilities, marketing, sales tools, travel, professional services, recruiting, training, administrative expenses, and general overhead. This section may separate one-time launch costs from recurring monthly expenses so users can understand both the upfront funding requirement and the ongoing cost base. For a digital transformation agency, this distinction matters because the business may require skilled consultants and technology resources before it has fully scaled its client base. The component helps users budget realistically, avoid underestimating launch capital, and assess whether projected revenue can support the planned operating structure. It is also useful for funding preparation because it clarifies how much money is needed, where that money will be spent, and how operating costs change as the agency grows. By adjusting cost assumptions, users can test lean, moderate, or expansion-focused operating plans.
Break-Even and Payback Analysis
The break-even and payback analysis component helps users understand when the digital transformation agency may become profitable and how long it may take to recover the initial investment. Break-even analysis typically compares revenue, gross margin, fixed expenses, variable costs, payroll, and contribution margin to determine the sales level or timing required for the business to cover its costs. Payback analysis focuses on how quickly the initial capital invested in the agency can be recovered through future cash flows or profits. Inputs may include startup investment, pricing, client volume, billable hours, retainer revenue, cost of goods sold, subcontractor costs, payroll, marketing expenses, and overhead. Outputs may include the break-even month, cumulative profit or cash flow, required monthly revenue, required client count, and months to payback. This is particularly valuable for a service business because profitability can improve quickly once fixed costs are covered and consultant utilization increases.
Similar ProductsOther customers were also interested in...


 City Finance
Bookkeeping Agency Finance Model Excel Template
A comprehensive editable, MS Excel spreadsheet for tracking Bookkeeping services finances, including... Read more

 HenrySheykin
Insurance Agency Financial Model Excel Template
The Insurance Agency Financial Model helps entrepreneurs, agency owners, consultants, analysts, and ... Read more
Digital Marketing Agency Financial Model Excel Tem...
The Digital Marketing Agency Financial Model helps agency founders, business owners, consultants, an... Read more
Travel Agency Financial Model Excel Template
The Travel Agency Financial Model helps entrepreneurs, founders, consultants, analysts, and business... Read more
Recruitment Agency Financial Model Excel Template
The Recruiting Agency Financial Model helps founders, agency owners, consultants, and analysts build... Read more

Branding Agency Financial Model Excel Template
The Branding Agency Financial Model helps users turn a creative services business plan into a struct... Read more
Bookkeeping Agency Financial Model Excel Template
The Accounting Firm Financial Model Template helps founders, practice owners, consultants, analysts,... Read more
Direct Marketing Agency Financial Model Excel Temp...
The Direct Marketing Agency Financial Model helps turn an agency concept into a structured financial... Read more

Public Relations Agency Financial Model Excel Temp...
The Public Relations Agency Financial Model helps entrepreneurs, agency founders, consultants, analy... Read more

Content Marketing Agency Financial Model Excel Tem...
The Marketing Agency Financial Model is a ready-to-use financial model template built to help agency... Read more
You must log in to submit a review.