
0 ITEMS

5-Year Projected Income Statement: Build One Step by Step

The eFinancialModels Editorial Team — financial modeling specialists with 10+ years building financial models for SaaS, real estate, and energy projects.
A 5-year projected income statement translates strategic ambitions into quantified, year-by-year financial milestones.
Key Takeaways
- A 5-year projected income statement forecasts revenue, COGS, operating expenses, and net income annually, giving founders and investors a quantified view of long-term profitability.
- Five years is the standard strategic horizon because lenders and investors want at least 3 years of projections, and strategic planning typically extends 3 to 5 years beyond the current operating cycle.
- Year 1 projections should be monthly; years 2 through 5 can be quarterly or annual, matching the decreasing certainty of longer-range forecasts.
- Personnel costs drive 60 to 70% of total expenses for service companies and 15 to 30% for product companies, making payroll the single most important line item to model carefully.
- Always build three scenarios: base case, best case, and worst case. Advisors consistently recommend this approach to stress-test assumptions before presenting to investors.
- Break-even analysis embedded in the 5-year model shows the exact period when cumulative revenue first covers cumulative costs, a critical milestone for fundraising conversations.
- Sensitivity analysis on just two variables, revenue growth rate and gross margin, typically explains 80% of the variance in projected net income.
What Is a 5-Year Projected Income Statement and Why Five Years?
A 5-year projected income statement is a forward-looking financial document that estimates a company’s revenue, cost of goods sold (COGS), operating expenses, and net income for each of the next five years. It answers the question every investor and lender asks first: will this business make money, and when?
The five-year horizon is not arbitrary. Monthly projections are generally prepared for 12 to 18 months for operational planning, while quarterly projections commonly extend 3 to 5 years for strategic planning and long-term decision-making (McCracken Alliance, 2023). Most financial lenders and investors want to see at least a three-year sales forecast included in a startup’s business plan How to Create a Financial Forecast for a Startup Business Plan. Five years pushes beyond that minimum to capture a full strategic cycle: product maturation, market penetration, and the first meaningful profitability inflection.
Three years satisfies a lender’s credit underwriting. Five years satisfies a growth investor’s return thesis. If you’re raising equity, build five.
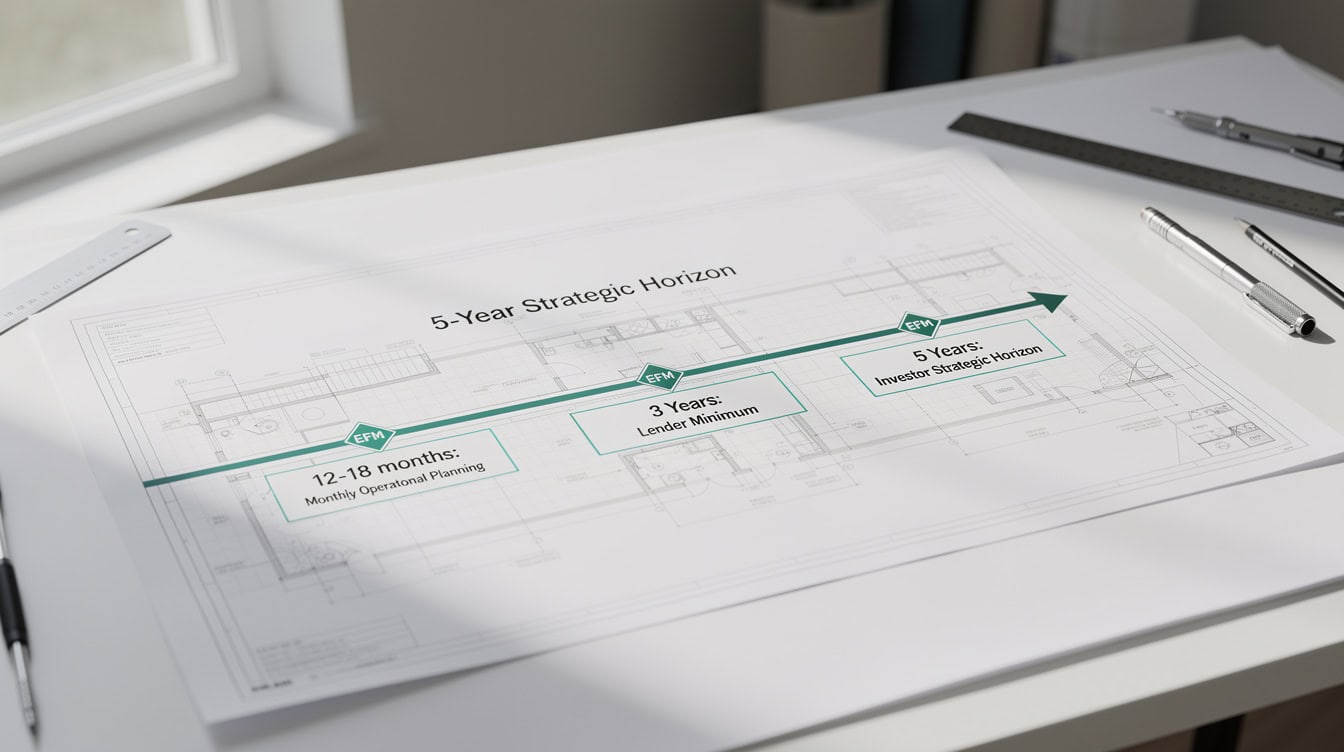
The 5-year horizon captures a full strategic cycle: product maturation, market penetration, and the first profitability inflection.
How the Projected Income Statement Fits Into the Pro Forma Financial Statement Set
The projected income statement does not stand alone. A complete 5-year pro forma financial statement set includes three core statements: the income statement, the balance sheet, and the cash flow statement, each showing a different dimension of financial health over the five-year horizon (Creating 5-Year Pro Forma Financial Statements: A Step-By-Step Guide)
Here is how the three statements connect:
- Projected income statement (also called a pro forma profit and loss, or P&L): shows revenue, expenses, and net income. It answers “Are we profitable?”
- Projected balance sheet: shows assets, liabilities, and equity at the end of each year. It answers “What do we own and owe?”
- Projected cash flow statement: shows cash inflows and outflows. It answers “Do we have enough cash to operate?”
Net income from the income statement flows into retained earnings on the balance sheet. Depreciation and working capital changes from the income statement and balance sheet feed the cash flow statement. Build all three, or your model will have blind spots.
For a ready-built three-statement structure, the EFM 5-year financial projections templates include all three statements pre-linked.
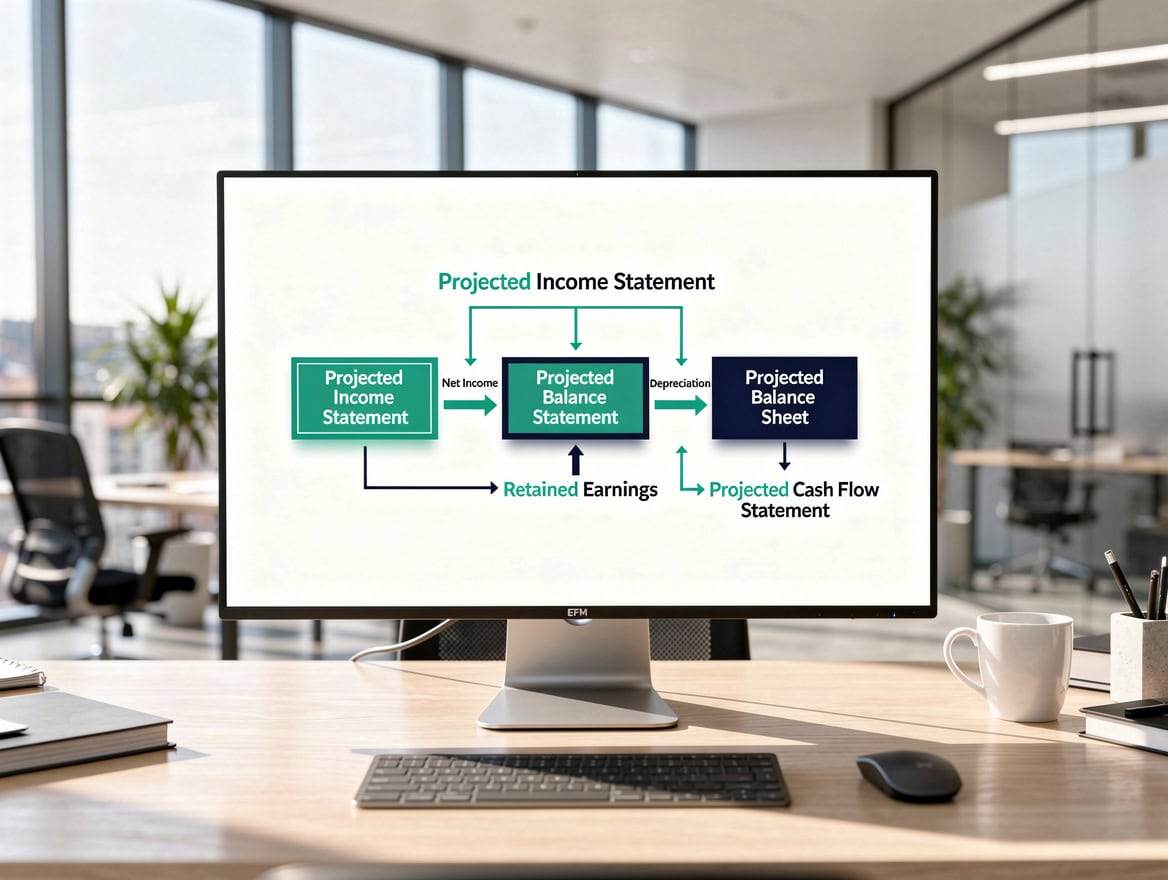
Net income from the income statement flows directly into retained earnings on the balance sheet, linking all three pro forma statements.
Core Components of a Projected Income Statement: Line-by-Line Breakdown
Every projected income statement follows the same logical cascade from top-line revenue down to bottom-line net income. Each line item is defined below on first use.
- Revenue (also called net sales or top line): total income from selling goods or services before any costs are deducted. Formula:
Units Sold × Average Selling Price. - Cost of Goods Sold (COGS): the direct costs of producing what you sell, including raw materials, direct labor, and manufacturing overhead. Formula:
Beginning Inventory + Purchases - Ending Inventory, or for service businesses,Direct Labor Hours × Billable Rate. - Gross Profit: revenue minus COGS. Formula:
Revenue - COGS. Gross profit margin (gross profit divided by revenue) is the first profitability checkpoint. - Operating Expenses (OpEx): costs incurred to run the business that are not directly tied to production. Includes salaries, rent, marketing, software subscriptions, and depreciation.
- Operating Income (EBIT): earnings before interest and taxes. Formula:
Gross Profit - Operating Expenses. This is the core measure of operational efficiency. - Interest Expense: the cost of any debt financing. Subtract from EBIT.
- Earnings Before Tax (EBT):
EBIT - Interest Expense. - Tax Expense: apply the applicable corporate tax rate to EBT.
- Net Income: the final bottom line. Formula:
EBT - Tax Expense.
For a complete set of linked financial statements templates, EFM offers models that auto-populate all nine line items from a single assumptions tab.
Setting the Right Granularity: Monthly, Quarterly, and Annual Projections
Granularity, meaning how finely you slice the time periods in your model, should decrease as you project further into the future. Financial projections for new or small businesses typically cover three to five years, with the first year presented monthly and later years often shown quarterly or annually (Financial Projections for Small Businesses: Definition and Examples).
Why does granularity decrease? Because forecast accuracy degrades with distance. A monthly cash flow projection for month 3 can be grounded in signed contracts and known payroll dates. A monthly projection for month 47 is speculation dressed as precision.
| Period | Recommended Granularity | Primary Use Case |
|---|---|---|
| Year 1 (months 1-12) | Monthly | Cash management, burn rate, hiring triggers |
| Year 2 | Quarterly | Operational milestones, budget setting |
| Years 3-5 | Annual | Strategic planning, investor return modeling |
For a startup raising a seed round, monthly Year 1 projections are non-negotiable. Investors will stress-test your runway month by month.
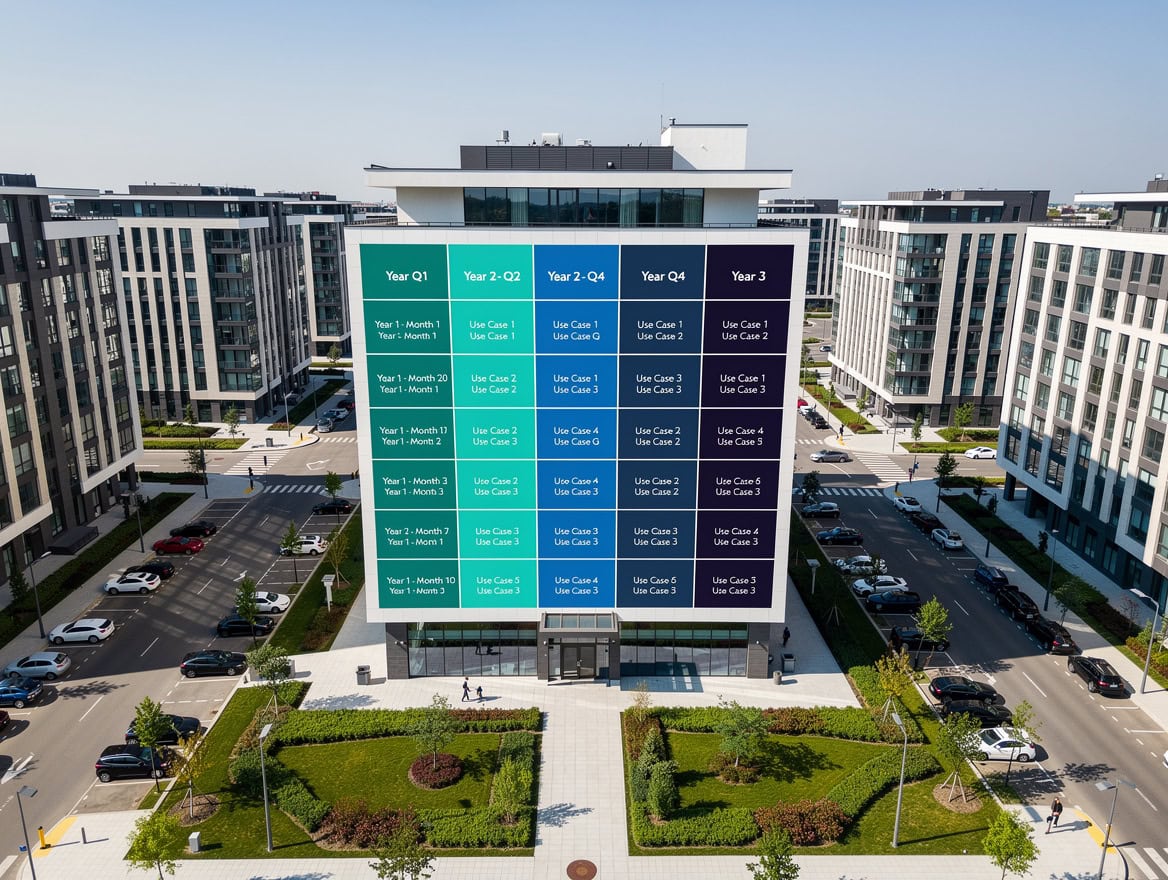
Forecast accuracy degrades with distance: monthly precision in Year 1 gives way to annual strategic estimates by Year 5.
Building Revenue Projections: Methods, Formulas, and Market-Based Assumptions
Revenue projection is the most consequential step in the entire model because every downstream line item scales from it. There are three defensible methods, and the best models use all three as cross-checks.
Method 1: Bottom-up (unit economics)
Start with the number of customers or units you can realistically acquire, then multiply by average revenue per unit.Projected Revenue = Estimated Customers × Average Contract Value
Example: 200 customers in Year 1 × $4,800 annual contract value = $960,000 Year 1 revenue.
Method 2: Top-down (market share)
Start with the total addressable market (TAM), then apply a realistic market penetration rate.Projected Revenue = TAM × Market Share %
Example: $500M TAM × 0.2% penetration = $1M Year 1 revenue. Use this as a sanity check against your bottom-up number, not as the primary driver.
Method 3: Historical growth rate
For existing businesses, apply a year-over-year growth rate derived from the past 2 to 3 years of actuals.Year N Revenue = Year (N-1) Revenue × (1 + Growth Rate)
Example: $800,000 Year 1 revenue × 1.25 = $1,000,000 Year 2 revenue (25% growth).
Always document your growth rate assumptions explicitly. “We assume 25% growth because our industry grew at 18% last year and we are adding two sales reps” is a defensible assumption. “We assume 25% growth” is not.
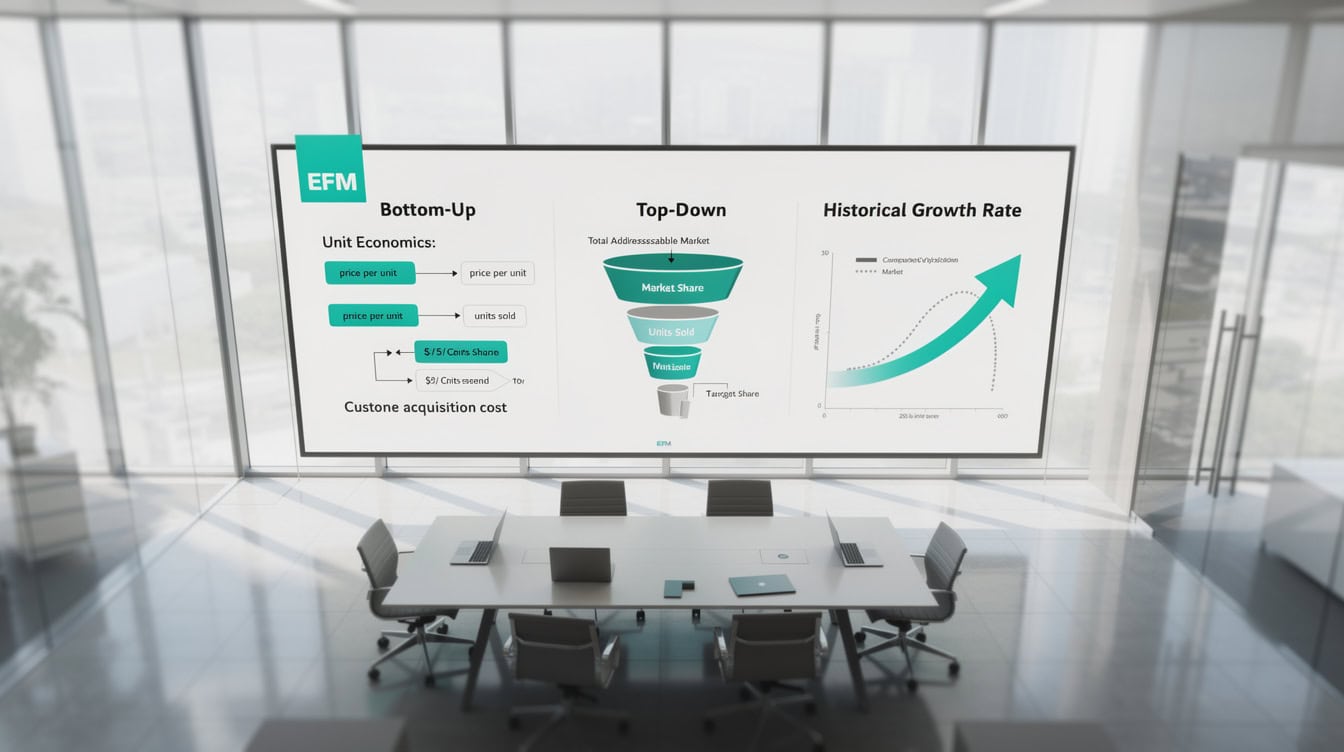
Cross-checking all three revenue methods against each other is the fastest way to identify an unrealistic assumption before investors do.
Projecting Operating Expenses: Personnel Costs and Other Key Drivers
Operating expenses are where most first-time projections go wrong, primarily because founders underestimate payroll. Personnel costs account for roughly 60 to 70% of total expenses for service companies and about 15 to 30% of total expenses for product-based companies, making them the critical driver in multi-year projected income statements (How To Develop Financial Projections That Impress Investors)
Here is a practical framework for projecting each major OpEx category:
Personnel costs: build a headcount plan by role, with hire dates and fully loaded costs (salary + benefits + payroll taxes, typically 1.2x to 1.3x base salary).
Rent and facilities: fixed or step-fixed. Model any planned office expansions as discrete jumps in a specific year.
Marketing and sales: often modeled as a percentage of revenue (e.g., 15% of revenue in Years 1-2, declining to 10% as brand awareness builds).
Software and subscriptions: itemize known tools. Scale with headcount for per-seat licenses. Microsoft Excel, one of the most widely used financial modeling tools, supports up to 64 levels of nested functions (IF function), which is more than sufficient for even the most complex OpEx formulas you will build in a 5-year model.
Depreciation: a non-cash expense that reduces taxable income. For straight-line depreciation (the simplest method, where an asset loses equal value each year), the formula is: Annual Depreciation = (Asset Cost - Salvage Value) / Useful Life in Years.

Personnel costs dominate service company budgets at 60 to 70% of total expenses, making headcount planning the most critical modeling step.
Three-Scenario Modeling: Base Case, Best Case, and Worst Case Examples
A single-point projection is a guess. Three scenarios are a plan. Many advisors recommend at least three scenarios, base case, best case, and worst case, to stress-test the projected income statement and overall financial model (How to Create a Financial Forecast for a Startup Business Plan).
Here is a worked example for a SaaS company with $960,000 in Year 1 base-case revenue:
| Scenario | Revenue Growth (Yr 2) | Gross Margin | OpEx Growth | Year 2 Net Income |
|---|---|---|---|---|
| Best Case | +40% | 72% | +15% | $187,200 |
| Base Case | +25% | 68% | +20% | $81,600 |
| Worst Case | +10% | 63% | +25% | -$44,800 |
Here’s the math for the base case:
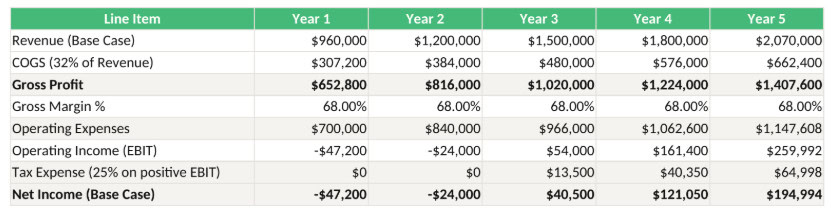
- Year 2 Revenue: $960,000 × 1.25 = $1,200,000
- Gross Profit: $1,200,000 × 0.68 = $816,000
- Year 1 OpEx: assume $700,000; Year 2 OpEx: $700,000 × 1.20 = $840,000
- Wait: $816,000 – $840,000 = -$24,000 operating loss before interest and tax
- Add back: assume $0 interest expense and a $105,600 tax benefit at 25% rate on the loss
- Net Income: -$24,000 + $105,600 tax benefit = $81,600
The worst case shows a net loss of $44,800 in Year 2. That is not a failure of the model. That is the model doing its job: telling you how much additional runway you need if growth disappoints.
For a pre-built scenario modeling structure, the EFM SaaS Financial Model includes three-scenario toggle functionality with automated income statement outputs.
Three-scenario income statement model: base case net income turns positive in Year 3, while the worst case requires an additional capital buffer through Year 2.
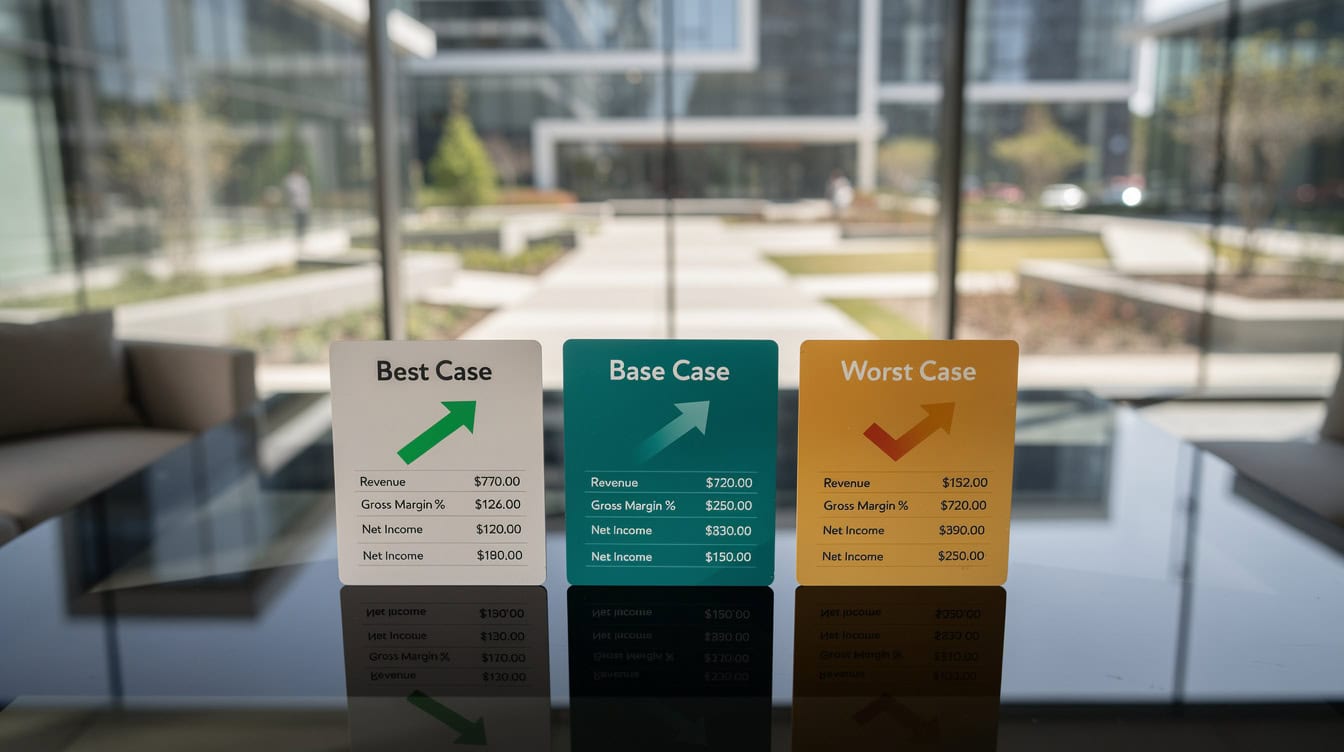
Three scenarios transform a single-point guess into a risk-aware plan that investors can interrogate and stress-test.
Incorporating Break-Even Analysis Into Your 5-Year Projection
Break-even analysis identifies the exact point when total revenue equals total costs, producing zero net income. Financial projection templates commonly provide 3 or 5-year projections along with break-even analysis to identify when income will cover costs (Financial Projections: A Comprehensive Guide For Businesses).
The break-even formula is:Break-Even Revenue = Fixed Costs / Gross Margin %
Using the base-case example above:
- Fixed costs (Year 2 OpEx): $840,000
- Gross margin: 68%
- Break-even revenue: $840,000 / 0.68 = $1,235,294
The base-case Year 2 revenue of $1,200,000 falls just short of break-even at $1,235,294. That gap of $35,294 tells you exactly how much additional revenue you need to reach profitability in Year 2. In the best-case scenario, Year 2 revenue of $1,344,000 clears break-even comfortably.
Embed this calculation as a dynamic row in your income statement model so it updates automatically when assumptions change. A single Excel worksheet can contain up to 1,048,576 rows (Excel specifications and limits), meaning you will never run out of space to add dynamic break-even rows, sensitivity tables, and scenario outputs within a single workbook.
Break-even revenue of $1,235,294 in this example sits just above the base-case Year 2 projection, flagging the need for a $35,294 revenue gap to close.
Sensitivity Analysis and Stress-Testing Your Projections
Sensitivity analysis tests how much net income changes when you move a single input variable up or down, holding everything else constant. It is the quantitative answer to “what if?”
The two highest-leverage variables in most income statement models are revenue growth rate and gross margin. A practical approach is to build a two-variable sensitivity table:
| Gross Margin \ Revenue Growth | +10% | +25% (Base) | +40% |
|---|---|---|---|
| 63% | -$44,800 | -$12,600 | +$38,400 |
| 68% (Base) | +$14,400 | +$81,600 | +$148,800 |
| 72% | +$57,600 | +$129,600 | +$201,600 |
This table shows Year 2 net income across nine combinations of revenue growth and gross margin. The bottom-right cell is your best case; the top-left is your worst. The diagonal from top-right to bottom-left is your risk corridor.
For each key variable, test a plus or minus 10% movement as a starting point. If a 10% revenue miss turns a profitable year into a loss, your model is fragile and you need either a lower cost structure or more capital buffer. Excel’s What-If Analysis tools, including Data Tables, Scenario Manager, and Goal Seek, are built directly into the Data tab (Introduction to What-If Analysis) and can automate the entire sensitivity table without any custom code, making it straightforward to populate all 9 cells of your two-variable table in seconds.
The EFM Budget vs. Actual 3-Year model includes variance tracking that makes it straightforward to compare sensitivity scenarios against actuals as the years unfold.

A two-variable sensitivity table reveals the risk corridor: the diagonal from low growth and low margin to high growth and high margin defines your planning range.
Common Pitfalls in 5-Year Income Statement Projections
Even experienced analysts make predictable mistakes in multi-year projections. Here are the five most common, with specific fixes.
1. Hockey-stick revenue without a mechanism
Projecting 10% growth in Year 1 and 80% in Year 3 requires a specific explanation: a new product launch, a distribution partnership, or a sales team doubling. Without a mechanism, investors will discount the entire model. Fix: tie every growth rate change to a named event in your assumptions tab.
2. Flat expense ratios across all five years
Expenses do not scale linearly with revenue. Rent is fixed until you move. Hiring happens in steps. Fix: model expenses by category with explicit step-change logic rather than applying a single percentage to revenue.
3. Ignoring working capital in the income statement context
Revenue recognized on the income statement does not equal cash received. If you offer 60-day payment terms, your cash flow will lag your P&L by two months. Fix: build the cash flow statement alongside the income statement from day one.
4. Using a single tax rate without checking applicability
Startups often have net operating losses (NOLs) in early years, which create deferred tax assets, not tax expenses. Fix: model taxes only when EBT turns positive, and consult a tax advisor on NOL carryforward rules in your jurisdiction.
5. Never updating the model after Year 1 actuals arrive
A projection built in January becomes stale by April. Fix: schedule a quarterly model refresh. Compare actuals to projections, identify the variance drivers, and roll forward your assumptions.
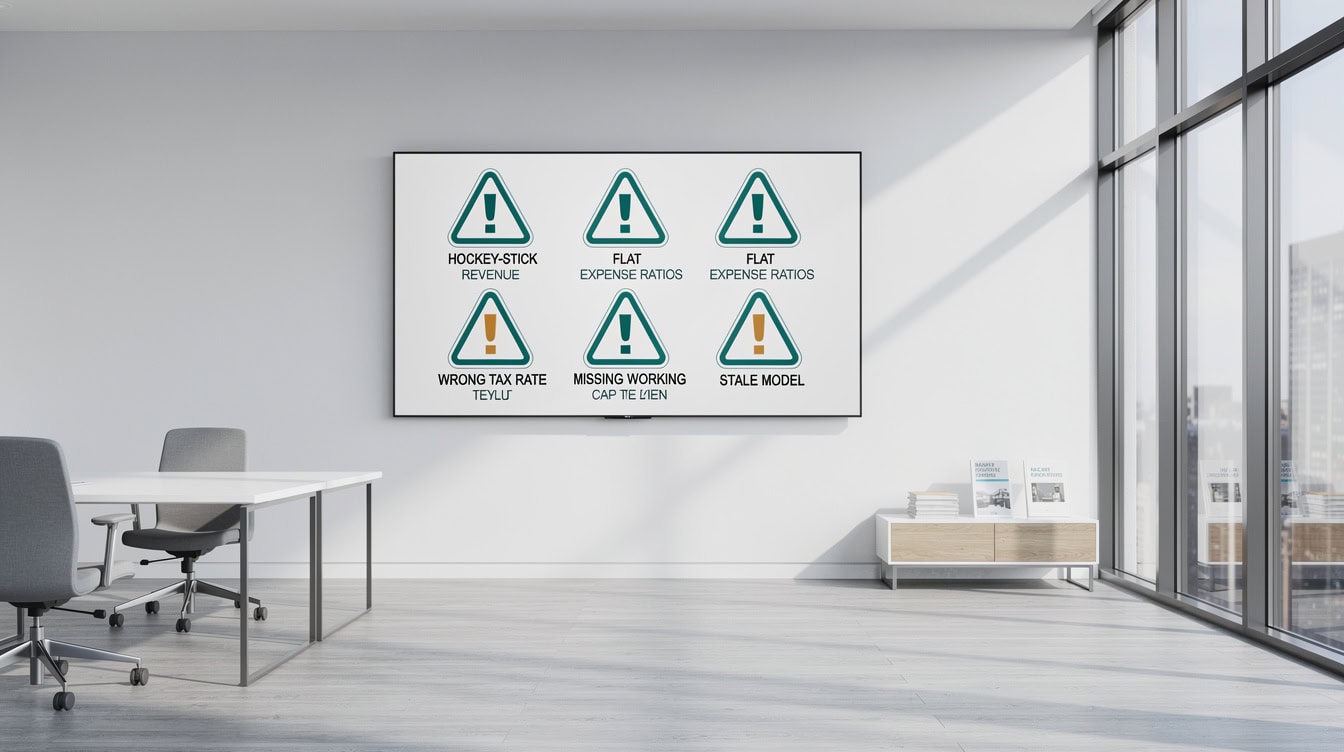
The five most common projection mistakes are all fixable before you present to investors, if you know what to look for.
Frequently Asked Questions
What is the difference between a projected income statement and a budget?
A projected income statement (also called a pro forma P&L) is a multi-year forward-looking document used for strategic planning and investor presentations. A budget is typically a 12-month operational plan used for internal cost control and performance management. The projected income statement sets the 5-year destination; the annual budget maps the route for the current year. In practice, Year 1 of your 5-year projection should align closely with your annual budget. If they diverge by more than 5 to 10%, you have an internal consistency problem that investors will notice immediately.
How do you calculate COGS for a service business?
For a service business, COGS (cost of goods sold) represents the direct cost of delivering the service, primarily the labor of the people doing the work. The formula is: Direct Labor Hours Delivered × Fully Loaded Hourly Cost. For example, a consulting firm with 5 consultants each billing 1,500 hours per year at a fully loaded cost of $80 per hour has COGS of 5 × 1,500 × $80 = $600,000. Subtract this from revenue to get gross profit. Service businesses typically target gross margins of 50 to 70%, so if your COGS calculation produces a margin below 40%, revisit your pricing or staffing model before projecting five years forward.
How often should you update a 5-year projected income statement?
Update your 5-year projected income statement at minimum once per quarter. The trigger for an immediate out-of-cycle update is any event that materially changes a core assumption: a major customer win or loss, a significant pricing change, a new hire above the VP level, or a macroeconomic shift like a central bank rate change that affects your cost of debt. According to McCracken Alliance (2023), CFOs building growth-focused forecasting models treat the 5-year projection as a living document, not a static deliverable. A model that has not been touched in 12 months is not a financial model; it is a historical artifact.
What revenue growth rate is realistic for a 5-year projection?
Realistic growth rates depend entirely on your industry, stage, and market. Early-stage SaaS companies often project 50 to 100% growth in Years 1 to 2, decelerating to 20 to 30% by Year 5 as the business matures. Brick-and-mortar retail might project 5 to 15% annually. The most defensible approach is to anchor your growth rate to three data points: your own historical growth (if available), the published growth rate of your industry segment, and the implied growth rate from your bottom-up customer acquisition model. If all three converge within 5 percentage points of each other, your assumption is defensible. If they diverge widely, investigate why before presenting to investors.
What is a pro forma income statement and how does it differ from a projected one?
The terms are often used interchangeably, but there is a technical distinction. A pro forma income statement (from the Latin “as a matter of form”) can refer to any hypothetical financial statement, including one that restates historical results to exclude one-time items. A projected income statement specifically refers to a forward-looking forecast of future periods. In the context of a 5-year financial model, both terms describe the same document: a year-by-year forecast of revenue, expenses, and net income. When presenting to investors, “5-year pro forma income statement” and “5-year projected income statement” are functionally identical and both are acceptable terminology.
How do you handle inflation in a 5-year income statement projection?
Inflation affects both revenue (through pricing power) and expenses (through cost increases). The cleanest approach is to model them separately rather than applying a single inflation rate to everything. For revenue, build in explicit price increase assumptions by year, for example, a 3% annual price increase starting in Year 2. For expenses, apply category-specific inflation rates: labor costs might inflate at 4 to 5% annually in a tight labor market, while software subscriptions might inflate at 2 to 3%. The U.S. Bureau of Labor Statistics publishes the Consumer Price Index and Producer Price Index annually, which provide defensible benchmarks for cost inflation assumptions by category. Never apply a single blanket inflation rate to the entire model; it obscures the real drivers.
Can a 5-year projected income statement help with bank loan applications?
Yes, and most commercial lenders require it. Banks use the projected income statement to calculate debt service coverage ratio (DSCR), which measures whether projected operating income is sufficient to cover loan payments. The formula is: DSCR = Operating Income / Total Debt Service. Most lenders require a DSCR of at least 1.25, meaning your projected operating income must be 25% higher than your annual loan payments. A well-constructed 5-year projection that shows DSCR consistently above 1.25 across all three scenarios (base, best, and worst case) significantly strengthens a loan application. The U.S. Chamber of Commerce (2022) confirms that most financial lenders want at least a three-year sales forecast, and five years is increasingly the standard for loans above $500,000.
Conclusion
A 5-year projected income statement is not a prediction. It is a structured argument about how your business creates value over time, built from explicit assumptions that can be tested, challenged, and updated. The founders and analysts who build the best projections are not the ones with the most optimistic numbers. They are the ones who can defend every line item with data and logic.
Start with a bottom-up revenue model, build your expense structure around a realistic headcount plan, run three scenarios, embed break-even analysis, and stress-test the two variables that matter most: revenue growth and gross margin. Then update the model every quarter as actuals arrive.
I recommend downloading the EFM 5-Year Financial Projections Template to start building your strategic income statement today. It includes pre-linked three-statement financials, scenario modeling toggles, and automated break-even analysis, so you can focus on your assumptions rather than your formulas.
























































