
0 ITEMS

Germany Solar PV: 116.8 GW Base and Capture Rates Collapsing
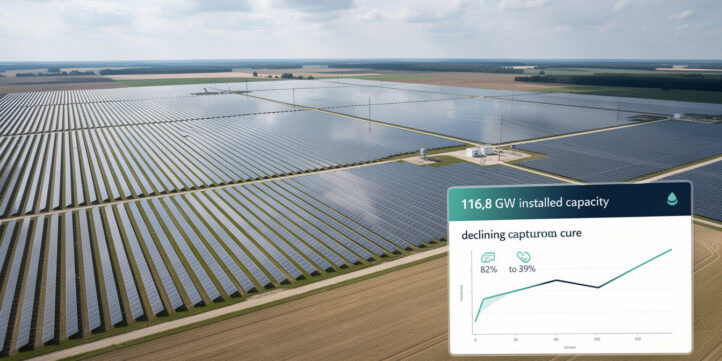
Germany’s solar sector passed 116.8 GW of installed capacity at the end of 2025, but the same growth that set records is now compressing the revenue every project can actually capture.
Key Takeaways
- Germany added a record 16.2 GW DC of solar PV in 2025 alone, pushing the installed base to 116.8 GW DC and overtaking lignite as a generation source for the first time.
- Solar capture rates (the generation-weighted realized price as a share of the baseload day-ahead price) fell from 82% in 2020 to 58% in 2025, and the Base Case projects a further decline to 39% by 2031.
- The Solarspitzengesetz (Solar Peak Act), in force since 14 February 2025, suspends EEG remuneration during negative-price intervals for all PV systems above 2 kW, creating an 8% gross revenue haircut on a representative 50 MW utility-scale plant in the Base Case.
- The new Reifegradverfahren (maturity-based grid-connection procedure), active from 1 April 2026, replaces first-come-first-served queue allocation with a 30/30/30/10 scoring system and a €50,000 application fee that filters speculative pipeline.
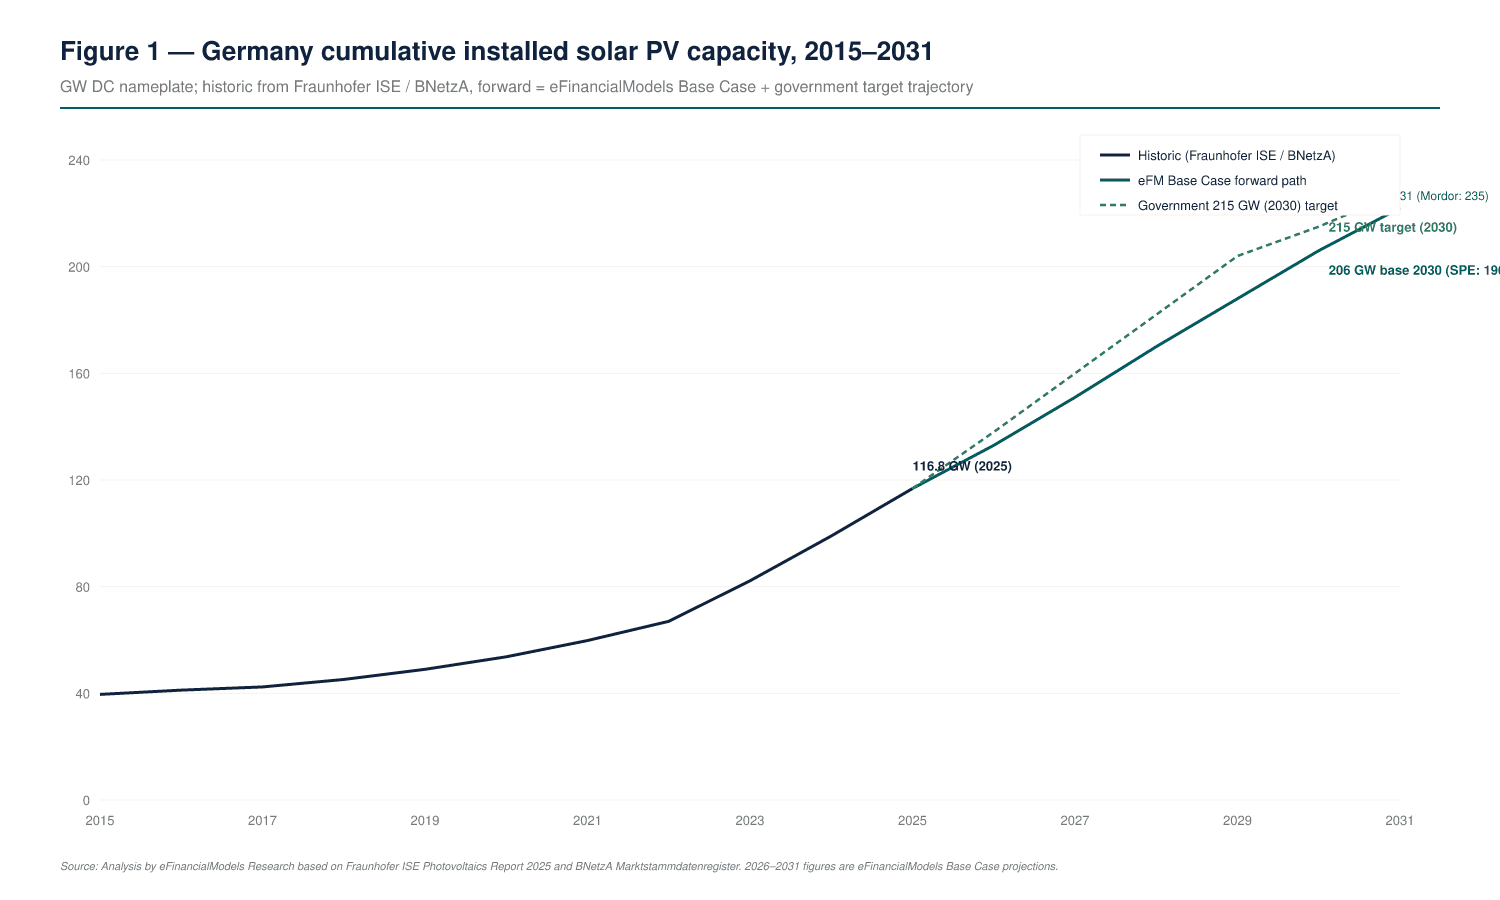
- The Base Case projects Germany reaching 222 GW DC by 2031, with cumulative net additions of 86.5 GW across 2026-2031; the 215 GW statutory 2030 target is achievable only in the Bull scenario (25% probability).
- Corporate solar PPA volumes collapsed 84% year-on-year in H1 2025, falling to 228 MW across eight deals, driven by capture-rate cannibalization and competition from wind PPAs.
- A defensible 2026 Base Case for a 50 MW German utility-scale ground-mount project uses capex of €657/kWp DC, an 11.0% AC capacity factor, and a year-1 capture rate of 53% declining 2.5 percentage points per year.
Germany Solar PV Today: A Market at an Inflection Point
Germany’s solar sector is the largest in Europe by installed base and the most structurally complex to model. Germany ended 2025 with 116.8 GW DC of installed solar PV capacity, having passed the 100 GW milestone in 2024 and added a record 16.2 GW DC in 2025 alone, according to the Bundesnetzagentur (BNetzA) Marktstammdatenregister. Solar peaked at 50.4 GW of instantaneous output on 20 June 2025, covering 98.6% of grid load in that single hour. Combined with wind, solar delivered more than 55% of public electricity generation across the full year.
Yet the boom now defines the central tension of the 2026-2031 horizon: capacity is growing faster than the grid, the offtake market, and the policy framework can absorb. SolarPower Europe forecasts Germany reaching 196 GW by 2030, which is 9% short of the 215 GW statutory target. Mordor Intelligence, using a higher-additions assumption, projects 235.5 GW by 2031. The eFinancialModels Germany Solar PV Market Study 2026-2031 Base Case sits between the two at 222 GW by 2031.
Fraunhofer ISE puts ground-mount LCOE (levelized cost of electricity, the all-in cost per unit of generation over a project’s life) at €4.1-6.9 cents/kWh and rooftop at €6.0-14.4 cents/kWh in its Q4 2024 update, both lower than every conventional generation alternative in Germany. The Base Case projects a further 15-25% LCOE reduction by 2031 driven by bifacial TOPCon module pricing and 5% balance-of-system learning. Germany’s installed solar capacity of 116.8 GW at end-2025 makes it the largest solar market in Europe, a position underpinned by the EEG framework that has supported renewable deployment since 2000 (Bundesnetzagentur).
Capacity Outlook 2026-2031: Three Scenarios, One Central Tension
The Base Case projects Germany adding 14-17 GW DC per year through 2027, climbing to 17-19 GW per year in 2028-2029, then easing toward 12-16 GW per year in 2030-2031 as cheaper sites are built out and remaining grid-connection capacity narrows. The 22 GW/year addition rate implied by the 215 GW statutory goal is met only in the Bull scenario.
The table below summarizes the Base Case new-capacity outlook by segment, drawn from eFinancialModels Research analysis based on Fraunhofer ISE Photovoltaics Report 2025, BNetzA tender schedules, and SolarPower Europe forecasts.
| Year | Utility-Scale (GW DC) | C&I Rooftop (GW DC) | Residential + Balcony (GW DC) | Total (GW DC) |
|---|---|---|---|---|
| 2026 | 7.5 | 3.8 | 2.7 | 14.0 |
| 2027 | 8.5 | 4.0 | 2.5 | 15.0 |
| 2028 | 9.4 | 4.0 | 2.3 | 15.7 |
| 2029 | 9.5 | 3.7 | 2.4 | 15.6 |
| 2030 | 8.4 | 3.5 | 2.1 | 14.0 |
| 2031 | 7.0 | 3.2 | 2.0 | 12.2 |
| Cumulative | 50.3 | 22.2 | 14.0 | 86.5 |
The three scenario probabilities assigned by eFinancialModels Research are: Bear Case 25%, Base Case 50%, Bull Case 25%. The Bear Case lands at 196 GW by 2031 (matching SolarPower Europe’s lower bound); the Bull Case reaches 235 GW, consistent with Mordor Intelligence’s higher-additions path.
Capture-Rate Cannibalization: The Core Modeling Risk
Capture-rate cannibalization is the single most consequential risk for German solar project economics in 2026-2031. The solar capture rate, defined as the solar-generation-weighted realized day-ahead price divided by the baseload day-ahead price, measures how much of the market price a solar plant actually captures given that it generates principally during mid-day hours when prices are lowest.
The solar day-ahead capture rate in Germany was 82% in 2020 and fell to 58% by 2025, according to Pexapark and Energy-Charts.info data. In monthly snapshots, the April 2026 capture rate dropped further to 26%, with 46.8% of solar generation occurring during negative-price intervals, up from 32.6% in April 2025.
The Base Case projects the annual capture rate falling from 58% in 2025 to 39% by 2031, a structural decline of approximately 3 percentage points per year. The Bear Case bottoms at 27% (high cannibalization, slow battery energy storage system uptake, slow flexible-demand growth). The Bull Case lands at 49% (rapid BESS coupling, electrolyzer demand absorbs midday surplus, ETS carbon price floor raises baseload).
For project modeling, flat capture-rate assumptions across a 25-year asset life are not defensible. The Solar PV Project Finance Model Template now includes capture-rate shaping as a row-by-row monthly input rather than a flat factor.
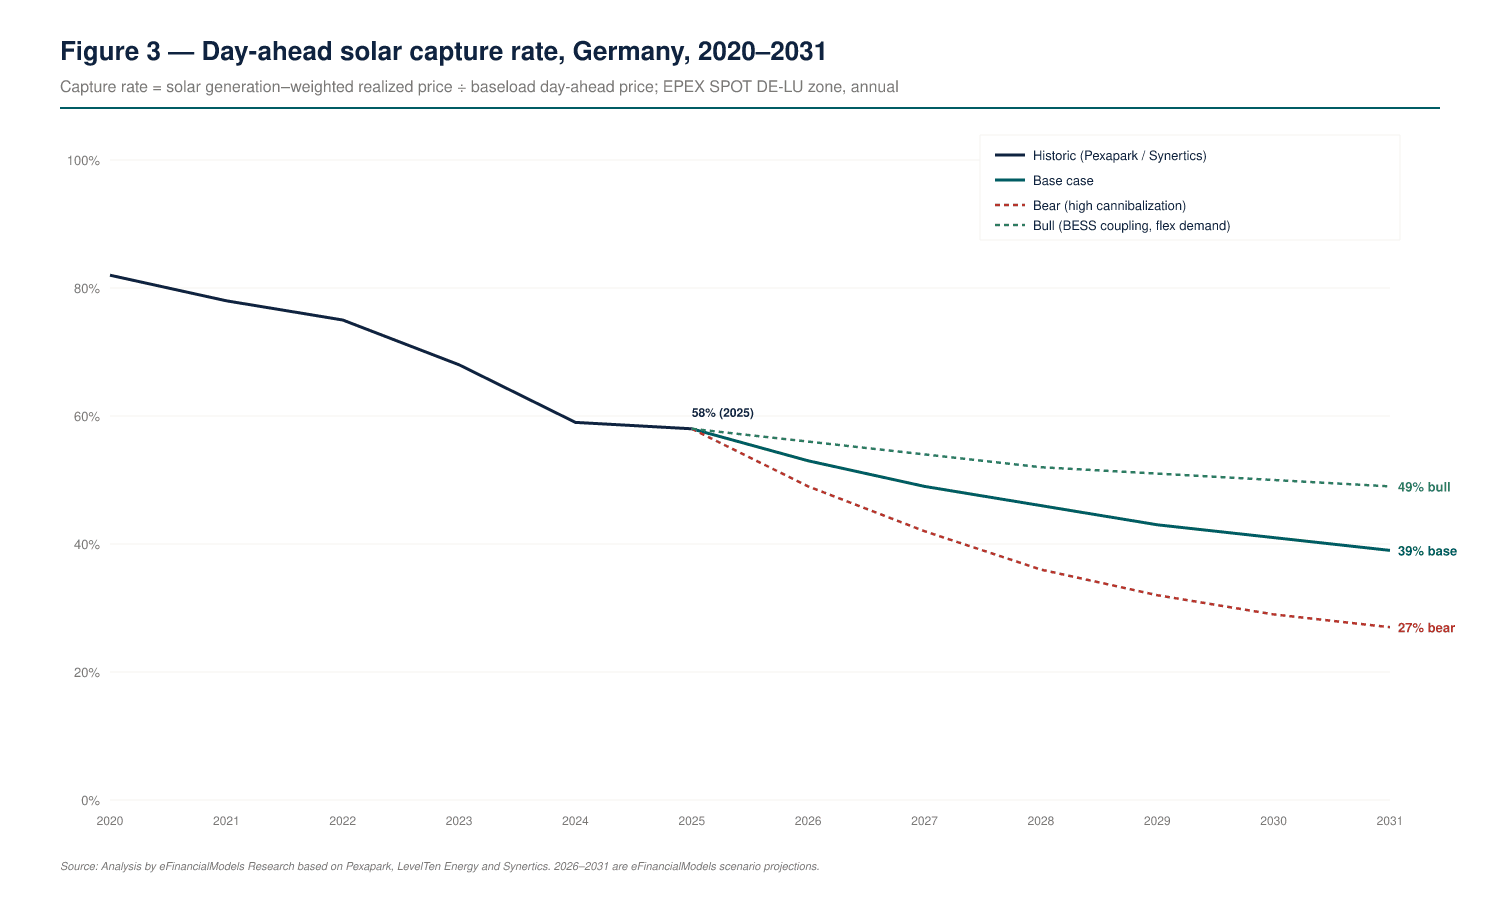
The April 2026 monthly capture rate hit 26%, with 46.8% of solar generation occurring during negative-price intervals.
Solarspitzengesetz: Quantifying the Revenue Haircut
The Solarspitzengesetz (Solar Peak Act) is a German law, in force since 14 February 2025, that suspends EEG (Erneuerbare-Energien-Gesetz, Germany’s renewable energy support law) remuneration during any 15-minute interval where day-ahead prices turn negative. It applies to all PV systems above 2 kW. For systems below 100 kWp that lack remote controllability, the law also caps active power output at 60% of nameplate AC capacity by default, effectively removing 6-8% of annual generation from un-upgraded residential systems.
Here’s the math for a representative 50 MW utility-scale ground-mount project:
- Annual generation: 50 MW AC x 11.0% capacity factor x 8,760 hours = approximately 55 GWh per year
- Mid-day price-trough window share: 32% of generation, or roughly 17.6 GWh, falls within hours where negative pricing concentrates
- Negative-price incidence (Base Case): 25% of those mid-day hours register negative prices, rising toward 35% in the Bear Case by 2031
- Revenue lost: 25% x 17.6 GWh = approximately 4.4 GWh per year at zero revenue
- Revenue haircut: 4.4 GWh / 55 GWh total = 8% of gross potential revenue at a €60/MWh capture price
- IRR impact: this lifts the required IRR risk premium by approximately 60 basis points and pushes break-even merchant PPA pricing up by €4-7/MWh
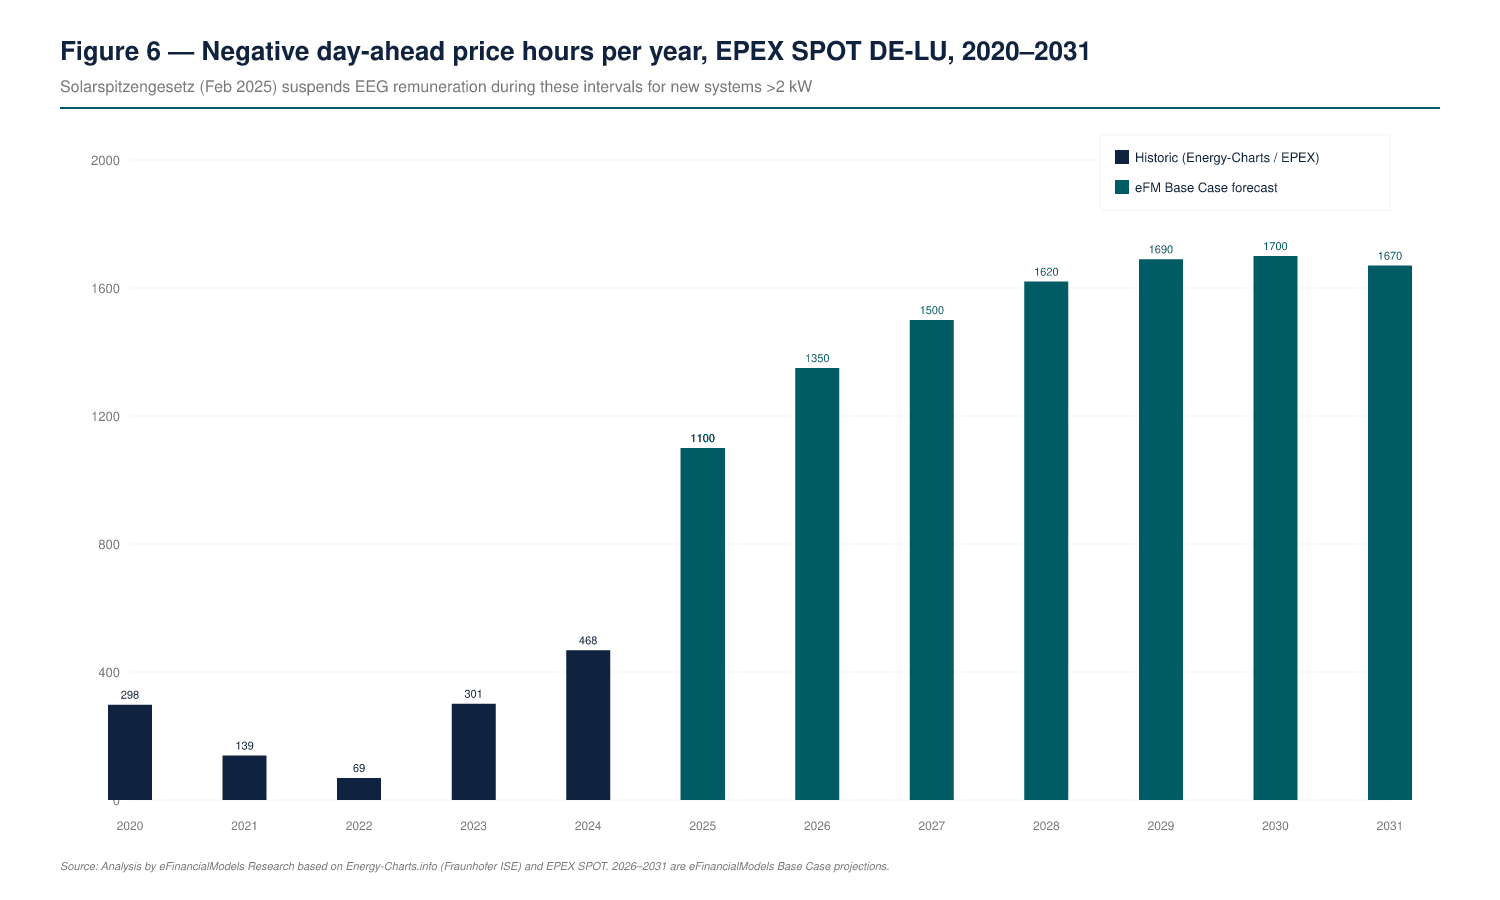
With more than 1,100 negative-price hours recorded in 2025, and the Base Case projecting this rising toward 1,700 hours by 2031, analysts must model the Solarspitzengesetz exclusion explicitly rather than amortizing it into a flat capture rate. Germany’s EEG has been amended more than 10 times since its introduction, with the 2023 revision setting a 215 GW solar target for 2030 (Bundesnetzagentur).
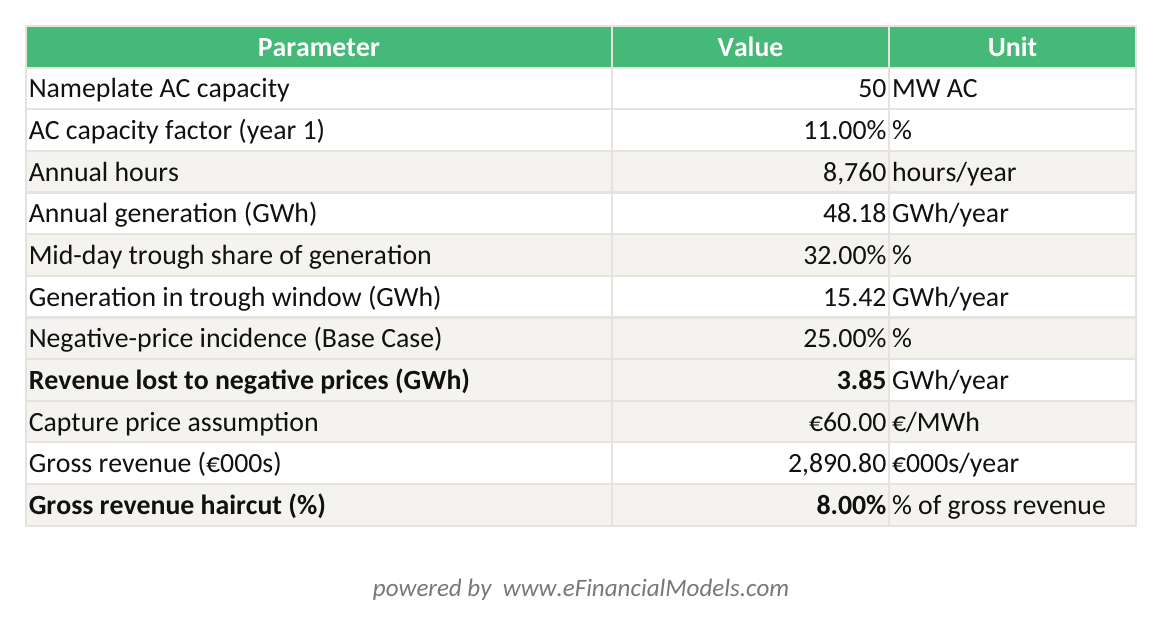
Base Case: 4.4 GWh lost per year = 8% gross revenue haircut at €60/MWh capture price, lifting required IRR risk premium by ~60 basis points.
The Solarspitzengesetz removes approximately 4.4 GWh of revenue per year from a 50 MW plant, an 8% gross revenue haircut in the Base Case.
Reifegradverfahren: Grid Access Is Now Competitive
From 1 April 2026, grid-connection allocation in Germany moved from first-come-first-served to a maturity-based scoring system called the Reifegradverfahren (maturity-based procedure). The four German TSOs (Transmission System Operators: 50Hertz, TenneT, Amprion, TransnetBW) jointly administer a 720 GW queue of BESS and co-located solar projects under a 30/30/30/10 scoring framework covering project maturity, site control, permitting status, and financial readiness. The €50,000 application fee filters out speculative pipeline and favors capitalized developers.
Projects that co-locate a battery energy storage system (BESS, a system that stores electricity and can discharge it when prices are higher) win disproportionately under this scoring. A 50 MW solar project bid without co-located BESS loses 6 percentage points of Reifegradverfahren score and gives up the 8-10% IRR uplift from arbitrage revenue. Developers must bring projects to FEED-complete (Front-End Engineering Design, the detailed engineering stage before final investment decision) before the first cycle deadline of 30 June 2026 to compete.
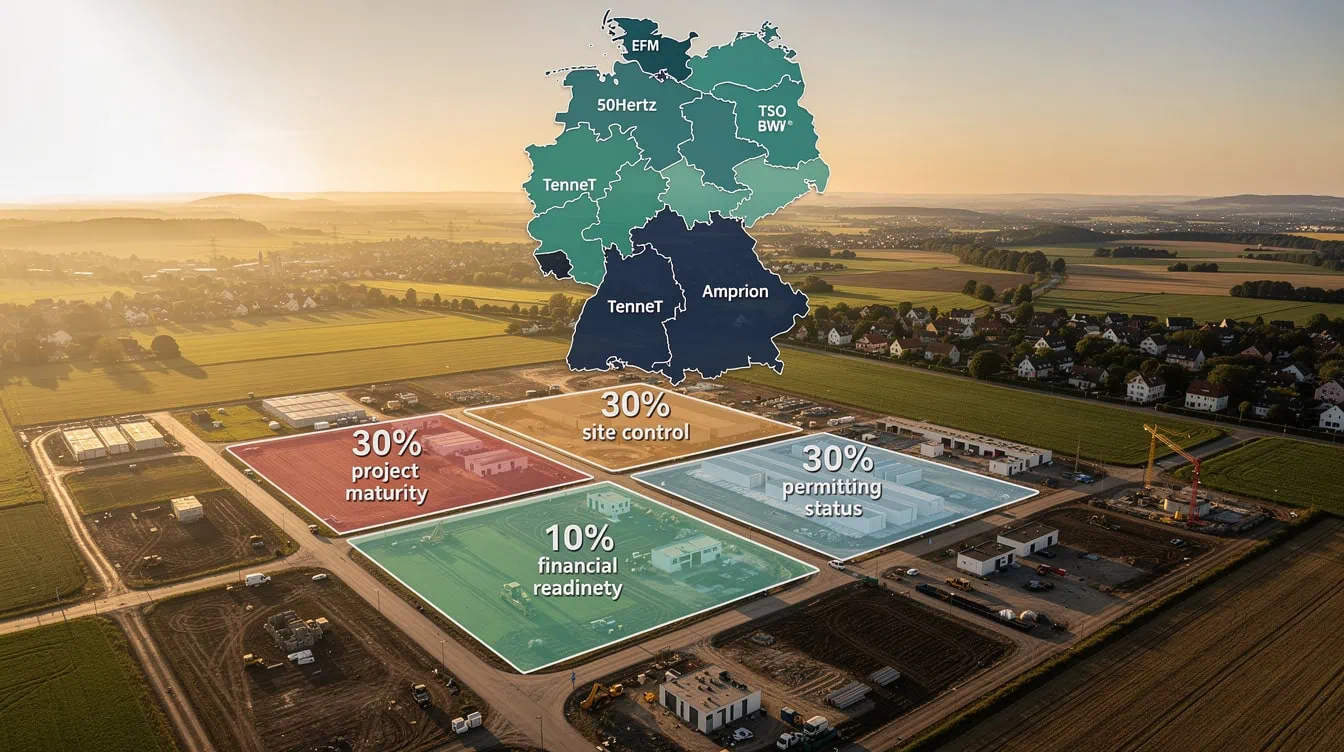
From 1 April 2026, Germany’s four TSOs allocate grid connections via a maturity-based 30/30/30/10 scoring system with a €50,000 application fee.
Pricing Dynamics: Tender Prices, Day-Ahead Markets, and LCOE
Germany’s solar pricing environment is defined by three overlapping mechanisms: BNetzA tender auctions, the EPEX SPOT DE-LU day-ahead market, and LCOE as the cost floor.
BNetzA ground-mount Solar 1 auction average awarded prices fell from €5.51/kWh in March 2023 to €4.94/kWh in May 2026, with the 2026 winning prices clustered between €3.99/kWh and €5.10/kWh, according to Bundesnetzagentur tender result press releases. The 2025 ceiling was €6.80/kWh; the 2026 rooftop ceiling has been cut to €10.00/kWh from €10.40/kWh. Germany held 12 separate BNetzA solar tender rounds in 2024 alone, with a combined volume of approximately 14 GW across ground-mount and rooftop segments, according to Bundesnetzagentur.
Annual average day-ahead prices in 2025 were approximately €78/MWh, down from €95/MWh in 2024 and well below the 2022 peak above €230/MWh. The Base Case projects 2026-2031 average day-ahead prices ranging from €68/MWh to €82/MWh, with declining volatility as the BESS fleet grows and the ETS (EU Emissions Trading System) carbon price provides a hard lower bound.
The comparison below shows the two primary revenue routes for a 2026-build German utility-scale project:
| Metric | Tender Route | Merchant + BESS Route |
|---|---|---|
| Revenue certainty | 20-year EEG contract | Merchant / PPA |
| Unlevered IRR | 4.5-5.0% | 8.0-9.0% |
| IRR variance | Low | High |
| Grid-connection score | Standard | +6 ppt with BESS |
| Capex (€/kWp DC) | 620-680 | 1,250-1,400 (combined) |
| Best for | Institutional / low-risk | PE-backed / return-seeking |
Tender-route projects deliver 4.5-5.0% IRR with lowest variance; merchant plus BESS targets 8.0-9.0% IRR with higher risk.
Competitive Landscape: Fragmented but Consolidating
No single operator controls more than 10% of Germany’s installed solar capacity, making this one of the least concentrated large-scale solar markets in Europe. RWE leads with approximately 2.0 GW DC of installed solar, followed by EnBW at approximately 1.1 GW DC, BayWa r.e. at approximately 0.95 GW DC, and Encavis (now KKR-owned) at approximately 0.78 GW DC, according to company public filings and BNetzA tender outcomes for 2023-2026.
The KKR acquisition of Encavis in 2024 at €17.50 per share (€2.7 billion total enterprise value) set a benchmark transaction multiple of approximately €1.2 million per installed MW for established German solar platforms. RWE committed to 7 GW of new domestic-renewable build by 2030 without subsidy support, a notable signal of confidence in merchant-route economics for very-large-capitalized operators.
European module manufacturing is in crisis. Meyer Burger filed for insolvency of both its German subsidiaries (Thalheim and Hohenstein-Ernstthal, totaling 620 employees) in May 2025, citing grave market distortion from Chinese competitors. Hanwha Qcells shifted production to China, Malaysia, South Korea, and the United States; its German operation now focuses on R&D and quality control. For 2026-2031, analysts should assume module supply is principally Chinese-manufactured, with EU resilience auctions adding a single-digit-percentage cost premium on a subset of project volumes.
No operator controls more than 10% of Germany’s installed solar capacity; RWE leads at approximately 2.0 GW DC.
Common Modeling Mistakes and How to Fix Them
Analysts building German solar project models in 2026 consistently make five errors that distort IRR outputs.
Mistake 1: Flat capture rate across the project life. A flat 58% capture rate applied to a 25-year model overstates revenue by 15-20% in years 10-25. Fix: use the Base Case curve (53% in year 1, declining 2.5 percentage points per year to year 7, then 1.5 percentage points per year thereafter).
Mistake 2: Ignoring Solarspitzengesetz. Analysts who net the negative-hour exclusion into a blended capture rate understate the cash-flow volatility. Fix: model the 8% gross revenue exclusion as a separate line item and stress it to 12% in the Bear Case.
Mistake 3: Baseload-equivalent PPA pricing. Pre-2024 PPA contracts priced solar as baseload. An offtaker locking in solar baseload-equivalent pricing now bears the full structural decline in solar capture rates over the contract term. Fix: price PPAs with explicit shape and cannibalization adjustments.
Mistake 4: Omitting the 60-basis-point illiquidity premium. The H1 2025 PPA market contraction (228 MW vs 1.2 GW in H1 2024) reflects genuine offtake illiquidity. Fix: apply a 60-basis-point illiquidity premium to the discount rate for merchant-route projects.
Mistake 5: Underestimating soft costs. Germany’s permitting regime and Reifegradverfahren grid-study requirements push soft costs (permitting, development, owner’s cost, contingency) to approximately 14% of total capex, higher than the global utility-scale average. Fix: use €90/kWp DC for soft costs in the Base Case, not the global benchmark of €50-60/kWp.

Soft costs in Germany reach approximately 14% of total capex, well above the global utility-scale average, due to Reifegradverfahren grid-study requirements.
Tools and Templates for German Solar Financial Modeling
Building a defensible German solar model requires tools that handle capture-rate shaping, Solarspitzengesetz exclusions, and Reifegradverfahren scenario analysis. The Solar PV Project Finance Model Template includes monthly capture-rate shaping rows, negative-hour revenue exclusion inputs, and the three-scenario (Bear/Base/Bull) sensitivity framework described in this article.
For developers evaluating co-located solar-plus-storage projects, the Detailed Solar Farm Project Finance Model covers BESS arbitrage revenue, capacity market access, and the combined capex stack of €1,250-1,400/kWp. For broader renewable energy portfolio analysis, the Renewable Energy Template Bundle provides a suite of models covering solar, wind, and storage across multiple geographies.
The Base Case inputs from Appendix A of the Germany Solar PV Market Study 2026-2031 are designed to be pasted directly into the Solar PV Project Finance Model Template for a representative 50 MW DC German utility-scale ground-mount project with a Q3 2027 commercial operation date.
Frequently Asked Questions
What is the Germany solar PV capacity forecast for 2031?
The Base Case projects Germany reaching 222 GW DC of installed solar PV capacity by 2031, adding a cumulative 86.5 GW DC across 2026-2031. This sits between SolarPower Europe’s 196 GW forecast (which is 9% below the 215 GW statutory 2030 target) and Mordor Intelligence’s 235.5 GW projection. The Base Case assigns a 50% probability to this outcome, with a 25% probability each for the Bear Case (196 GW) and Bull Case (235 GW). The 215 GW statutory 2030 target requires 22 GW of annual additions, which is achievable only in the Bull scenario. Analysts should probability-weight all three scenarios when deriving expected IRR for capital-allocation decisions.
What is the Solarspitzengesetz and how does it affect project revenue?
The Solarspitzengesetz (Solar Peak Act) is a German law in force since 14 February 2025 that suspends EEG remuneration during any 15-minute interval where day-ahead prices turn negative, applying to all PV systems above 2 kW. For a representative 50 MW utility-scale ground-mount project generating approximately 55 GWh per year, the Base Case estimates approximately 4.4 GWh per year falls within negative-price intervals, equivalent to an 8% gross revenue haircut at a €60/MWh capture price. This lifts the required IRR risk premium by approximately 60 basis points. Germany recorded more than 1,100 negative-price hours in 2025, and the Base Case projects this rising toward 1,700 hours by 2031. Analysts must model this exclusion as a separate line item, not blend it into the capture rate.
What is the Reifegradverfahren and why does it matter for project developers?
The Reifegradverfahren (maturity-based procedure) is a new grid-connection allocation system introduced by Germany’s four TSOs on 1 April 2026. It replaces the previous first-come-first-served queue with a 30/30/30/10 scoring framework that rewards project maturity, site control, permitting status, and financial readiness. The €50,000 application fee filters speculative pipeline. Projects that co-locate a BESS win disproportionately: a 50 MW solar project without co-located storage loses 6 percentage points of score and gives up the 8-10% IRR uplift from arbitrage revenue. Developers must reach FEED-complete status before the 30 June 2026 first-cycle deadline. Bavaria, Brandenburg, and Saxony-Anhalt account for approximately 60% of new utility-scale solar capacity in the 2026-2031 horizon, so building Land-level execution capability in these three states is the highest-priority operational investment.
What is the solar capture rate and why is it falling in Germany?
The solar capture rate (also called the capture factor) is the solar-generation-weighted realized day-ahead price divided by the baseload day-ahead price. It measures how much of the market price a solar plant actually captures, given that solar generates principally during mid-day hours when supply is highest and prices are lowest. Germany’s solar capture rate fell from 82% in 2020 to 58% in 2025, and the April 2026 monthly snapshot dropped to 26%, with 46.8% of solar generation occurring during negative-price intervals. The Base Case projects a further decline to 39% by 2031. The structural driver is that each additional gigawatt of solar capacity increases mid-day supply, pushing prices lower precisely when solar generates most. BESS coupling, electrolyzer demand, and flexible industrial loads are the three mechanisms that can slow this decline.
What capex should analysts use for a 2026 German utility-scale solar project?
The Base Case capex for a representative 50 MW DC German utility-scale ground-mount project is €657/kWp DC total installed cost, based on Fraunhofer ISE Photovoltaics Report 2025 data and disclosed tier-1 EPC pricing. The breakdown is: modules (bifacial TOPCon) at €210/kWp (32%), inverters and transformers at €72/kWp (11%), mounting and single-axis trackers at €92/kWp (14%), cabling and balance-of-system electrical at €59/kWp (9%), grid connection and substation at €79/kWp (12%), civils and foundations at €53/kWp (8%), land lease capitalized at €20/kWp (3%), permitting and development costs at €33/kWp (5%), and owner’s cost plus contingency at €39/kWp (6%). The Bear Case uses €720/kWp and the Bull Case uses €610/kWp. Germany’s capex is approximately 33% higher than Spain’s €480/kWp, driven by stricter permitting, higher labor costs, and Reifegradverfahren grid-study requirements.
What happened to the German corporate solar PPA market in 2025?
German corporate solar PPA volumes collapsed 84% year-on-year in H1 2025, falling to 228 MW across eight deals, compared to 1.2 GW across 31 deals in H1 2024, according to Pexapark’s Euro PPA Tracker. The two principal causes are capture-rate cannibalization (an offtaker locking in solar baseload-equivalent pricing now bears the full structural decline in solar capture rates over the contract term, raising the required risk premium) and the maturing wind PPA alternative, which provides corporate buyers with a less cannibalized renewable profile at competitive pricing. The Base Case projects PPA volumes recovering to approximately 600 MW in 2026 and progressing toward 1.0-1.3 GW per year by 2029, still below 2024 levels. Recovery requires capture-rate stabilization through BESS coupling, longer-tenor PPA structures with explicit shape mechanics, and corporate acceptance of solar-plus-storage hybrid PPAs.
How should analysts probability-weight the three scenarios for IRR reporting?
The eFinancialModels Research scenario framework assigns 25% probability to the Bear Case, 50% to the Base Case, and 25% to the Bull Case. The unlevered base IRR outcomes are: Bear Case 4.5%, Base Case 7.2%, Bull Case 9.5%. The probability-weighted expected IRR is therefore (0.25 x 4.5%) + (0.50 x 7.2%) + (0.25 x 9.5%) = 1.125% + 3.6% + 2.375% = 7.1%. This expected IRR of 7.1% is the appropriate figure for capital-allocation conversations, not the Base Case 7.2% in isolation. Analysts should also apply a 60-basis-point illiquidity premium reflecting the H1 2025 PPA market contraction, which reduces the risk-adjusted expected IRR to approximately 6.4% for merchant-route projects without long-term offtake.
Conclusion
Germany’s solar market offers the largest installed base in Europe and the most institutionally attractive risk-adjusted return profile, but only for analysts and developers who model it correctly. The three structural shifts that define 2026-2031 are capture-rate cannibalization declining from 58% to 39%, the Solarspitzengesetz 8% revenue haircut, and the Reifegradverfahren’s competitive grid-connection queue. Each of these reshapes project IRR in ways that 2022-2023 model assumptions cannot capture.
I recommend downloading the Germany Solar PV Market Study 2026-2031 and pairing it with the Solar PV Project Finance Model Template to run the full Bear/Base/Bull scenario analysis with the Appendix A inputs pre-loaded. That combination gives you a defensible, audit-ready model for any German utility-scale solar investment decision in 2026.
























































