
0 ITEMS

Utility-Scale Solar CAPEX vs OPEX Breakdown USA 2026

Key Takeaways
- Utility-scale solar accounts for approximately 85.71% of total installed U.S. solar capacity, making it the dominant cost category in the national solar market.
- Average installed CAPEX for a U.S. utility-scale solar project runs $0.85–$1.10 per watt-DC, or roughly $850,000–$1.1 million per MW of capacity.
- Lazard’s June 2025 LCOE+ analysis puts the representative capital cost at $359 per kW, a figure developers use as a benchmark when modeling project returns.
- Hardware (modules, inverters, and racking) represents 40–50% of total CAPEX; the remaining 50–60% covers soft costs, grid interconnection, and EPC labor.
- Annual OPEX is small relative to CAPEX but compounds over a 25–35-year project life, so even a $2/MWh difference in O&M assumptions can shift IRR by 50–80 basis points.
- The 30% Investment Tax Credit (ITC) under the Inflation Reduction Act directly reduces net CAPEX, improving project economics for projects that begin construction before the credit steps down.
- Developers who model CAPEX and OPEX separately — rather than rolling them into a single LCOE number — make better financing and offtake decisions.
Utility-scale solar (projects typically 1 MW and above, connected directly to the transmission or distribution grid) has become the cheapest source of new electricity generation in most U.S. markets. Understanding exactly where the money goes — both upfront and over the operating life — is the foundation of any credible project finance model.
What Is CAPEX in a Utility-Scale Solar Project?
CAPEX (capital expenditure) covers every dollar spent to bring a solar project from a greenfield site to commercial operation. It is a one-time outlay, though it is typically drawn down over an 18–36-month construction period and financed through a combination of tax equity, debt, and sponsor equity.
Here is how CAPEX breaks down across the major cost buckets:
Hardware Costs (Modules, Inverters, Racking)
Modules, inverters, and mounting systems together account for roughly 40–50% of total project CAPEX (<a href=”https://pvcase.com/blog/utility-scale-solar-guide” rel=”nofollow”>PVcase, 2023</a>). In 2025–2026, bifacial monocrystalline PERC and TOPCon modules dominate new U.S. procurement. Module prices have fallen to roughly $0.25–$0.30/W at the factory gate, but domestic content adders under the IRA can push costs higher for projects seeking the full ITC bonus. The U.S. Energy Information Administration reports that utility-scale solar accounted for 60% of all new U.S. electricity generating capacity added in 2023 (<a href=”https://www.eia.gov/energyexplained/solar/solar-energy-and-the-environment.php” rel=”nofollow”>EIA</a>), underscoring how dominant this segment has become in the national energy mix.
- Solar modules: $0.25–$0.32/W
- String or central inverters: $0.05–$0.09/W
- Racking and tracker systems: $0.08–$0.14/W (single-axis trackers add ~$0.04–$0.06/W vs fixed-tilt)
Balance of System (BOS) and EPC Costs
BOS covers everything that connects the hardware: wiring, combiner boxes, transformers, SCADA (supervisory control and data acquisition — the software that monitors plant performance in real time), and civil works. EPC (engineering, procurement, and construction) labor wraps around all of it.
- BOS electrical: $0.08–$0.12/W
- Civil and structural: $0.05–$0.10/W
- EPC margin: $0.04–$0.07/W
Soft Costs and Interconnection
Soft costs are the non-hardware, non-construction expenses: permitting, environmental studies, legal fees, financing costs, and developer overhead. Grid interconnection — the process of getting a project approved and physically connected to the transmission system — has become one of the most variable and unpredictable cost items in the U.S. market.
- Permitting and development: $0.03–$0.06/W
- Interconnection (highly site-specific): $0.05–$0.25/W
- Financing and legal: $0.02–$0.05/W
Total CAPEX Range
Adding all buckets together, average installed CAPEX for U.S. utility-scale solar projects in 2024 is approximately $0.85–$1.10 per watt-DC, equivalent to about $850,000–$1.1 million per MW of capacity (<a href=”https://marksparksolutions.com/reports/us-solar-farm-market” rel=”nofollow”>MarkSpark Solutions, 2024</a>). Lazard’s June 2025 LCOE+ analysis puts the representative capital cost at $359 per kW (<a href=”https://www.lazard.com/media/eijnqja3/lazards-lcoeplus-june-2025.pdf” rel=”nofollow”>Lazard LCOE+, June 2025</a>), which reflects a utility-scale benchmark after accounting for project-specific variables. According to the U.S. Department of Energy, solar photovoltaic systems use the Modified Accelerated Cost Recovery System (MACRS) with a 5-year recovery period (<a href=”https://www.energy.gov/eere/solar/articles/solar-investment-tax-credit-what-changed” rel=”nofollow”>U.S. Department of Energy</a>), allowing developers to depreciate the full CAPEX basis rapidly and significantly improve after-tax project returns.
Note: Lazard’s $359/kW figure and the MarkSpark $850–$1,100/kW range differ because Lazard uses a representative modeled cost while MarkSpark reflects observed transaction data including higher interconnection and soft costs in constrained markets. Both are valid inputs depending on your modeling context.

Hardware (modules, inverters, racking) accounts for 40–50% of total CAPEX; soft costs and interconnection make up the remaining 50–60%.
What Is OPEX in a Utility-Scale Solar Project?
OPEX (operating expenditure) covers the recurring annual costs to keep a solar plant running over its 25–35-year life. Unlike CAPEX, OPEX does not depreciate — it hits the income statement every year and must be funded from project revenues or reserves.
Typical utility-scale PV plant OPEX is dominated by operations and maintenance, with fixed O&M (including vegetation management, equipment maintenance, and site security) representing the largest share of annual operating costs over the project life (<a href=”https://pvcase.com/blog/utility-scale-solar-guide” rel=”nofollow”>PVcase, 2023</a>).
Here are the main OPEX line items:
- Fixed O&M (labor, preventive maintenance, monitoring): $5–$10/kW-year
- Variable O&M (corrective repairs, inverter replacements): $0.50–$1.50/MWh generated
- Land lease: $500–$2,000/acre/year (highly regional)
- Insurance (property and liability): $2–$4/kW-year
- Asset management and administrative fees: $1–$3/kW-year
- Vegetation management: $1–$2/kW-year
- Transmission and interconnection fees: project-specific
For a 100 MW project generating roughly 200,000 MWh/year, total annual OPEX typically lands in the range of $1.5–$3.5 million, or $15–$35/kW-year.
Capital expenditure is incurred upfront while operating expenditure — including O&M, land lease, insurance, and other recurring costs — accounts for a smaller share of lifecycle costs but must be budgeted annually over a 25- to 35-year project life (<a href=”https://www.lazard.com/media/eijnqja3/lazards-lcoeplus-june-2025.pdf” rel=”nofollow”>Lazard LCOE+, June 2025</a>). The National Renewable Energy Laboratory (NREL) estimates that utility-scale solar PV O&M costs have declined to approximately $17 per kW-year as of 2023 (NREL Annual Technology Baseline 2023), reflecting improvements in remote monitoring and predictive maintenance that reduce the need for on-site labor.
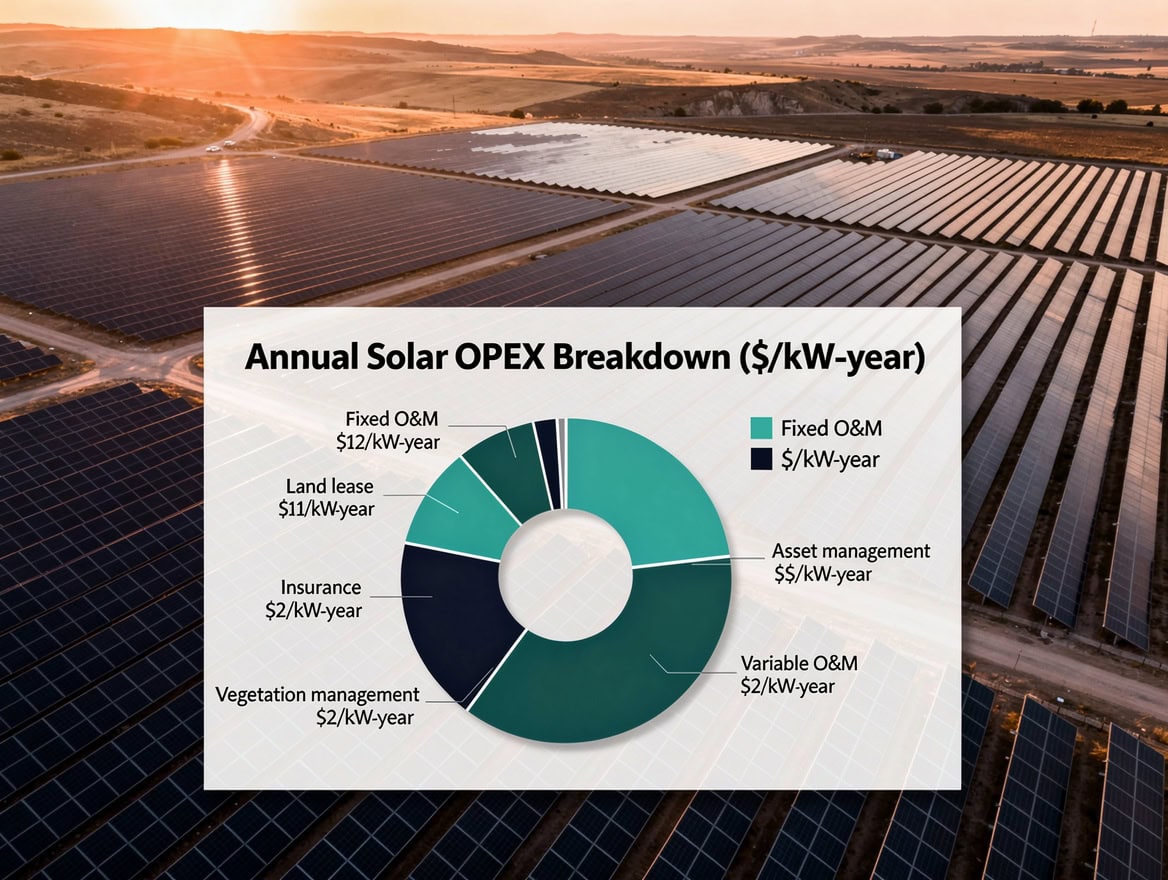
Annual OPEX for a 100 MW project typically ranges $1.5M–$3.5M, with fixed O&M the largest single line item.
CAPEX vs OPEX: Side-by-Side Comparison
The table below compares the two cost categories across the dimensions that matter most for project finance modeling.
| Dimension | CAPEX | OPEX |
|---|---|---|
| Timing | One-time, during construction (18–36 months) | Annual, over 25–35-year operating life |
| Typical magnitude (100 MW project) | $85M–$110M total | $1.5M–$3.5M per year |
| Per-unit benchmark | $0.85–$1.10/W-DC | $15–$35/kW-year |
| Financing treatment | Capitalized; depreciated (MACRS 5-year for solar) | Expensed in the year incurred |
| ITC impact | 30% ITC directly reduces net CAPEX basis | No direct ITC benefit |
| Key risk drivers | Module prices, interconnection costs, labor | Inflation escalation, equipment failure rates |
| Modeling approach | Lump-sum with construction draw schedule | Annual escalation (typically 1–2%/year) |
| Sensitivity to location | Moderate (labor, permitting) | High (land lease, vegetation, climate) |

CAPEX is a one-time outlay eligible for the 30% ITC; OPEX is an annual expense that compounds over a 25–35-year project life.
Worked Example: 50 MW Solar Project in Texas
Here is the math for a 50 MW-DC utility-scale project in West Texas, using mid-range assumptions.
CAPEX Build-Up:
- Modules (50,000 kW × $0.28/W): $14,000,000
- Inverters (50,000 kW × $0.07/W): $3,500,000
- Single-axis trackers (50,000 kW × $0.11/W): $5,500,000
- BOS electrical (50,000 kW × $0.10/W): $5,000,000
- Civil and structural (50,000 kW × $0.07/W): $3,500,000
- EPC margin (50,000 kW × $0.05/W): $2,500,000
- Soft costs and permitting (50,000 kW × $0.04/W): $2,000,000
- Interconnection (50,000 kW × $0.08/W): $4,000,000
- Total CAPEX: $40,000,000 ($0.80/W-DC)
ITC Benefit (30%): $40,000,000 × 30% = $12,000,000 tax credit
Net CAPEX after ITC: $28,000,000
Annual OPEX (Year 1):
- Fixed O&M ($7/kW-year × 50,000 kW): $350,000
- Insurance ($3/kW-year × 50,000 kW): $150,000
- Land lease (500 acres × $800/acre): $400,000
- Asset management ($2/kW-year × 50,000 kW): $100,000
- Vegetation management ($1.50/kW-year × 50,000 kW): $75,000
- Total Year 1 OPEX: $1,075,000 ($21.50/kW-year)
25-Year Cumulative OPEX (assuming 2% annual escalation): approximately $33.2 million
This means total lifecycle costs (CAPEX + 25-year OPEX) are roughly $73.2 million gross, or $61.2 million net of the ITC. On a per-MWh basis, assuming a 25% capacity factor and 0.5%/year degradation, the project generates approximately 2.7 million MWh over 25 years, implying a lifecycle cost of roughly $22.70/MWh — competitive with any other generation source in the ERCOT market.
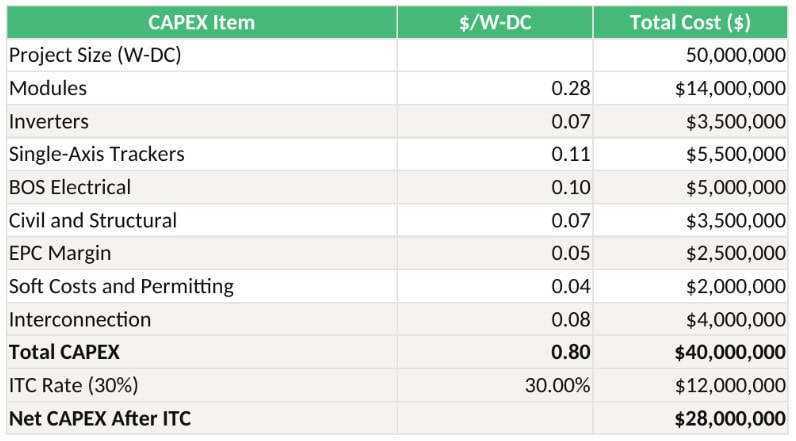
Net CAPEX after 30% ITC = $28M. Year 1 OPEX = $1.075M. 25-year cumulative OPEX at 2% escalation ≈ $33.2M. Lifecycle cost ≈ $22.70/MWh.

A 50 MW Texas project modeled at $0.80/W-DC CAPEX and $21.50/kW-year OPEX yields a lifecycle cost of approximately $22.70/MWh over 25 years.
Key CAPEX Cost Drivers to Watch in 2026
Several forces are reshaping the CAPEX stack heading into 2026.
Tariffs on imported modules remain the single largest wildcard. Section 201 and Section 301 tariffs, plus anti-circumvention duties on Southeast Asian manufacturers, have added $0.05–$0.15/W to module costs for projects without domestic supply agreements. Developers who locked in supply contracts in 2024 are insulated; those procuring in 2026 face more uncertainty.
Interconnection queue backlogs continue to inflate soft costs. The Federal Energy Regulatory Commission’s Order 2023 (a rule requiring transmission providers to reform their interconnection processes) is gradually clearing backlogs, but projects in PJM and MISO still face 3–5 year queue timelines that add carrying costs.
Domestic content bonuses under the IRA offer an additional 10% ITC adder for projects meeting domestic content thresholds, but sourcing compliant modules and structural steel adds $0.03–$0.08/W to hardware costs. The net math usually favors pursuing the bonus for projects above 50 MW.
For a deeper look at how capital expenditure decisions affect long-term returns, the framework in growth versus maintenance capex for smart investors applies directly to solar asset management decisions.
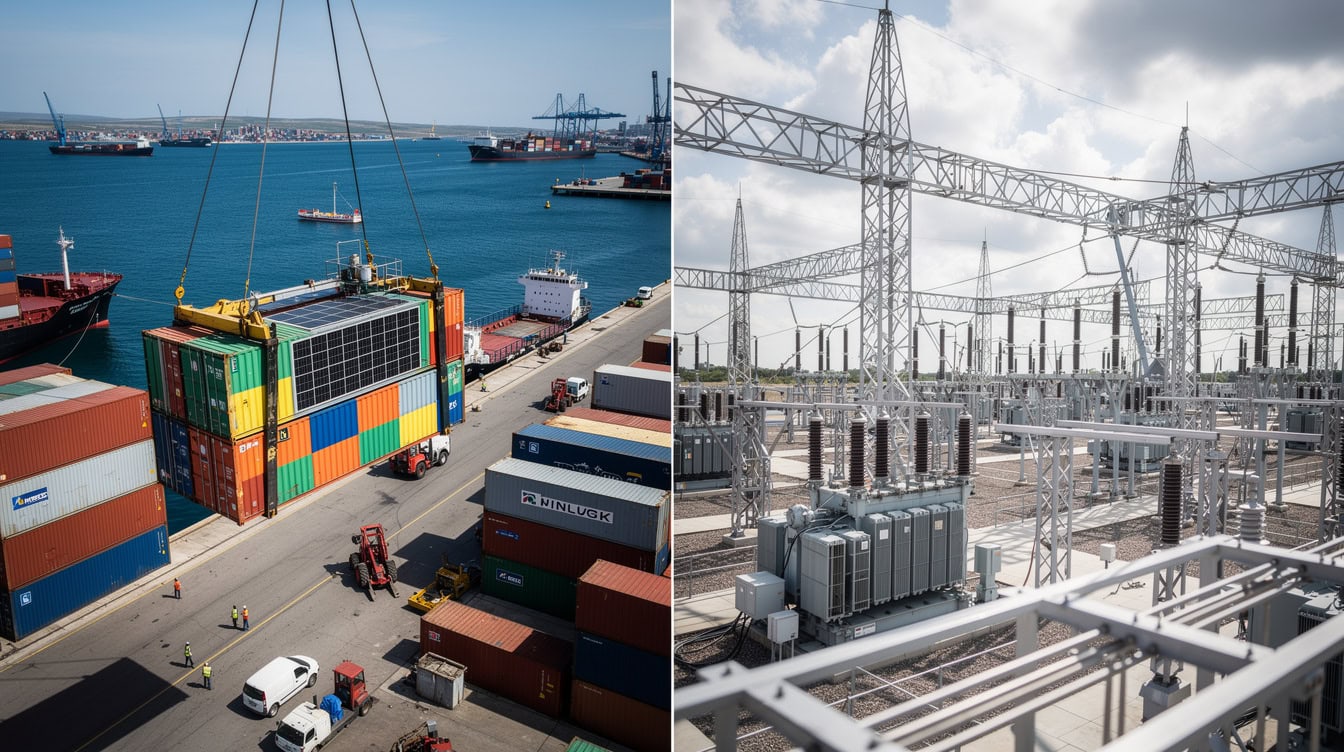
Tariffs and interconnection backlogs are the two biggest CAPEX wildcards for U.S. utility-scale solar projects in 2026.
OPEX Management Strategies That Protect Returns
Ongoing operating and maintenance expenses are relatively low compared with initial CAPEX, with many projects designed for 25+ years of operation where most cost is concentrated in the upfront capital outlay (<a href=”https://www.terli.net/blog/capex-vs-opex-solar.html” rel=”nofollow”>Terli, 2024</a>). But small OPEX inefficiencies compound over decades.
Performance-based O&M contracts tie contractor fees to plant availability (typically 97–98% target) rather than a flat fee. This shifts risk to the operator and aligns incentives.
Inverter replacement reserves should be modeled explicitly. Central inverters typically need replacement at year 10–15 (cost: $0.03–$0.05/W). String inverters last longer but cost more to replace on a per-unit basis.
Vegetation management is underestimated by first-time developers. In humid southeastern states, mowing and herbicide costs can run $3–$5/kW-year — double the national average.
Insurance escalation averages 3–5% per year in the current market, driven by increased wildfire and hail exposure. Projects in Texas, Colorado, and the Southeast should stress-test insurance costs at 5% annual escalation.
For developers evaluating a new project’s full financial picture, the solar park investment evaluation framework covers how OPEX assumptions feed into IRR and DSCR calculations.
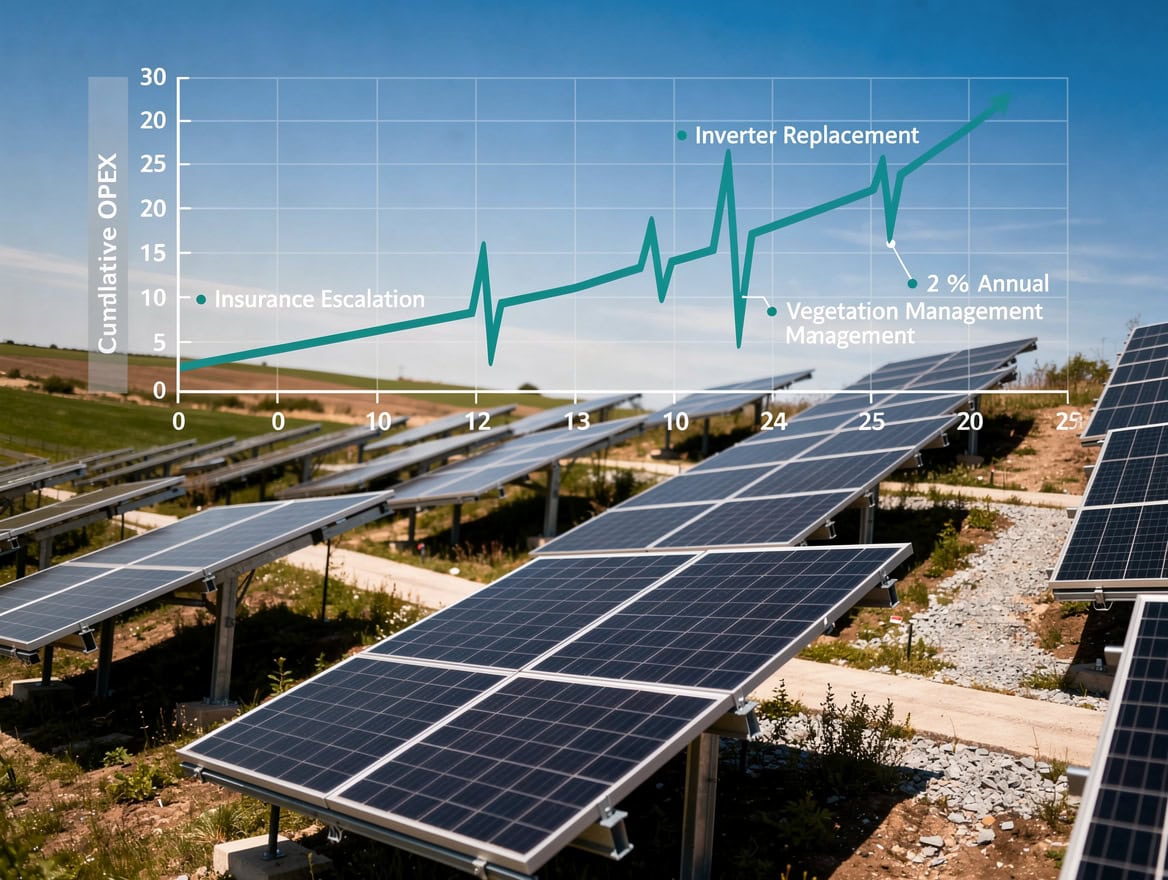
With 2% annual escalation and a mid-life inverter replacement, 25-year cumulative OPEX can approach or exceed the original net CAPEX after ITC.
Common Mistakes in Solar CAPEX and OPEX Modeling
These are the five errors that most often cause project finance models to miss their targets.
1. Underestimating interconnection costs. Developers frequently use a $0.05/W placeholder for interconnection and discover mid-development that network upgrade costs are $0.15–$0.30/W. Always get a Feasibility Study or System Impact Study result before locking in a financial model.
2. Ignoring OPEX escalation. Modeling flat OPEX over 25 years understates lifecycle costs by 20–30%. Apply a 2% annual escalator as a minimum; use 3% for labor-intensive line items.
3. Conflating DC and AC capacity. CAPEX is typically quoted per watt-DC (the panel nameplate rating), but energy production is measured in AC output. A 1.3 DC/AC ratio means a 100 MW-AC plant has 130 MW-DC of panels. Mixing these up inflates or deflates your cost-per-watt figures.
4. Omitting inverter replacement reserves. A 25-year model that does not include a capital reserve for inverter replacement at year 12–15 will show artificially high cash flows in the middle years and a cash shortfall when the replacement is needed.
5. Using LCOE as a substitute for project-level IRR. LCOE (levelized cost of energy — the average cost per MWh over a project’s life) is a useful screening tool but does not capture financing structure, tax equity timing, or merchant price exposure. Always build a full project finance model before making investment decisions.
The solar energy financial model on EFM is structured to avoid all five of these errors, with separate CAPEX and OPEX schedules, escalation inputs, and reserve account modeling.
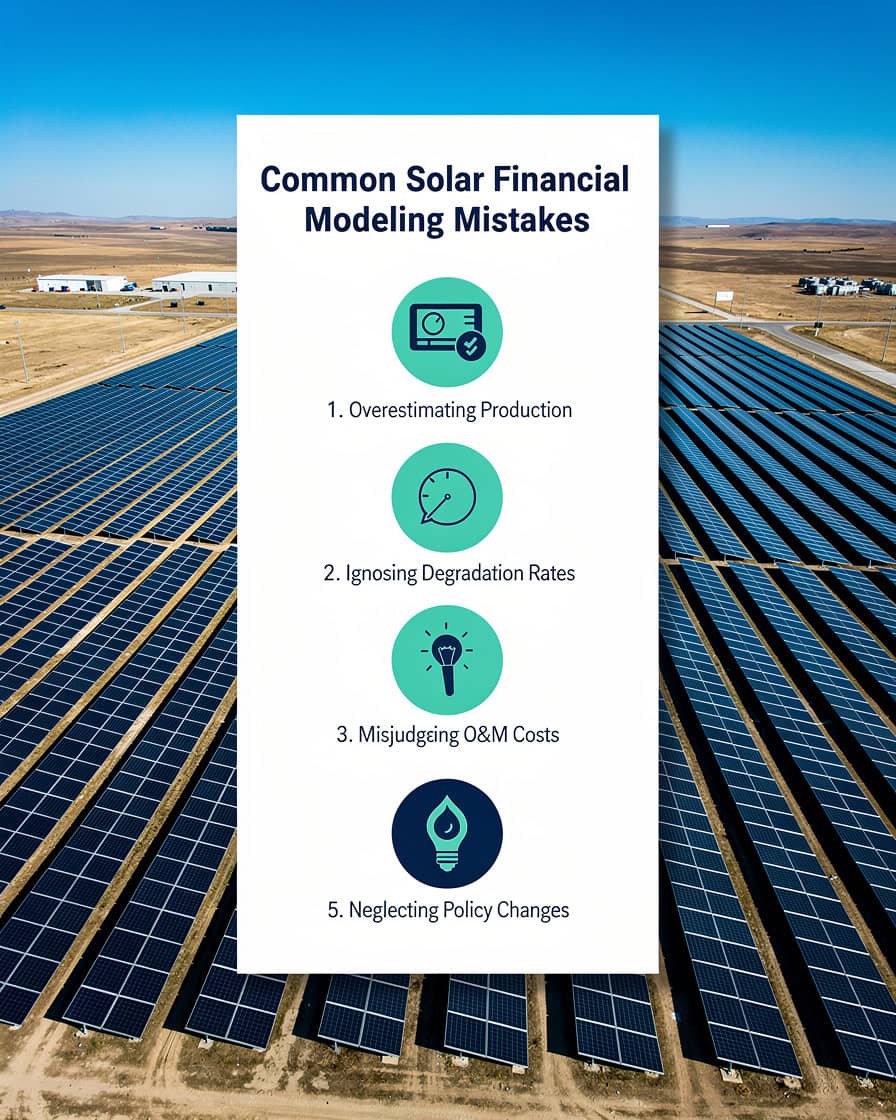
Conflating DC and AC capacity is one of the most common errors — a 1.3 DC/AC ratio means a 100 MW-AC plant has 130 MW-DC of panels.
Tools and Templates for Solar CAPEX and OPEX Modeling
Building a credible solar project finance model requires more than a spreadsheet with a few line items. Here is what a professional model should include.
- Construction draw schedule: Monthly CAPEX disbursements tied to EPC milestones, with interest during construction (IDC) calculated on drawn balances.
- Depreciation schedule: MACRS 5-year accelerated depreciation (the U.S. tax code allows solar assets to be depreciated over 5 years using the Modified Accelerated Cost Recovery System), which drives tax equity sizing.
- OPEX escalation table: Separate escalation rates for labor, insurance, and land lease.
- Energy production model: P50/P90 generation scenarios (P50 = 50% probability of exceeding; P90 = 90% probability of exceeding) linked to revenue and DSCR calculations.
- Sensitivity analysis: At minimum, stress-test CAPEX (+10%, +20%), OPEX (+15%), and energy yield (-5%, -10%).
The start-up solar farm Excel model and valuation on EFM includes all of these components in a single integrated workbook.
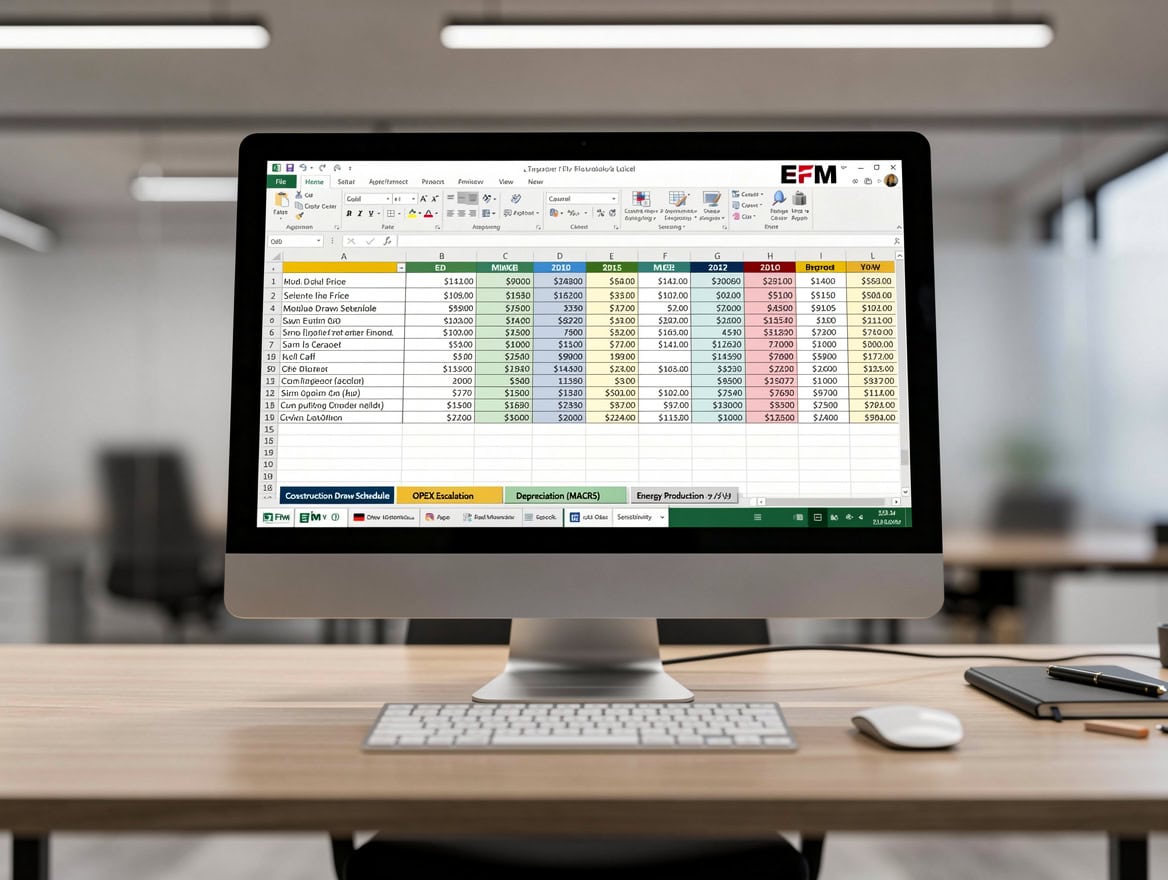
A professional solar project finance model requires at minimum five integrated schedules: construction draws, OPEX escalation, depreciation, energy production, and sensitivity analysis.
Frequently Asked Questions
What is a realistic all-in CAPEX for a 100 MW solar project in the U.S. in 2026?
For a 100 MW-DC project, expect total CAPEX in the range of $85 million to $110 million, based on the $0.85–$1.10/W-DC range observed in recent U.S. transactions. The wide range reflects regional differences in labor costs, interconnection complexity, and whether the developer pursues domestic content bonuses under the IRA. Projects in Texas and the Southwest tend to come in at the lower end due to simpler terrain and lower labor costs. Projects in the Northeast or in areas with complex grid upgrades can exceed $1.10/W. Always get a binding EPC quote and a System Impact Study result before finalizing your CAPEX assumption in a financial model.
How does OPEX affect solar project IRR?
OPEX has a smaller absolute impact than CAPEX on project IRR, but it is highly sensitive to escalation assumptions over a 25–35-year life. For a 100 MW project, a $5/kW-year increase in annual O&M (from $20 to $25/kW-year) reduces 25-year cumulative cash flow by approximately $12.5 million in nominal terms. At a 7% discount rate, that reduces project NPV by roughly $5–$6 million and compresses unlevered IRR by approximately 30–50 basis points. This is why lenders require OPEX stress tests at 115–120% of base case before approving project debt.
What percentage of solar CAPEX is hardware vs. soft costs?
Hardware (modules, inverters, and racking) accounts for roughly 40–50% of total CAPEX, according to PVcase’s utility-scale solar analysis. The remaining 50–60% covers BOS, EPC labor, interconnection, permitting, financing costs, and developer overhead. This ratio has shifted over the past decade as module prices fell faster than soft costs. In 2015, hardware was closer to 60–65% of CAPEX. The implication for developers is that cost reduction opportunities now lie more in soft cost management and interconnection strategy than in hardware procurement.
How long does a utility-scale solar project operate, and how does that affect OPEX budgeting?
Most utility-scale solar projects are designed for a 25–35-year operating life, with many developers now modeling 30 years as the base case given improved module durability data. Over that period, cumulative OPEX can equal or exceed the original CAPEX in nominal terms, especially when inverter replacements and insurance escalation are included. For a 100 MW project with $1 million/year in Year 1 OPEX escalating at 2%/year, 30-year cumulative OPEX reaches approximately $40.6 million — comparable to the net CAPEX after ITC on a well-structured project. This is why lifecycle cost modeling, not just upfront cost comparison, drives the best investment decisions.
What is the 30% ITC and how does it reduce net CAPEX?
The Investment Tax Credit (ITC) is a federal tax credit equal to 30% of eligible project costs under the Inflation Reduction Act of 2022. For a solar project, eligible costs include most CAPEX items: modules, inverters, racking, BOS, and EPC costs. Soft costs like financing fees are partially eligible. The credit is applied dollar-for-dollar against federal income tax liability, typically monetized through a tax equity partnership. For a $100 million CAPEX project, the ITC generates $30 million in tax credits, reducing the effective equity investment required. Projects meeting domestic content requirements can claim an additional 10% adder, bringing the total to 40%.
How do I model OPEX escalation in a solar financial model?
The standard approach is to apply separate escalation rates to each OPEX line item rather than a single blended rate. Labor-driven costs (O&M, vegetation management) typically escalate at CPI plus 0.5–1%, which in the current environment means 3–4%/year. Insurance has been escalating at 4–6%/year in wildfire and hail-exposed markets. Land leases often have fixed escalators of 1–2%/year written into the lease agreement. In Excel, you model this as: Year N OPEX = Year 1 OPEX × (1 + escalation rate)^(N-1). Running a sensitivity table with escalation rates from 1% to 4% across all line items shows the range of outcomes and helps size operating reserves appropriately.
What is the difference between fixed and variable O&M in solar?
Fixed O&M (operations and maintenance) is the annual cost that does not change with energy production: site security, scheduled preventive maintenance visits, SCADA monitoring fees, and administrative overhead. It is typically quoted in dollars per kW-year and runs $5–$10/kW-year for utility-scale projects. Variable O&M covers costs that scale with generation: corrective repairs triggered by equipment failures, cleaning costs in dusty environments, and performance-based contractor bonuses. Variable O&M is quoted in dollars per MWh and typically runs $0.50–$1.50/MWh. For a 100 MW project generating 200,000 MWh/year, variable O&M adds $100,000–$300,000 to the annual cost base on top of fixed O&M.
The CAPEX vs OPEX split in utility-scale solar is not just an accounting distinction — it shapes how projects are financed, taxed, and valued over their entire operating life. Getting the numbers right at the modeling stage prevents costly surprises during construction and operations.
I recommend starting with the solar energy financial model on EFM, which includes a fully integrated CAPEX build-up, OPEX escalation schedule, ITC calculation, and IRR/NPV outputs — everything you need to take a utility-scale solar project from concept to investment committee.
























































