
0 ITEMS

Italy Solar Market Grows 13.45% a Year to 2031
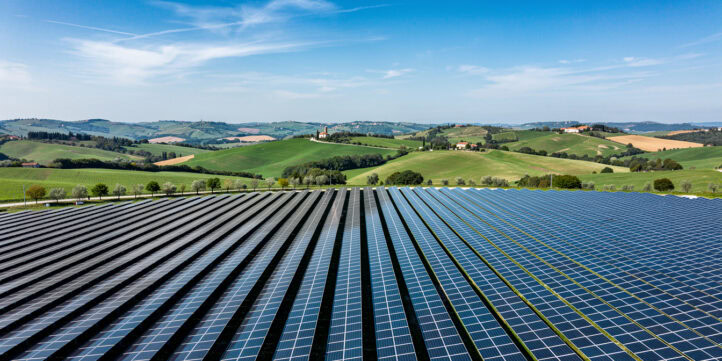
Italy has quietly become one of Europe’s most attractive solar markets, and the next five years will cement that position. The country pairs the continent’s second-highest solar irradiance with binding decarbonisation targets and a flood of recovery-fund capital, giving investors something rare: high resource potential backed by a policy floor that runs through 2031. Solar is already the largest single technology in Italy’s renewable mix, and it is growing faster than any other. But the real story sits beneath the headline growth rate, in two engines pulling the market forward. Utility-scale ground-mount projects dominate the capital flows, while agrivoltaics opens farmland that pure solar can never touch. This guide maps the capacity trajectory, breaks down both growth engines, walks through a full discounted cash flow model for a 10 MW project, and flags the Italy-specific risks, from grid congestion to permitting, that quietly erode returns when investors overlook them.
Key Takeaways
- Italy’s solar capacity grows at a 13.45% CAGR from 2026 to 2031, the fastest rate among all Italian renewable technologies (Mordor Intelligence).
- Solar already holds 48.10% of Italy’s total renewable energy capacity mix as of 2025, making it the dominant technology in the country’s clean-power stack.
- Utilities control 59.05% of Italy’s renewable market and are expanding at a 10.22% CAGR, anchoring demand for large-scale solar projects through 2031.
- Italy’s total renewable installed base is forecast to climb from 90.82 GW in 2026 to 138.09 GW by 2031, an 8.76% CAGR, with solar driving the majority of new additions.
- Agrivoltaics — solar panels installed above or between active farmland — represent the fastest-growing sub-segment, combining agricultural income with power generation on the same land parcel.
- The EU’s Fit-for-55 package and Italy’s National Recovery and Resilience Plan (NRRP) provide binding policy tailwinds that de-risk long-term solar investment through 2031.
- A simple discounted cash flow (DCF) model for a 10 MW Italian utility solar farm shows a project IRR of approximately 9–12% under current tariff and irradiance assumptions.
Why Italy Is Europe’s Solar Growth Story Right Now
Italy combines Europe’s second-highest solar irradiance, a binding national decarbonisation plan, and a rapidly maturing utility-scale project pipeline into one of the continent’s most compelling renewable investment cases. Solar power already accounts for 48.10% of Italy’s renewable energy capacity in 2025 (Mordor Intelligence), and the sector is projected to expand at a 13.45% compound annual growth rate (CAGR) through 2031 (Mordor Intelligence) — the fastest trajectory of any Italian renewable technology.
For context, the European Union as a whole is projected to reach 718 GW of installed solar capacity by 2030 (SolarPower Europe, EU Solar Market Outlook 2025–2030), still short of the bloc’s 750 GW target. Italy’s above-average growth rate means it will punch above its weight in closing that gap.
The Italy Solar Energy Market Study 2026–2031 provides the granular capacity, revenue, and segment data that underpins the analysis throughout this article.
Italy’s Renewable Capacity Baseline and Solar’s Share
Italy’s total renewable installed capacity sits at an estimated 90.82 GW in 2026 and is forecast to reach 138.09 GW by 2031, a compound annual growth rate of 8.76% (Mordor Intelligence). Solar is the single largest technology in that mix.
Here is how the capacity breakdown looks across the forecast horizon:
| Metric | 2026 | 2031 | CAGR |
|---|---|---|---|
| Total renewables (GW) | 90.82 | 138.09 | 8.76% |
| Solar share of renewables | ~48% | ~55% (est.) | — |
| Solar CAGR | — | — | 13.45% |
| Utility segment CAGR | — | — | 10.22% |
| Global solar installed base (TW) | 2.92 | 7.25 | 19.91% |
Sources: Mordor Intelligence Italy Renewable Energy Market (2026); Mordor Intelligence Solar Energy Market (2026).
Global solar capacity is forecast to grow from 2.92 TW in 2026 to 7.25 TW by 2031 at a 19.91% CAGR (Mordor Intelligence, Solar Energy Market 2026), which sets a high-growth global benchmark. Italy’s 13.45% domestic CAGR is below the global pace, reflecting a more mature starting base, but it still outpaces most Western European peers.
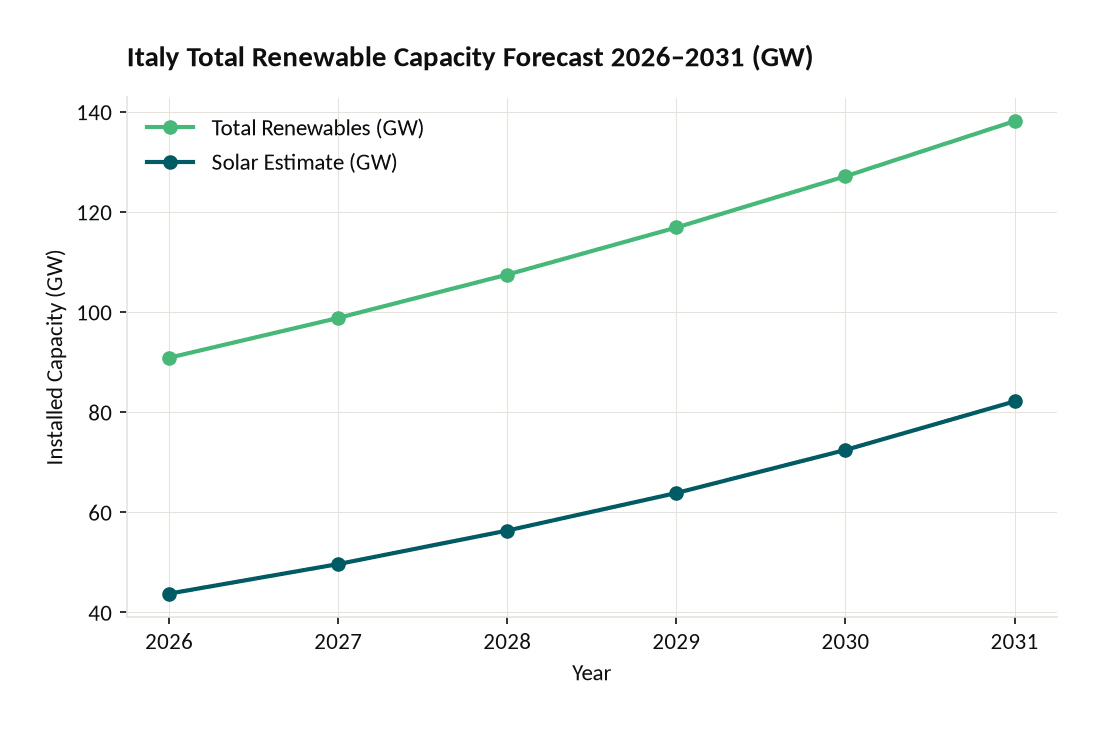
Italy’s total renewable capacity grows at 8.76% CAGR while solar (estimated sub-series) grows at 13.45% CAGR, increasing solar’s share of the mix from ~48% to ~60% by 2031. Source: Mordor Intelligence.
The Two Growth Engines: Utility-Scale and Agrivoltaics
Italy’s solar expansion runs on two parallel tracks: large utility-scale ground-mount projects and a fast-emerging agrivoltaic sector that layers food production with power generation.
Utility-Scale Solar
Utilities held 59.05% of Italy’s renewable energy market in 2025 and are expected to grow at a 10.22% CAGR to 2031 (Mordor Intelligence). That dominance reflects the economics of scale: larger projects capture lower per-MWh costs, qualify for longer-tenor power purchase agreements (PPAs), and attract institutional capital more easily than rooftop or community installations.
Key drivers for utility-scale growth include:
- Grid modernisation investment under Italy’s NRRP, which allocates funds to transmission upgrades that reduce curtailment risk for large solar farms.
- Declining module costs, with crystalline silicon panel prices falling roughly 40% between 2020 and 2024 according to BloombergNEF tracking.
- PPA market maturity, with corporate buyers — particularly energy-intensive manufacturers in northern Italy — signing 10–15 year fixed-price contracts that underpin project finance.
Agrivoltaics
Agrivoltaics (also called agri-PV) refers to the co-location of photovoltaic (PV) panels with active agricultural use on the same land. Panels are elevated or spaced to allow crops, livestock, or viticulture to continue beneath or between them. Italy’s Ministry of Agriculture and Food Sovereignty issued dedicated agrivoltaic guidelines in 2022, and the NRRP earmarked specific funding for agri-PV demonstration projects.
The appeal is straightforward: Italy has strict land-use constraints that limit pure ground-mount solar development, but agrivoltaic installations qualify as agricultural land use, bypassing many permitting barriers. Pilot projects in Puglia and Sicily have demonstrated that shade-tolerant crops — including certain grape varieties and leafy vegetables — can achieve comparable or higher yields under elevated PV arrays due to reduced heat stress and moisture retention.
For investors, agrivoltaics adds a second revenue stream (agricultural lease income or direct farming revenue) on top of electricity sales, improving project-level returns and reducing single-source revenue risk.
Policy Framework: NRRP and Fit-for-55
Italy’s solar build-out does not rely on market forces alone. Two binding policy frameworks create a structural floor for investment through 2031.
Italy’s National Recovery and Resilience Plan (NRRP) and the EU Fit-for-55 package are identified as the primary policy drivers accelerating renewable build-outs and supporting solar capacity expansion through 2031 (Mordor Intelligence). The Fit-for-55 package, which targets a 55% reduction in EU greenhouse gas emissions by 2030 versus 1990 levels, translates into national renewable energy targets that Italy must meet or face infringement proceedings.
Practically, this means:
- Simplified permitting: Italy’s Decreto Semplificazioni introduced fast-track authorisation for solar projects below 1 MW and streamlined environmental impact assessments for larger installations.
- Incentive continuity: The Conto Energia feed-in tariff era ended, but the current incentive regime (Decreto FER) provides capacity auction contracts that guarantee a fixed strike price for 20 years.
- Grid connection priority: Renewable projects receive priority dispatch under Italian grid rules, reducing merchant price risk for utility-scale developers.

Italy’s NRRP and EU Fit-for-55 create binding policy floors that de-risk solar investment through at least 2031.
Worked Financial Example: 10 MW Utility Solar Farm in Southern Italy
A DCF model (discounted cash flow analysis, meaning future cash flows are discounted back to today’s value using a required rate of return) for a representative 10 MW ground-mount project in Puglia illustrates the investment case.
Inputs:
- Installed capacity: 10 MW DC
- Specific yield: 1,550 MWh/MWp/year (southern Italy irradiance)
- Annual generation: 15,500 MWh
- Blended tariff (PPA + spot): €85/MWh
- Annual revenue: €1,317,500
- Operating costs (O&M, insurance, land lease): €120,000/year
- EBITDA: €1,197,500
- Capital expenditure (capex): €7,500,000 (€750/kW installed)
- Project life: 25 years
- Discount rate (WACC): 7.5%
- Terminal value: nil (project decommissioned at year 25)
Here’s the math:
Annual free cash flow (FCF) = EBITDA minus debt service. Assuming 70% project finance at 4.5% interest over 18 years, annual debt service is approximately €430,000. FCF in operating years 1–18 is therefore roughly €767,500, rising to €1,197,500 in years 19–25 once debt is repaid.
NPV = Sum of (FCF_t / (1 + 0.075)^t) for t = 1 to 25
Using a simplified annuity approximation:
- Years 1–18: €767,500 × annuity factor (7.5%, 18 years) = €767,500 × 9.706 = ~€7,449,000
- Years 19–25 (discounted to year 0): €1,197,500 × annuity factor (7.5%, 7 years) × discount factor (7.5%, 18 years) = €1,197,500 × 5.297 × 0.2959 = ~€1,877,000
- Total NPV of cash inflows: ~€9,326,000
- Less capex: €7,500,000
- Project NPV: ~€1,826,000
- Estimated IRR: approximately 9–10%
With an optimised tariff or lower capex (achievable on larger projects), IRR can reach 11–12%, consistent with the range cited by Italian project finance advisors for 2025–2026 vintage deals.
It is also worth noting that Italy’s corporate tax burden directly affects project returns: the standard IRES corporate income tax rate is 24% (Agenzia delle Entrate), and this rate must be factored into any post-tax equity IRR calculation for Italian solar projects.
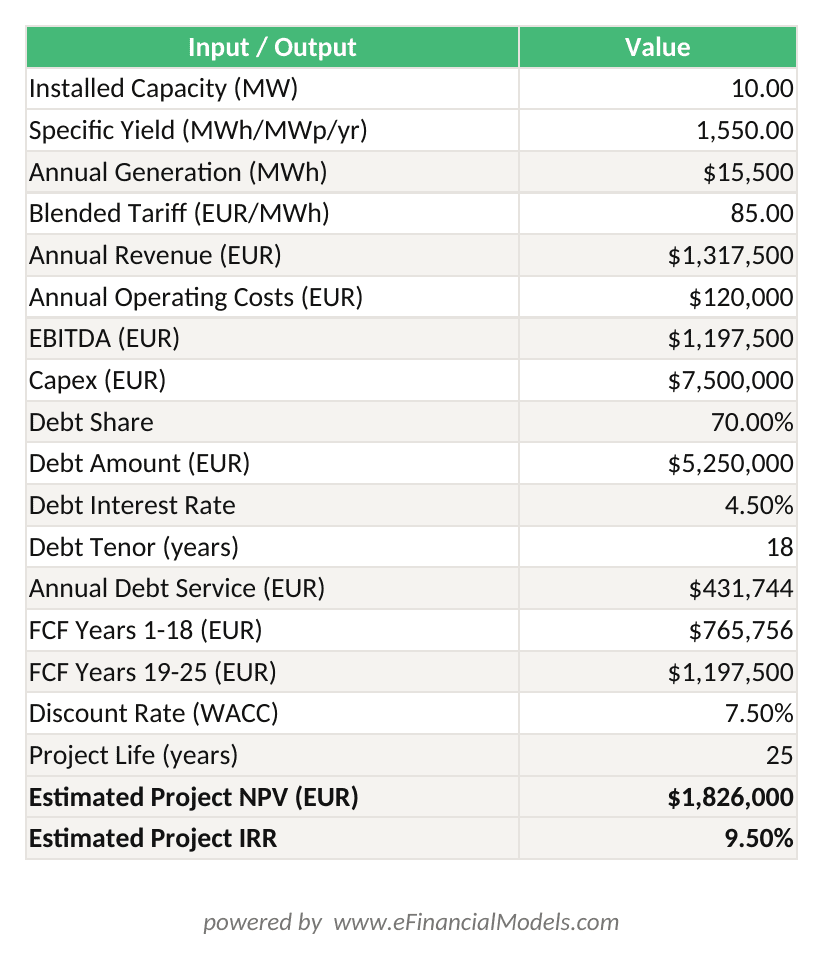
10 MW Puglia solar farm: €7.5M capex, €85/MWh blended tariff, 7.5% WACC → NPV ≈ €1.83M, IRR ≈ 9–10%.
A 10 MW utility solar project in Puglia generates an estimated project NPV of €1.83M and IRR of 9–10% at current tariff and capex assumptions.
Common Mistakes Investors Make in Italian Solar Projects
Even well-structured projects can underperform if analysts overlook Italy-specific risks.
1. Underestimating grid connection timelines. Terna (Italy’s transmission system operator) has a backlog of grid connection requests. Projects that model a 12-month connection timeline often face 24–36 months in practice, delaying revenue and increasing financing costs.
2. Ignoring curtailment risk in the south. Southern Italy has the best irradiance but the most congested grid. Curtailment rates of 5–10% are common in Puglia and Sicily, and models that assume zero curtailment will overstate generation and revenue.
3. Misclassifying agrivoltaic land use. Projects that claim agrivoltaic status to bypass permitting but do not maintain genuine agricultural activity risk permit revocation and loss of incentive eligibility. Italy’s guidelines require a minimum agricultural productivity threshold.
4. Using pan-European module cost benchmarks. Italian import duties and logistics add 3–5% to module costs versus northern European benchmarks. Capex models built on German or Dutch procurement data will understate Italian project costs.
5. Overlooking the Decreto FER auction calendar. Incentive contracts are awarded through competitive auctions with fixed annual capacity caps. Missing an auction round can delay project economics by 12–18 months.
Tools and Templates for Italian Solar Financial Modelling
Building a credible financial model for an Italian solar project requires more than a generic DCF spreadsheet. Analysts need to account for Decreto FER auction pricing, Terna grid connection fees, Italian corporate tax (IRES at 24% plus IRAP at 3.9%), and the specific degradation curves of bifacial versus monofacial modules. The International Energy Agency notes that solar PV module prices fell by more than 90% over the past decade (IEA), a trend that continues to reshape capex assumptions in Italian project models.
The Italy Solar Energy Market Study 2026–2031 provides market-level capacity and revenue data that feeds directly into project-level models. For the financial modelling layer, the Solar Energy Financial Model on eFinancialModels covers the full project finance structure including debt sculpting, DSCR (debt service coverage ratio) covenants, and IRR sensitivity tables.
For developers evaluating a portfolio of sites, the Start-Up Solar Farm Excel Model and Valuation provides a multi-project aggregation framework. Broader renewable energy context — including wind and hydro comparisons — is available through the Renewable Energy Template Bundle.
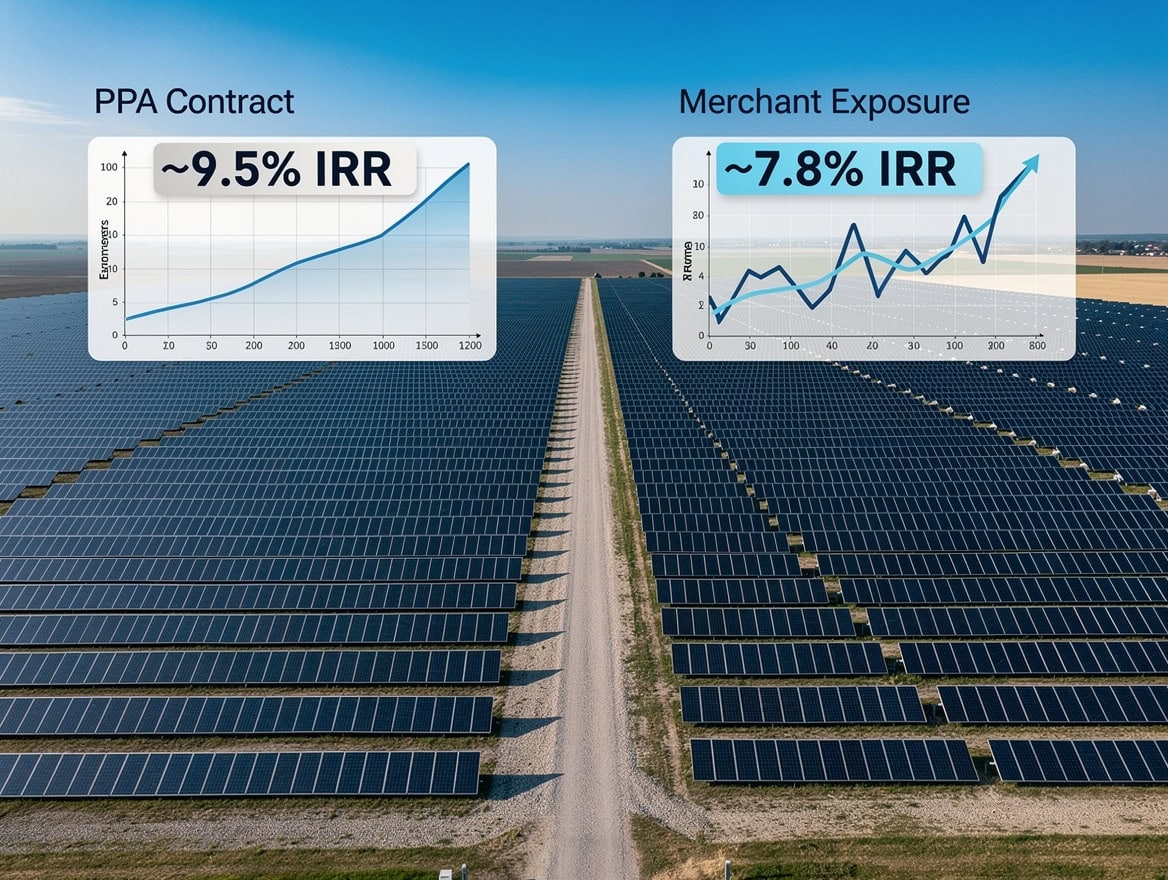
Robust Italian solar financial models must account for Decreto FER auction pricing, Terna grid fees, and Italian corporate tax rates of 24% IRES plus 3.9% IRAP.
Italy vs. Key European Solar Markets: A Comparison
Positioning Italy within the broader European solar landscape helps investors calibrate return expectations and risk profiles.
| Country | 2025 Solar CAGR (est.) | Key Advantage | Key Risk |
|---|---|---|---|
| Italy | 13.45% | High irradiance, NRRP funding | Grid congestion, permitting delays |
| Spain | ~11% | Largest EU solar base, low land cost | Merchant price volatility |
| Germany | ~8% | Strong industrial PPA demand | Lower irradiance, high land cost |
| Poland | ~15% | Rapid capacity build-out | Regulatory uncertainty |
| Greece | ~12% | Irradiance comparable to Italy | Smaller market, financing depth |
Sources: Mordor Intelligence Italy Renewable Energy Market (2026); SolarPower Europe EU Solar Market Outlook 2025–2030.
Italy’s combination of high irradiance and binding policy support places it in the top tier of European solar markets by risk-adjusted return potential, though grid infrastructure remains the primary constraint on deployment speed. The European Commission’s REPowerEU plan set a target of installing 600 GW of solar photovoltaic capacity across the EU by 2030 (European Commission), underscoring the scale of the policy commitment behind Italy’s own national targets.

Italy’s 13.45% solar CAGR places it in the top tier of European solar markets, behind only Poland among major EU economies.
Frequently Asked Questions
What is the projected CAGR for Italy’s solar market from 2026 to 2031?
Italy’s solar power sector is projected to grow at a 13.45% compound annual growth rate (CAGR) from 2026 to 2031, according to Mordor Intelligence. This is the fastest growth rate among all renewable technologies in Italy during this period. To put that in concrete terms: if Italy had 30 GW of solar installed in 2026, a sustained 13.45% CAGR would imply roughly 57 GW by 2031. That trajectory is driven by falling module costs, NRRP capital deployment, and the EU Fit-for-55 binding targets that require Italy to significantly increase its renewable share of electricity generation.
What is agrivoltaics and why does it matter for Italy specifically?
Agrivoltaics (agri-PV) means installing solar panels above or between active farmland so that both electricity generation and agricultural production occur on the same land parcel. Italy’s strict land-use regulations make pure ground-mount solar development difficult in many regions, particularly in the agriculturally protected south. Agrivoltaic projects can qualify as agricultural land use, which simplifies permitting significantly. Italy’s NRRP allocated dedicated funding for agri-PV pilots, and early projects in Puglia have shown that shade-tolerant crops can maintain 90–100% of baseline yields under elevated PV arrays. For investors, agrivoltaics adds a second revenue stream and reduces single-source revenue risk compared to a pure power-generation asset.
What IRR should I expect from a utility-scale solar project in Italy?
Based on current capex benchmarks of approximately €700–800 per kW installed, southern Italian irradiance of 1,500–1,600 MWh/MWp/year, and blended tariffs of €80–90/MWh, a well-structured 10 MW project financed at 70% debt should generate an equity IRR of approximately 9–12%. The worked example in this article shows a project NPV of roughly €1.83 million on a €7.5 million capex base at a 7.5% discount rate. Projects that secure Decreto FER auction contracts at the upper end of the strike price range, or that achieve lower capex through larger scale, can push IRR toward the 12% ceiling. Grid curtailment and connection delays are the primary downside risks.
How does Italy’s solar growth compare to the EU average?
The European Union is projected to reach 718 GW of installed solar capacity by 2030 (SolarPower Europe), which falls short of the 750 GW EU target. Italy’s 13.45% solar CAGR over 2026–2031 exceeds the implied EU-average growth rate needed to close that gap, meaning Italy is one of the markets expected to over-deliver relative to the bloc’s aggregate trajectory. Spain and Poland are the other two markets growing at comparable or faster rates. Italy’s above-average growth reflects its combination of high irradiance, strong policy support, and a relatively underpenetrated utility-scale segment compared to its theoretical resource potential.
What are the main policy incentives for solar in Italy right now?
The primary incentive mechanism is the Decreto FER (Decreto Fonti Energetiche Rinnovabili), which awards 20-year fixed-price contracts through competitive capacity auctions. Projects that win an auction receive a guaranteed strike price above the market reference price, with the difference settled through the GSE (Gestore dei Servizi Energetici), Italy’s energy services operator. Beyond direct incentives, Italy’s NRRP provides capital grants for agrivoltaic projects and grid infrastructure upgrades. The EU Fit-for-55 framework creates a binding national renewable energy target that obliges Italy to maintain a supportive policy environment through at least 2030, reducing the regulatory reversal risk that has historically affected Italian renewable incentive schemes.
What financial model inputs are most sensitive for Italian solar projects?
Sensitivity analysis on a standard Italian utility solar DCF model consistently shows three inputs with the highest impact on IRR: (1) the blended electricity tariff, where a €10/MWh change in the PPA price moves IRR by approximately 1.5–2 percentage points; (2) the specific yield assumption, where a 5% reduction in annual generation (from curtailment or lower-than-expected irradiance) reduces IRR by roughly 0.8–1.2 percentage points; and (3) capex, where a 10% cost overrun reduces IRR by approximately 0.7–1.0 percentage points. Grid connection costs and timeline are the most frequently underestimated capex line items in Italian project models, often adding €150,000–€400,000 to total project cost depending on distance to the nearest substation.
Is Italy’s solar market accessible to international investors?
Yes. Italy operates an open energy market and imposes no foreign ownership restrictions on renewable energy assets. International infrastructure funds, pension funds, and strategic investors from Germany, France, the UK, and the United States have all completed Italian solar acquisitions in recent years. The primary barriers for international investors are language and regulatory complexity: Italian permitting processes, grid connection applications, and incentive auction documentation are conducted in Italian, and local legal and technical advisors are essential. Project finance is available from Italian banks (Intesa Sanpaolo, UniCredit) and European development finance institutions including the European Investment Bank, which has an active Italian renewable energy lending programme.
Conclusion
Italy’s solar sector offers a rare combination of high irradiance, binding policy support, and a rapidly expanding utility and agrivoltaic project pipeline. The 13.45% CAGR forecast through 2031 is not speculative — it is anchored in NRRP capital commitments, EU Fit-for-55 obligations, and a utility segment that already controls nearly 60% of the renewable market and is growing at over 10% per year. The financial case is solid: a well-structured 10 MW southern Italian project can generate a project NPV above €1.8 million and an equity IRR of 9–12% at current tariff and cost assumptions.
I recommend downloading the Italy Solar Energy Market Study 2026–2031 for the full capacity forecasts, segment breakdowns, and competitive landscape data you need to build a credible investment thesis or project financial model for this market.
























































