
0 ITEMS

Spain Solar Pays 6.58% Regulated Returns to 2031

Spain has Europe’s best solar resource and one of its most aggressive renewable targets, but the investment story for 2026 to 2031 is no longer about sunshine. It is about grid access, auction discipline, and regulatory returns. Solar is now the fastest-growing segment of Spain’s energy mix and the main vehicle for reaching the country’s 81% renewable electricity goal by 2030, which guarantees a steady flow of auction rounds and capital for years to come. Yet the same penetration that makes Spain attractive is straining its transmission network, and a €13.6 billion grid plan that favours reinforcement over new connections has turned grid capacity into the real constraint on returns. This guide lays out the capacity trajectory, the REER auction framework and how it compares to neighbouring markets, the regulatory return increase to 6.58% and what it does to project value, and the curtailment and merchant-price risks that separate a bankable model from an optimistic one.
Key Takeaways
- Spain’s solar capacity grows at a 10.09% CAGR through 2031, the fastest rate among all generation types, making it the single most important segment for renewable capital deployment (Mordor Intelligence, 2025).
- The regulatory return for electricity transmission and distribution rises from 5.58% to 6.58% for the 2026-2031 period, directly improving risk-adjusted IRR for transmission-connected utility-scale projects (Reuters, 2025).
- Spain’s €13.6 billion grid investment plan for 2025-2030 allocates 75% to grid strengthening, but the pace of transmission upgrades still lags the solar connection queue, creating curtailment risk in high-penetration regions (IEEFA, 2025).
- Spain targets 81% of electricity generation from renewable sources by 2030, requiring a substantial auction pipeline to bridge the gap from the current installed base (IEEFA, 2030).
- Solar accounts for 42.62% of Spain’s total installed renewable capacity, anchoring the country’s decarbonization strategy around utility-scale photovoltaic deployment.
- Global solar capacity expands from 2.92 TW in 2026 to 7.25 TW by 2031 at a 19.91% CAGR, but Spain’s 10.09% domestic rate reflects a more mature, auction-constrained market with tighter grid economics (Mordor Intelligence, 2026).
- Energy analytics platforms supporting asset optimization grow from USD 6.10 billion to USD 10.10 billion at a 10.6% CAGR, giving data-driven operators a measurable edge in auction bidding and curtailment management (MarketsandMarkets, 2026).
Spain Solar Market Snapshot: 2026-2031 Capacity Growth Trajectory
Spain’s utility-scale solar sector enters the 2026-2031 window as the fastest-growing segment in the country’s renewable mix, compounding installed capacity at 10.09% annually through 2031. That rate sits well above the 6.78% CAGR projected for Spain’s total renewable energy capacity, which rises from an estimated 112.39 GW in 2026 to 155.96 GW by 2031 (Mordor Intelligence, 2026).
Solar energy held a 42.62% share of Spain’s installed renewable capacity in 2025 (Mordor Intelligence, 2025). Applying the 10.09% CAGR to the solar sub-segment implies that solar’s absolute GW base roughly doubles over the six-year study period. For investors, that trajectory translates into a sustained auction pipeline, consistent PPA (power purchase agreement) demand, and a growing secondary market for operational assets.
Here’s the math on capacity additions: if Spain’s solar base stood at approximately 32 GW in early 2026 (consistent with solar’s 42.62% share of the 2026 renewable total), a 10.09% CAGR produces roughly 57 GW by 2031, implying net additions of approximately 25 GW over five years, or around 5 GW per year on average. That annual build rate requires a continuous flow of auction rounds, grid connection approvals, and project finance closings.

Projected solar capacity growth at 10.09% CAGR implies ~5 GW of net additions per year, requiring a sustained REER auction pipeline. Source: Mordor Intelligence (2025), EFM calculations.
Solar’s Position Within Spain’s Renewable Mix and 2030 Targets
Solar is not just the largest renewable segment in Spain by installed capacity share; it is the primary instrument through which Spain intends to reach its 81% renewable electricity generation target by 2030 (IEEFA). Reaching that target requires converting installed GW into actual TWh generation, which depends on capacity factors, curtailment rates, and the timing of grid reinforcements.
Utility-scale solar in Spain’s southern regions, particularly Andalusia, Extremadura, and Castilla-La Mancha, typically achieves capacity factors between 22% and 28% for fixed-tilt configurations and 26% to 32% for single-axis tracking systems, based on irradiance data from Spain’s national meteorological agency AEMET. A 100 MW single-axis project at a 28% capacity factor generates approximately 245 GWh per year. Scaling that across 25 GW of new additions implies roughly 61 TWh of incremental annual generation, a material contribution toward the 2030 target.
The distinction between installed capacity (GW, a stock measure) and generation (GWh or TWh, a flow measure) matters for financial modeling. Investors bidding in auctions price the energy yield, not the nameplate capacity. A project in Extremadura with superior irradiance and a single-axis tracker will generate more revenue per MW of installed capacity than a fixed-tilt project in a less favorable location, even at the same auction strike price.
Spain’s 81% renewable generation target by 2030 anchors the utility-scale solar auction pipeline for the entire study period.
Utility-Scale Solar Auction Framework and Competitive Dynamics
Spain’s renewable energy auction mechanism, known as REER (Régimen Económico de Energías Renovables), allocates long-term contracts to utility-scale generators through competitive bidding on a strike price per MWh. The auction framework sets a price cap, requires security deposits, and awards contracts to the lowest bidders, creating strong downward pressure on strike prices over successive rounds.
Recent REER rounds have seen solar projects clear at strike prices broadly in the range of €35 to €55 per MWh, reflecting the continued decline in utility-scale solar LCOE (levelized cost of energy, the all-in cost per MWh over a project’s lifetime). LCOE benchmarks for utility-scale solar in Spain as of 2026 range from approximately €28 to €38 per MWh for projects above 100 MW, and €32 to €45 per MWh for projects in the 50 to 100 MW range, based on industry cost data from Red Eléctrica de España (REE) and project finance advisories. The spread between LCOE and auction strike price defines the developer’s margin and the equity IRR. According to the International Renewable Energy Agency (IRENA), the global weighted-average LCOE for utility-scale solar PV fell by 90% between 2010 and 2023, underscoring the structural cost compression that has driven auction prices to current levels (IRENA, Renewable Power Generation Costs 2023).
Compared to other European markets, Spain’s auction framework is competitive but not the most aggressive. Portugal has run auctions clearing below €20 per MWh for large-scale solar, driven by lower land costs and simpler permitting. Italy and France impose local content requirements and more complex grid connection procedures that raise effective project costs. Spain sits in a middle position: strong irradiance, established developer ecosystem, but increasing grid connection complexity as the queue grows.
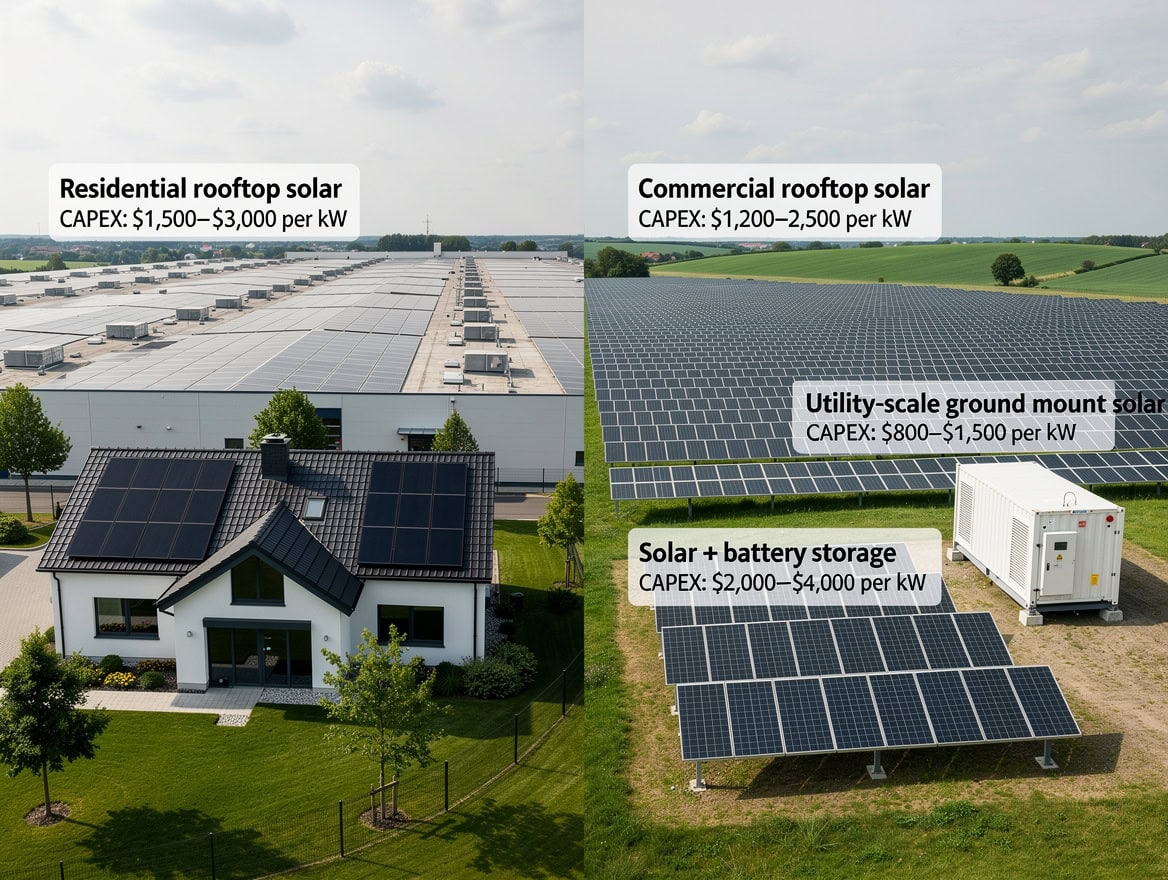
Spain’s REER auctions clear at €35-55/MWh, above Portugal but below Italy and France, reflecting its mature developer ecosystem.
| Feature | Spain (REER) | Portugal | Italy | France |
|---|---|---|---|---|
| Auction mechanism | Strike price (CfD-style) | Strike price | Strike price | Strike price |
| Typical solar strike price (€/MWh) | 35-55 | 18-25 | 40-60 | 50-70 |
| Local content requirement | No | No | Partial | Yes |
| Grid connection queue | Long (12-24 months) | Moderate | Long | Moderate |
| Security deposit required | Yes | Yes | Yes | Yes |
| Permitting complexity | High | Moderate | Very high | Moderate |
Sources: REE, DGEG Portugal, GSE Italy, CRE France — figures are indicative ranges based on publicly reported auction results through 2025.
Grid Investment Gap: The €13.6 Billion Constraint on Solar Deployment
The single largest structural constraint on utility-scale solar deployment in Spain is not capital availability or irradiance; it is grid capacity. Spain has proposed €13.6 billion of investment in its power grids for 2025-2030, with roughly 75% of that allocation directed toward grid strengthening rather than new connections (IEEFA, 2025).
That 75% allocation to strengthening, rather than expansion, reflects a deliberate policy choice: Spain’s transmission operator REE is prioritizing the reliability of the existing network before adding new injection points. For utility-scale solar developers, this creates two practical problems. First, grid connection queue times in high-solar regions like Andalusia and Extremadura have extended to 18 to 36 months in some cases, delaying project commissioning and pushing back revenue start dates. Second, projects that do connect face higher curtailment probability as solar penetration increases on constrained transmission corridors.
Curtailment risk is not hypothetical. During peak solar generation hours in southern Spain in 2024 and 2025, REE reported instances of negative wholesale prices and instructed curtailments on specific transmission corridors, particularly in Andalusia. Developers modeling projects in these regions should apply a curtailment haircut of 3% to 8% on annual energy yield, depending on the specific substation and transmission path.
For project finance purposes, grid connection cost premiums in constrained areas can add €15,000 to €40,000 per MW to capital expenditure, materially affecting project LCOE and equity returns. Spain’s total electricity grid spans approximately 44,000 kilometres of high-voltage transmission lines managed by REE (Red Eléctrica de España, Annual Report 2023), illustrating the scale of infrastructure that must be reinforced to accommodate the projected solar additions.
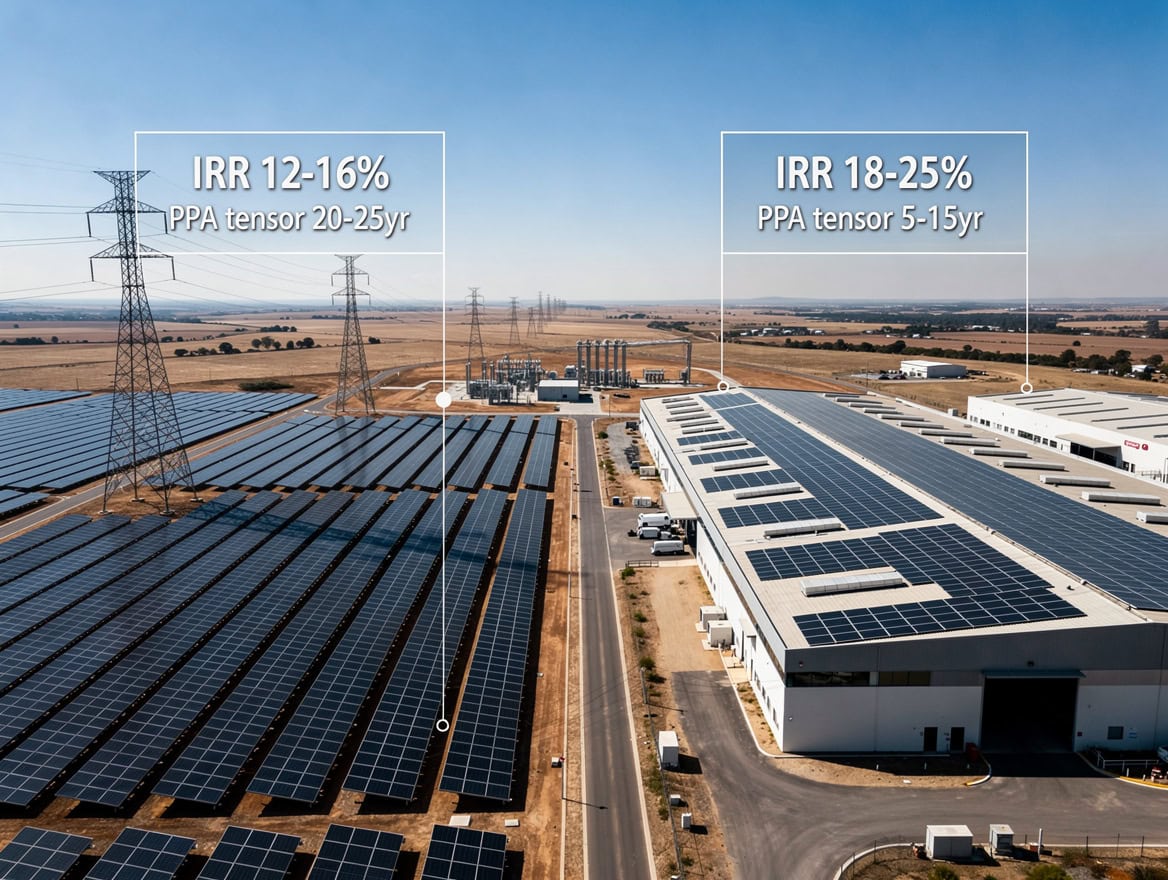
75% of Spain’s €13.6B grid budget goes to strengthening existing lines, not new solar connection points — the key bottleneck for developers.
Regulatory Return Environment: 6.58% Floor and IRR Implications
Spain’s competition authority CNMC (Comisión Nacional de Mercados y la Competencia) set the regulated financial return for electricity transmission, system operation, and distribution at 6.58% for the 2026-2031 regulatory period, up from 5.58% in the prior six-year period (Reuters, 2025). This 100 basis point increase is significant for transmission-connected utility-scale solar projects that receive regulated revenue components.
The regulated return functions as a floor on the cost of capital for network assets and influences the discount rate applied to regulated cash flows. For a project with a regulated revenue component, a higher allowed return means the regulator acknowledges a higher cost of capital, which in turn supports higher tariff levels and more predictable cash flows.
Worked NPV Example: Impact of the 100 Basis Point Return Increase
Assume a 100 MW utility-scale solar project with the following inputs:
- Annual regulated revenue component: €4.0 million
- Project life: 25 years
- Previous discount rate (reflecting 5.58% regulatory return): 7.5%
- New discount rate (reflecting 6.58% regulatory return): 6.5%
Here’s the math:
NPV at 7.5% discount rate: €4.0M × 1 – (1 + 0.075)^(-25) / 0.075 = €4.0M × 11.147 = €44.6 million
NPV at 6.5% discount rate: €4.0M × 1 – (1 + 0.065)^(-25) / 0.065 = €4.0M × 11.937 = €47.7 million
The 100 basis point reduction in the discount rate (driven by the higher regulatory return floor) increases the NPV of the regulated revenue stream by approximately €3.1 million, or roughly 7%, on a 100 MW project. For a portfolio of 500 MW, that differential exceeds €15 million in present value terms.
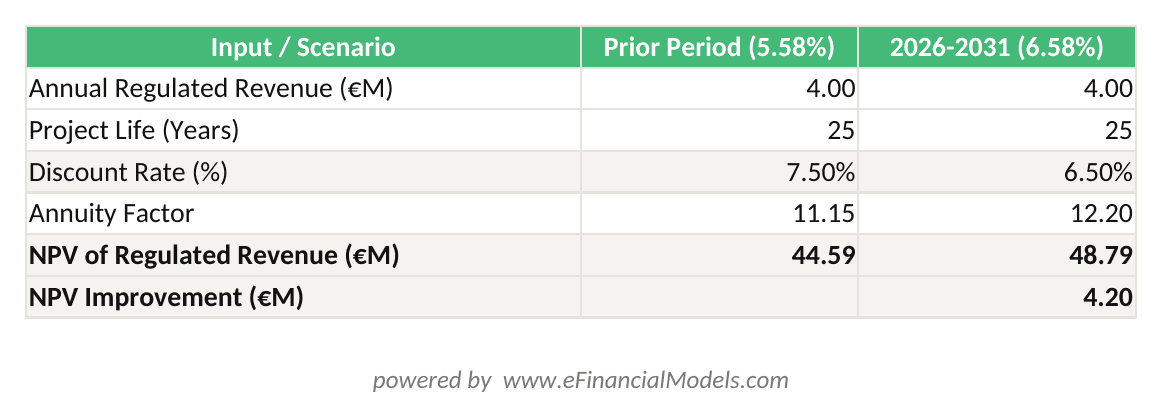
A 100bp rise in Spain’s regulated return (5.58% to 6.58%) increases the NPV of a 100 MW project’s regulated revenue stream by €3.1M — over €15M across a 500 MW portfolio.
A 100bp reduction in discount rate adds €3.1M in NPV per 100 MW project — €15M+ across a 500 MW portfolio.
Financial Modeling Framework for Utility-Scale Solar Projects in Spain
A robust financial model for a Spanish utility-scale solar project during the 2026-2031 period must capture five core value drivers: energy yield, revenue structure, capital costs, operating costs, and financing terms.
For energy yield, the model should use site-specific P50 and P90 generation estimates (P50 is the median expected output; P90 is the output exceeded 90% of the time, used for debt sizing). A 100 MW single-axis project in Extremadura with a P50 capacity factor of 28% generates 245 GWh per year. Applying a 5% curtailment haircut reduces net generation to 233 GWh.
For revenue, most bankable projects combine an auction strike price (fixed for 12 to 20 years under REER) with a merchant tail (uncontracted generation sold at pool prices). Spanish wholesale pool prices for solar generation hours have ranged from €35 to €80 per MWh over 2023-2025, with significant intraday volatility. Merchant exposure beyond the contracted period requires a price curve assumption; conservative models use a flat real price of €45 to €55 per MWh in 2026 terms.
Capital costs for a 100 MW project in Spain currently range from €550,000 to €750,000 per MW all-in (including grid connection, land, EPC, and development costs), implying total project capex of €55 million to €75 million. Operating costs run approximately €12,000 to €18,000 per MW per year.
For a project finance structure with 70% debt at 5.5% interest over 18 years and 30% equity, a 100 MW project generating 233 GWh at €48/MWh average revenue produces annual revenue of approximately €11.2 million. After operating costs of €1.5 million and debt service of approximately €5.8 million, equity cash flow is roughly €3.9 million per year, implying an equity IRR in the range of 8% to 11% depending on capex, curtailment, and merchant price assumptions.
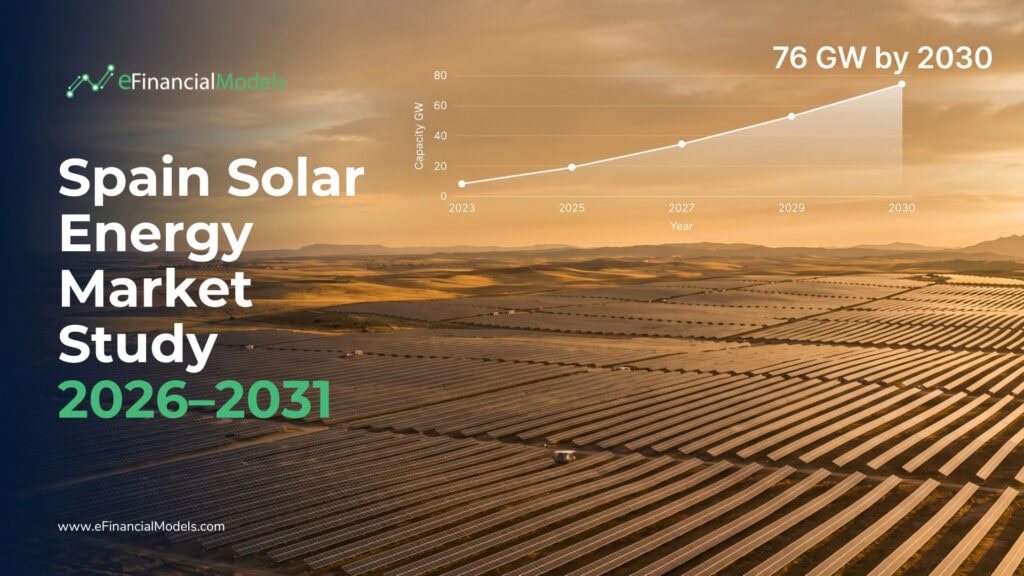
For a ready-to-use modeling framework covering these inputs, the Spain Solar Energy Market Study 2026-2031 provides structured scenario analysis across the key variables.
Curtailment Risk and Merchant Exposure: Managing Downside
As solar penetration in Spain’s grid increases toward and beyond 30% of annual generation, curtailment risk becomes a first-order financial variable, not a footnote. Curtailment occurs when the grid operator instructs a generator to reduce output because the transmission system cannot absorb the power, typically during midday hours when solar generation peaks and demand is moderate.
Developers can manage curtailment risk through three strategies. First, site selection: projects connected to less congested substations or closer to load centers face lower curtailment probability. Second, battery storage co-location: pairing a solar project with a 2-hour battery system shifts generation from peak curtailment hours to evening demand periods, improving revenue capture. Third, PPA structure: a well-structured PPA (a long-term bilateral contract between a generator and an offtaker at a fixed or indexed price) can include curtailment compensation clauses that protect revenue even when the grid operator instructs a reduction.
Merchant price exposure compounds curtailment risk. As solar capacity grows, the “solar cannibalisation” effect depresses pool prices during peak solar hours. Spanish wholesale prices during midday solar hours have already shown a structural decline relative to evening prices. Financial models should apply a capture price discount of 10% to 20% relative to the average pool price to reflect the correlation between high solar output and low prices.
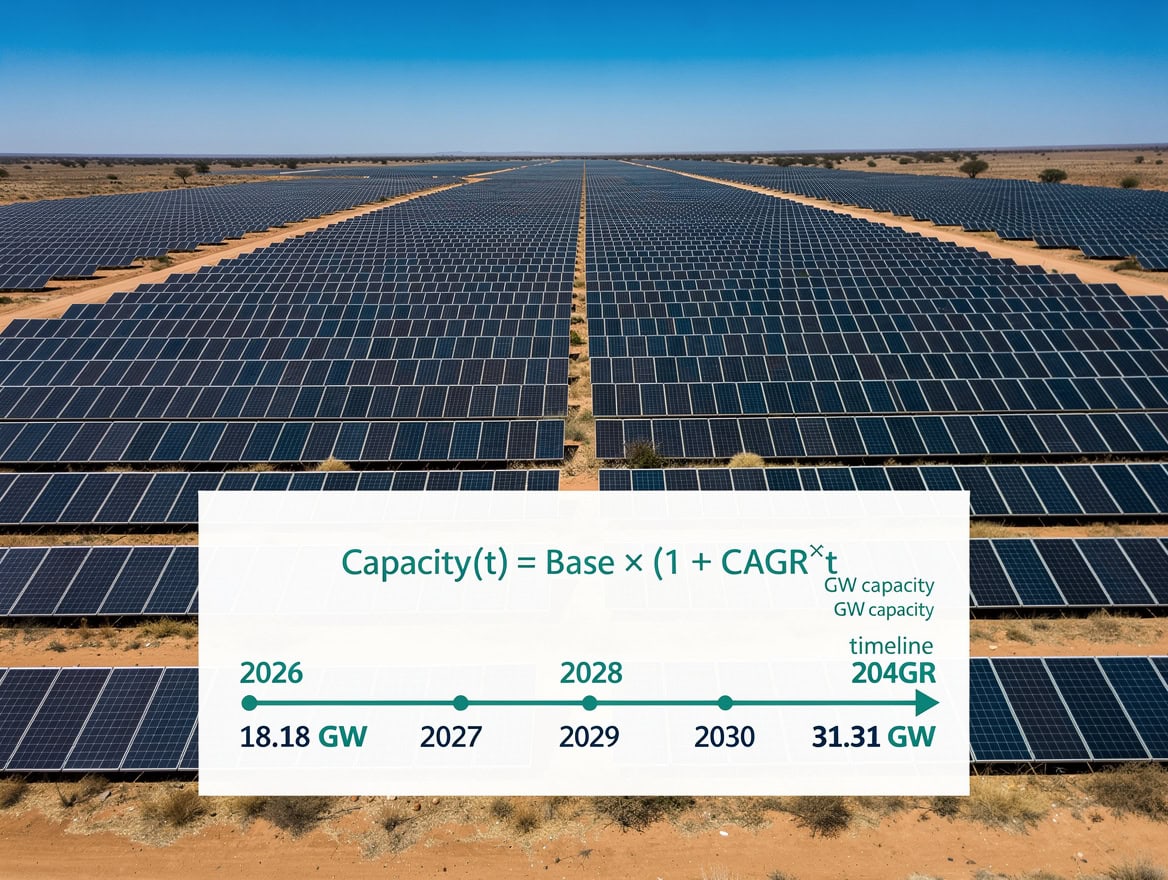
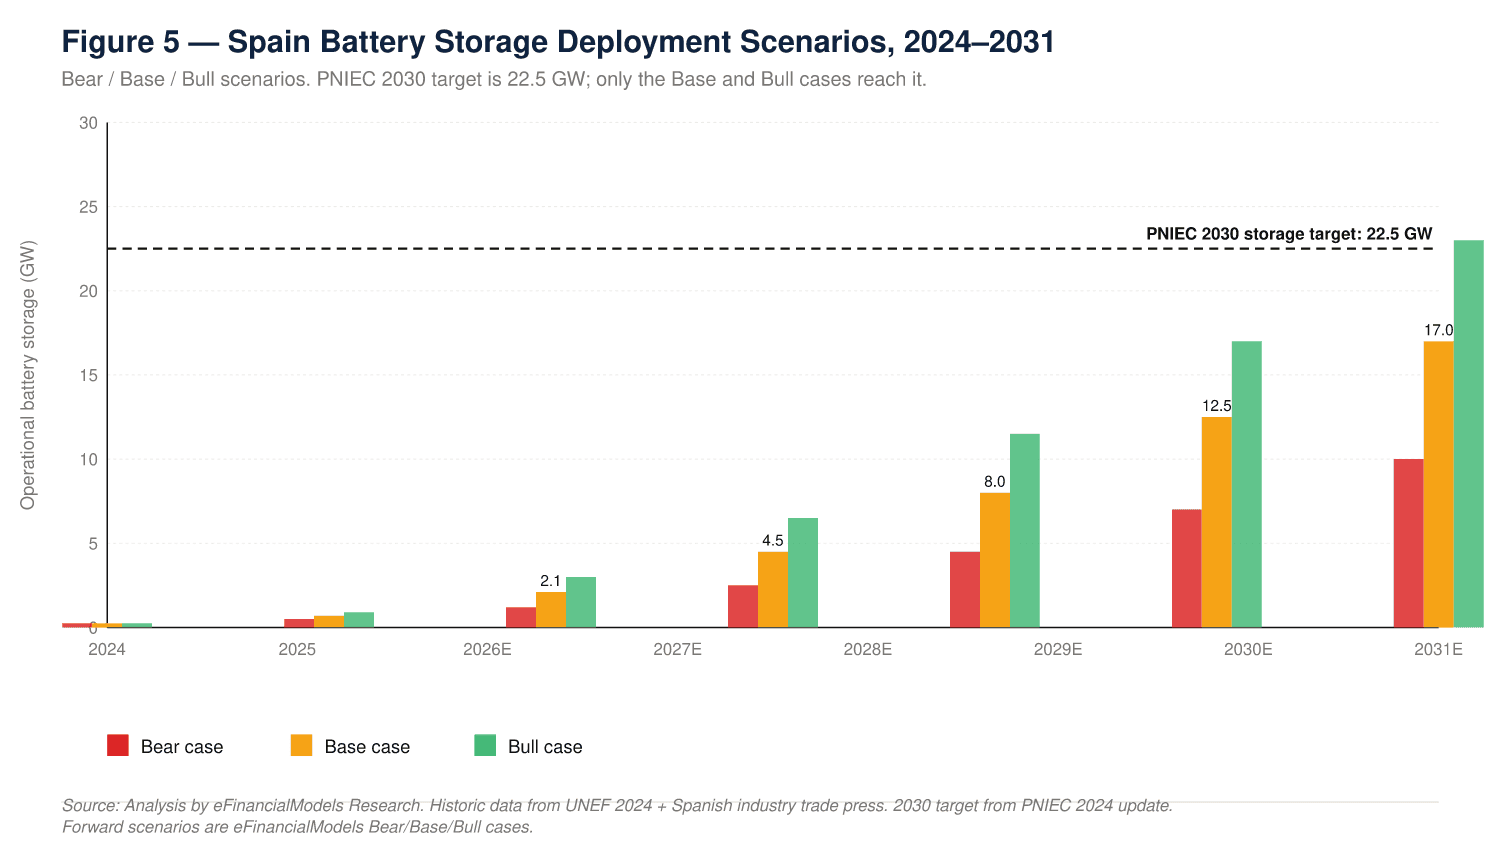
Co-located battery storage shifts solar generation from curtailment-risk midday hours to higher-value evening demand periods.
The Role of Energy Analytics in Optimizing Utility-Scale Solar Assets
Energy analytics platforms give utility-scale solar operators a quantifiable performance edge. The energy and utilities analytics market grows from USD 6.10 billion in 2026 to USD 10.10 billion by 2031 at a 10.6% CAGR (MarketsandMarkets, 2026), reflecting rapid adoption across generation, transmission, and trading functions.
For utility-scale solar in Spain, analytics platforms serve three functions. First, yield forecasting: machine learning models trained on local irradiance, temperature, and soiling data improve P50 accuracy, reducing the uncertainty premium lenders apply to debt sizing. Second, auction bidding optimization: data-driven models that forecast future pool prices and curtailment probability allow developers to bid more precisely in REER auctions, avoiding the trap of bidding too low (destroying returns) or too high (losing the contract). Third, asset performance monitoring: real-time inverter and string-level monitoring identifies underperformance early, reducing yield losses from soiling, shading, or equipment degradation.
Operators who deploy analytics systematically can expect to recover 1% to 3% of annual generation that would otherwise be lost to undetected underperformance, a meaningful improvement on a 100 MW asset generating €11 million in annual revenue.
Global Context: Spain’s Solar CAGR vs. Worldwide Expansion
Spain’s 10.09% solar CAGR sits well below the global rate. Globally, installed solar energy capacity is projected to increase from 2.92 TW in 2026 to 7.25 TW by 2031, corresponding to a 19.91% CAGR (Mordor Intelligence, 2026). The gap reflects Spain’s more mature starting position: the country already has one of the highest solar penetration rates in Europe, so incremental growth is slower in percentage terms even as absolute additions remain large.
For institutional investors, the global context matters for capital allocation. Markets with 20%+ CAGRs (India, Southeast Asia, parts of the Middle East) offer higher growth but carry greater regulatory, currency, and offtake risk. Spain offers a lower growth rate but a more predictable regulatory framework, euro-denominated cash flows, EU legal protections, and a liquid secondary market for operational assets. The risk-adjusted return profile favors Spain for investors prioritizing capital preservation alongside yield.
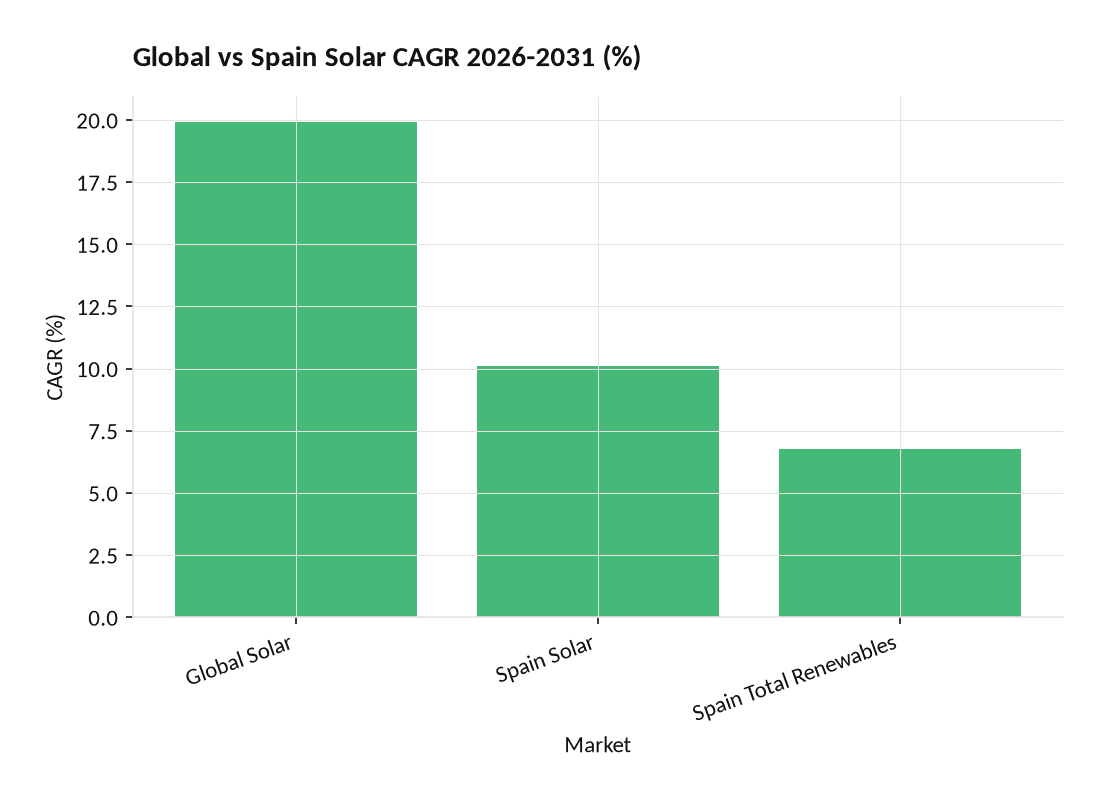
Spain’s solar CAGR of 10.09% trails the global rate of 19.91% but exceeds its own total renewables growth, confirming solar’s dominant role in the national energy transition. Sources: Mordor Intelligence (2025, 2026).
Investment Thesis and Capital Deployment Priorities for 2026-2031
The 2026-2031 window presents a specific and time-bounded opportunity for utility-scale solar investment in Spain. Three factors converge to make this period distinct from prior cycles.
First, the regulatory return increase to 6.58% improves the economics of transmission-connected assets and signals a regulator willing to support grid investment, which indirectly benefits solar developers by accelerating the grid reinforcements needed to absorb new capacity.
Second, the auction pipeline required to meet the 81% renewable generation target by 2030 implies a sustained flow of REER rounds through 2028 at minimum, giving developers multiple entry points and reducing the risk of a single-auction concentration.
Third, the grid investment bottleneck, while a constraint, also creates a competitive moat. Developers who secure grid connection rights early, particularly in less congested regions or through direct negotiation with REE for dedicated connection infrastructure, gain a durable advantage over later entrants.
Capital deployment priorities, in order of risk-adjusted attractiveness: (1) operational assets with long-term REER contracts in low-curtailment regions, offering stable cash flows and immediate yield; (2) late-stage development assets with grid connection rights secured, offering development upside at moderate risk; (3) early-stage development in high-irradiance regions with clear permitting pathways, offering the highest potential returns but requiring patience on permitting timelines of 24 to 48 months.
For renewable energy project finance modeling across these scenarios, the EFM Renewable Energy Template Bundle provides structured frameworks for each stage of the capital stack.
Frequently Asked Questions
What CAGR is Spain’s utility-scale solar market expected to achieve between 2026 and 2031?
Spain’s solar energy segment is projected to grow at a 10.09% CAGR through 2031, the fastest rate among all generation types in the country’s renewable mix, according to Mordor Intelligence. This compares to a 6.78% CAGR for Spain’s total renewable energy capacity, which rises from 112.39 GW in 2026 to 155.96 GW by 2031. The solar-specific rate implies that the installed solar base roughly doubles over the six-year period, from an estimated 32 GW in 2026 to approximately 57 GW by 2031, requiring net additions of around 5 GW per year. That build rate demands a continuous auction pipeline and sustained project finance activity.
How does the 6.58% regulatory return affect project IRR for utility-scale solar in Spain?
The CNMC’s decision to raise the regulated financial return from 5.58% to 6.58% for the 2026-2031 period directly benefits transmission-connected solar projects with regulated revenue components. A higher allowed return reduces the discount rate applied to regulated cash flows, increasing their present value. As shown in the worked example above, a 100 basis point reduction in the discount rate increases the NPV of a €4 million annual regulated revenue stream over 25 years by approximately €3.1 million on a 100 MW project. For equity investors, this improvement in regulated cash flow NPV can lift project equity IRR by 50 to 100 basis points, depending on the proportion of revenue that is regulated versus merchant.
What is the main grid investment constraint on solar deployment in Spain?
Spain’s €13.6 billion grid investment plan for 2025-2030 allocates 75% to grid strengthening rather than new connection capacity, according to IEEFA. This means the transmission operator REE is prioritizing network reliability over expanding the number of injection points available to new solar projects. In practice, grid connection queue times in high-solar regions like Andalusia and Extremadura have reached 18 to 36 months, and curtailment rates during peak solar hours have been reported in the 3% to 8% range on constrained corridors. Developers must factor grid connection cost premiums of €15,000 to €40,000 per MW into project capex when modeling returns in these regions.
How does Spain’s auction framework compare to other European solar markets?
Spain’s REER auction mechanism awards long-term contracts through competitive bidding on a strike price per MWh, with recent solar rounds clearing in the €35 to €55 per MWh range. Portugal has achieved lower clearing prices (€18 to €25 per MWh) due to lower land costs and simpler permitting, while Italy and France have higher effective costs due to local content requirements and complex grid procedures. Spain sits in a middle position: strong irradiance and an established developer ecosystem, but increasing grid connection complexity. Spain does not impose local content requirements, which keeps EPC costs competitive and allows international supply chains.
What are the key financial modeling inputs for a utility-scale solar project in Spain in 2026?
A bankable financial model for a 100 MW Spanish utility-scale solar project should use the following key inputs: P50 capacity factor of 26% to 32% depending on location and tracker configuration; curtailment haircut of 3% to 8% in high-penetration regions; all-in capex of €550,000 to €750,000 per MW; operating costs of €12,000 to €18,000 per MW per year; auction strike price of €35 to €55 per MWh for contracted revenue; merchant price assumption of €45 to €55 per MWh in 2026 real terms with a capture price discount of 10% to 20%; and project finance debt at 70% leverage, 5.5% interest, 18-year tenor. These inputs produce equity IRR estimates in the 8% to 11% range for well-sited projects with secured grid connections.
What is the curtailment risk for utility-scale solar in Spain’s high-penetration regions?
Curtailment risk is a material financial variable for projects in Andalusia, Extremadura, and Castilla-La Mancha, where solar penetration is highest. During peak solar generation hours in 2024 and 2025, REE reported instances of negative wholesale prices and instructed curtailments on specific transmission corridors, particularly in Andalusia. Developers should apply a 3% to 8% annual energy yield haircut for curtailment in these regions. Mitigation strategies include co-located battery storage (shifting generation to evening hours), PPA structures with curtailment compensation clauses, and site selection favoring substations with lower congestion. The solar cannibalisation effect also depresses capture prices during peak hours, requiring a 10% to 20% discount to average pool prices in revenue models.
How large is the energy analytics market supporting utility-scale solar optimization?
The energy and utilities analytics market, which covers platforms for yield forecasting, auction bidding optimization, and asset performance monitoring, grows from USD 6.10 billion in 2026 to USD 10.10 billion by 2031 at a 10.6% CAGR, according to MarketsandMarkets. For utility-scale solar operators in Spain, analytics platforms can recover 1% to 3% of annual generation through early detection of underperformance from soiling, shading, or equipment degradation. On a 100 MW asset generating approximately €11 million in annual revenue, a 2% yield recovery adds roughly €220,000 per year in incremental revenue, improving equity returns over the project’s 25-year life by several hundred basis points on a cumulative basis.
Conclusion
Spain’s utility-scale solar market offers a well-defined investment thesis for the 2026-2031 period: a 10.09% capacity CAGR, a rising regulatory return floor at 6.58%, a government-mandated 81% renewable generation target by 2030, and a sustained auction pipeline. The grid investment bottleneck is real and requires careful site selection and connection strategy, but it also creates a durable competitive advantage for developers who secure grid rights early.
The financial case is strongest for transmission-connected projects in low-curtailment regions with long-term REER contracts, where the combination of regulated revenue stability and improving regulatory returns supports equity IRRs in the 8% to 11% range. Merchant exposure and curtailment risk are manageable with the right modeling assumptions and PPA structuring.
I recommend downloading the Spain Solar Energy Market Study 2026-2031 to access the full quantitative analysis, scenario modeling, and auction pipeline data needed to evaluate specific project opportunities across the study period. For project-level financial modeling, the EFM Solar Energy Financial Model provides a ready-to-use framework with built-in sensitivity analysis for grid connection costs, merchant exposure, and regulatory returns.
























































