
0 ITEMS

Three-Statement Model for Small Business Owners

Key Takeaways
- 82% of small businesses that fail cite cash-flow problems as a primary cause, making the cash flow statement the most critical of the three statements to build first.
- 78% of small employer firms already use income statements or balance sheets, but only 60% use cash-flow statements—closing that gap is the single biggest financial upgrade you can make.
- A three-statement model links your income statement, balance sheet, and cash flow statement so that every number checks against the others, eliminating errors that mislead lenders and investors.
- Monthly cadence beats annual for small businesses: seasonal swings, lumpy revenue, and owner draws make 12-month rolling projections far more useful than a single year-end snapshot.
- Owner compensation requires special handling—an owner’s draw (common in sole proprietorships and partnerships) does not appear on the income statement, while an owner salary (S-corps, LLCs taxed as S-corps) does.
- 73% of small employer firms use an external accountant; treat your three-statement model as a collaboration tool, not a replacement for professional advice.
- You can build a functional three-statement model in Excel in a single afternoon using a pre-built template—no accounting degree required.
Why Small Businesses Need a Three-Statement Model
A three-statement model gives you a complete, connected picture of your business finances—profit, assets, and cash—in one place. Without it, you’re flying with one instrument instead of three, and the one you’re missing is usually cash flow.
Small businesses are the backbone of the U.S. economy. In 2021, 99.8% of U.S. businesses—32.5 million out of 32.6 million—were small businesses with fewer than 500 employees (SBA Office of Advocacy, 2021). Those businesses employed 61.2 million people, accounting for 46.4% of the U.S. private-sector workforce (SBA Office of Advocacy, 2021). Yet only 40% of small business owners consider themselves very knowledgeable about accounting and finance, while 60% report meaningful gaps (National Small Business Association, 2018).
That knowledge gap is exactly why this guide exists. You don’t need a CFO title to build a three-statement model. You need a clear process, realistic numbers, and the right template.

60% of small business owners report gaps in financial knowledge—the three-statement model is the most practical tool to close that gap.
The Three-Statement Model Explained: What It Is and How It Differs for Small Business
A three-statement model (also called an integrated financial model) connects three core financial reports so that a change in one automatically flows through the others. The three statements are:
- Income Statement (also called Profit and Loss, or P&L): Shows revenue, costs, and net profit over a period.
- Balance Sheet: Shows what your business owns (assets), what it owes (liabilities), and what’s left for the owner (equity) at a specific point in time.
- Cash Flow Statement: Shows actual cash moving in and out of the business, reconciling the difference between accounting profit and real cash in your bank account.
For large corporations, these models run quarterly with dozens of line items per statement. For a small business with 1 to 50 employees, the adaptations are significant:
| Feature | Corporate Model | Small Business Model |
|---|---|---|
| Reporting cadence | Quarterly or annual | Monthly (12-month rolling) |
| Chart of accounts | 200+ line items | 20–40 simplified accounts |
| Owner compensation | Executive salary + bonus | Owner draw or S-corp salary |
| Accounting basis | Accrual (required) | Cash or accrual (your choice) |
| Fixed assets | Complex depreciation schedules | Simple straight-line, few assets |
| Equity section | Common stock, retained earnings | Owner equity, retained earnings |
| Audience | SEC, institutional investors | SBA lenders, local banks, angels |
The core mechanics are identical. The simplification is intentional and appropriate.
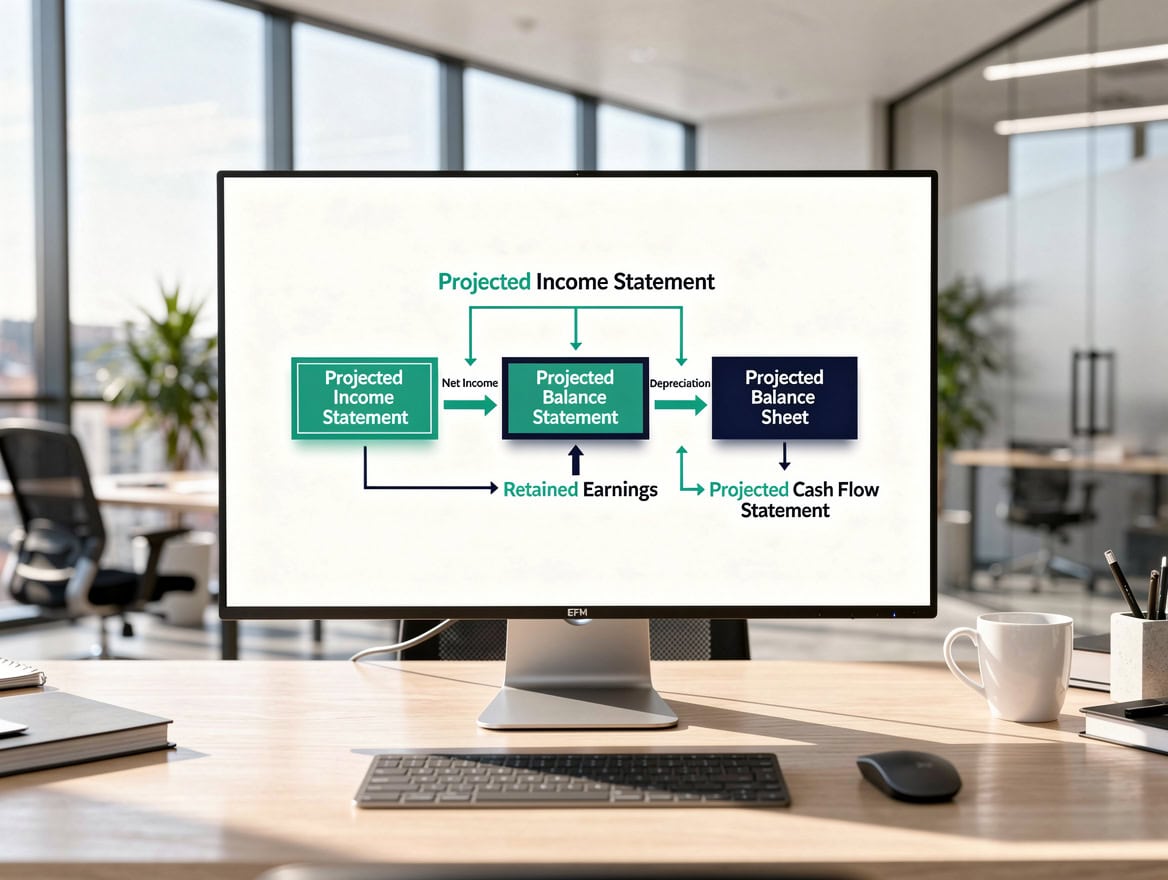
Small business models use the same mechanical structure as corporate models—just with 20 to 40 line items instead of hundreds.
Building Your Income Statement: Revenue, COGS, and Operating Expenses
The income statement is your starting point because every other statement depends on net income. Build it top-down: revenue first, then costs, then expenses, then profit.
Revenue: List every income stream separately. A restaurant might have dine-in, takeout, and catering. A consultant might have retainer clients and project fees. Separate lines let you spot which revenue source is growing or shrinking.
Cost of Goods Sold (COGS): COGS (the direct costs of producing your product or delivering your service) sits directly below revenue. For a product business, COGS includes materials, direct labor, and manufacturing overhead. For a service business, COGS typically includes subcontractors and direct labor hours billed to clients. Gross profit equals revenue minus COGS.
Gross Margin Benchmarks by Industry (use these to sanity-check your numbers):
- Retail: 25–50%
- Restaurant: 60–70% (food cost is 30–40% of revenue)
- Software/SaaS: 70–85%
- Professional services: 50–75%
- Construction: 15–25%
Operating Expenses: These are the costs of running the business that aren’t tied to a specific sale—rent, utilities, insurance, marketing, and administrative salaries. Subtract operating expenses from gross profit to get Operating Income (also called EBIT, or Earnings Before Interest and Taxes).
Owner Compensation: This is where small business income statements diverge from corporate ones. If you’re a sole proprietor or partnership, your personal draw does NOT appear on the income statement—it reduces owner equity on the balance sheet instead. If your business is an S-corporation or an LLC taxed as an S-corp, you pay yourself a reasonable salary that does appear as an operating expense. Get this right before showing the model to a lender.
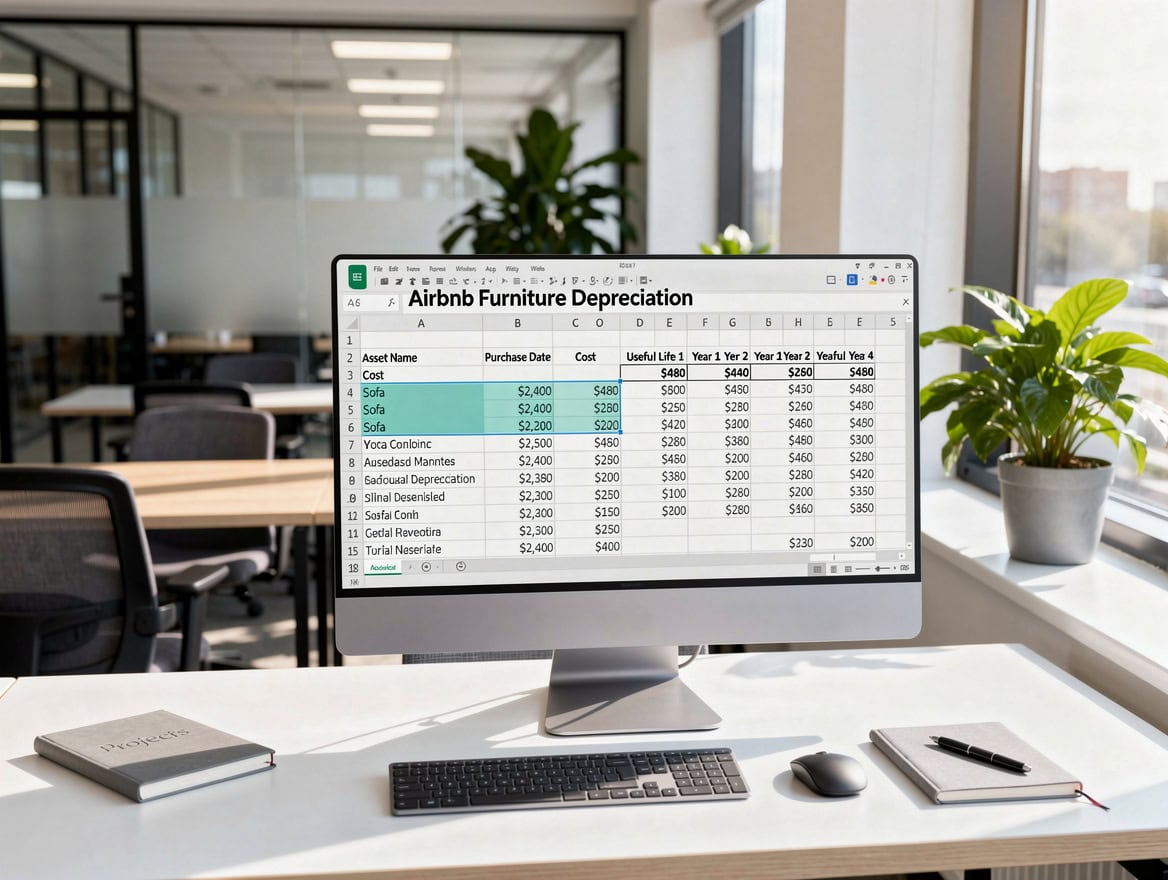
Depreciation: Depreciation (the annual accounting expense that spreads the cost of a long-lived asset like equipment or a vehicle over its useful life) appears as an operating expense on the income statement. A $12,000 piece of equipment depreciated straight-line over 5 years generates $2,400 per year in depreciation expense. This matters because depreciation reduces taxable profit but does not consume cash—a critical distinction for the cash flow statement. Under the IRS Modified Accelerated Cost Recovery System (MACRS), most small business equipment falls into recovery periods of 5 or 7 years (IRS Publication 946).
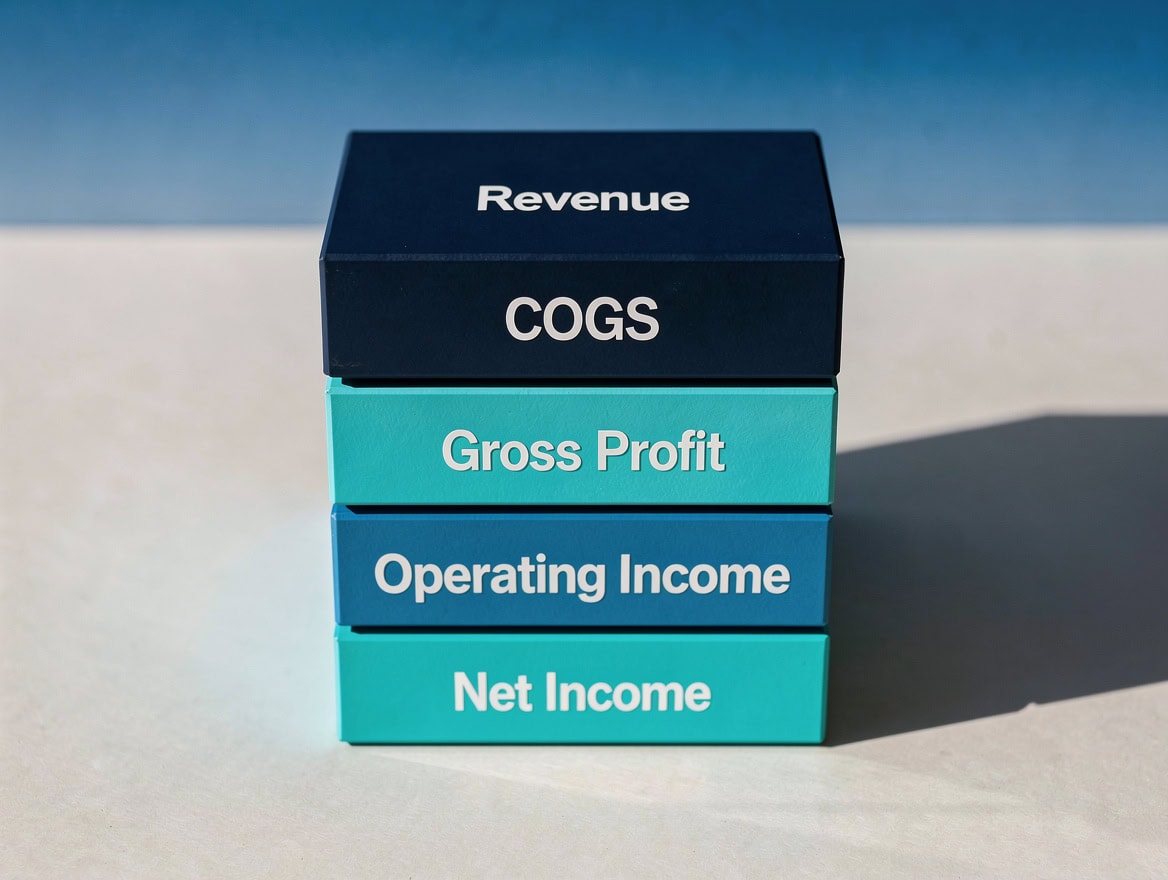
The income statement flows top-down: revenue minus costs equals profit. Gross margin benchmarks vary significantly by industry—know your target range.
Constructing the Balance Sheet: Assets, Liabilities, and Owner Equity
The balance sheet is a snapshot of your business’s financial position on a specific date—think of it as a photograph taken at month-end or year-end. It must always balance: Total Assets = Total Liabilities + Owner Equity.
Assets split into two categories:
- Current assets (converted to cash within 12 months): cash, accounts receivable (money customers owe you), inventory, and prepaid expenses.
- Fixed assets (long-term): equipment, vehicles, leasehold improvements—listed at cost minus accumulated depreciation.
Liabilities also split into two categories:
- Current liabilities (due within 12 months): accounts payable (money you owe suppliers), accrued expenses, short-term loan payments, and deferred revenue (cash received for services not yet delivered).
- Long-term liabilities: equipment loans, SBA loans, and commercial mortgages with terms beyond one year.
Owner Equity: For a small business, this section typically shows the owner’s initial capital contribution plus retained earnings (cumulative net income minus cumulative draws or dividends). The retained earnings line is the mechanical link between your income statement and your balance sheet.
Key Balance Sheet Ratios for Small Businesses:
- Current Ratio = Current Assets / Current Liabilities. A ratio above 1.5 signals healthy short-term liquidity. SBA lenders typically want to see 1.2 or higher.
- Days Sales Outstanding (DSO) = (Accounts Receivable / Annual Revenue) × 365. A DSO above 45 days for a service business signals a collections problem.
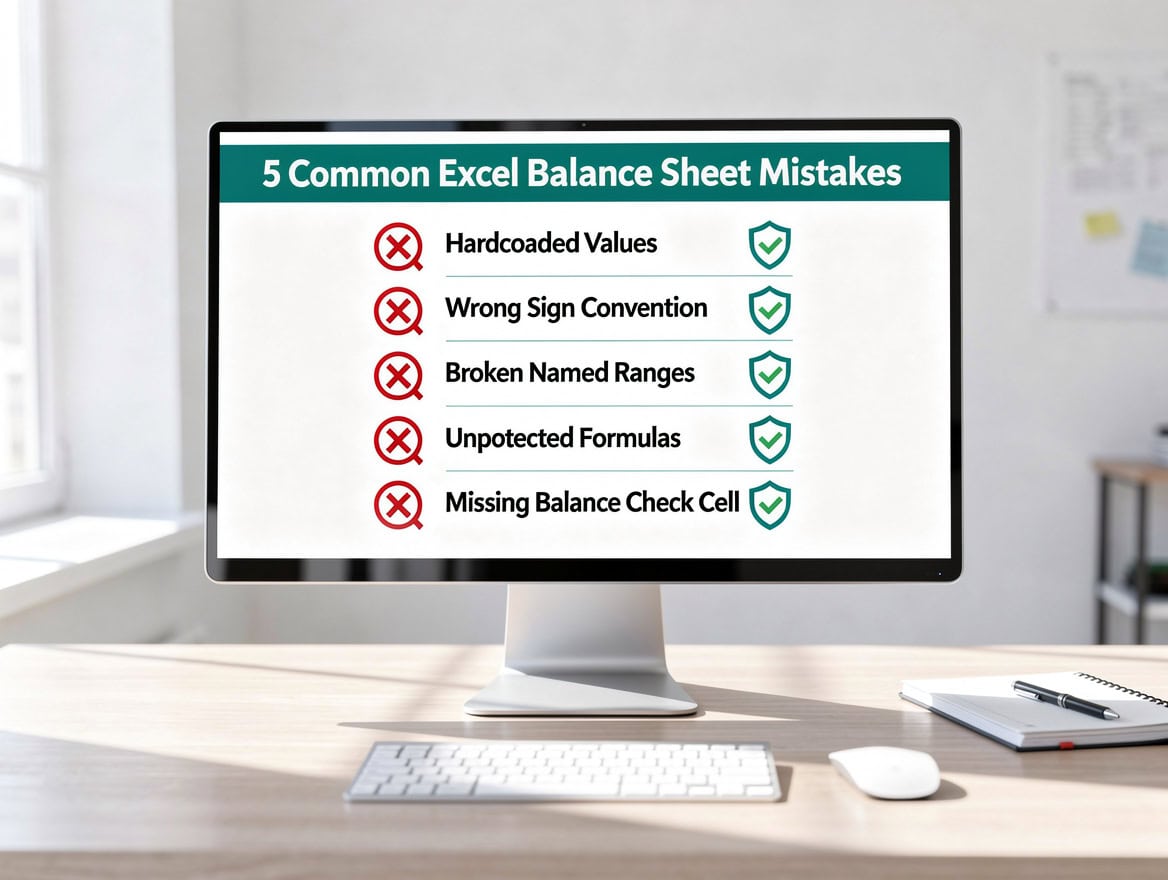
The balance sheet must always balance: Total Assets = Total Liabilities + Owner Equity. A mismatch signals a formula error in your model.
The Cash Flow Statement: Why 82% of Failures Are Cash-Flow Related
The cash flow statement is the most important statement for a small business owner to understand, and the most commonly skipped. Among small employer firms, 78% used income statements or balance sheets in 2020, but only 60% used cash-flow statements (Federal Reserve Small Business Credit Survey, 2020). That 18-point gap is dangerous: 82% of small businesses that fail cite cash-flow problems as a primary contributing factor (SCORE Small Business Cash Flow Report, 2019).
You can be profitable on paper and still run out of cash. A consulting firm that invoices $50,000 in March but doesn’t collect until June has a profitable income statement and an empty bank account. The cash flow statement reveals that gap.
The Indirect Method (the standard approach for small businesses) starts with net income from the income statement and adjusts for non-cash items and working capital changes:
- Start with Net Income
- Add back Depreciation (non-cash expense that reduced profit but not cash)
- Subtract increases in Accounts Receivable (you earned revenue but haven’t collected cash yet)
- Add increases in Accounts Payable (you incurred expenses but haven’t paid cash yet)
- Subtract increases in Inventory (you spent cash to build stock not yet sold)
- The result is Cash from Operations
- Add or subtract cash spent on equipment purchases or sales: Cash from Investing
- Add loan proceeds, subtract loan repayments and owner draws: Cash from Financing
- Sum all three sections to get Net Change in Cash, which reconciles to your ending bank balance.
The indirect method starts with net income and adjusts for non-cash items and working capital changes to arrive at actual cash generated.
Linking the Three Statements: The Mechanical Connections
The power of a three-statement model comes from its links. Change one number and the model updates everywhere. Here are the four critical connections:
Link 1: Net Income to Retained Earnings
Closing Retained Earnings = Opening Retained Earnings + Net Income − Owner Draws (or Dividends)
Net income flows from the bottom of the income statement into the equity section of the balance sheet.
Link 2: Depreciation Flows Through All Three
Depreciation appears as an expense on the income statement (reducing net income), reduces the net book value of fixed assets on the balance sheet (via accumulated depreciation), and gets added back on the cash flow statement (because it’s non-cash).
Link 3: Working Capital Changes Connect Balance Sheet to Cash Flow
Working capital (current assets minus current liabilities) changes each month. An increase in accounts receivable means you recognized revenue but haven’t collected cash—so it reduces cash from operations. An increase in accounts payable means you incurred costs but haven’t paid—so it increases cash from operations.
Link 4: Ending Cash Ties to the Balance Sheet
The ending cash balance calculated at the bottom of the cash flow statement must equal the cash line on the balance sheet for the same date. If these two numbers don’t match, there’s an error somewhere in the model.
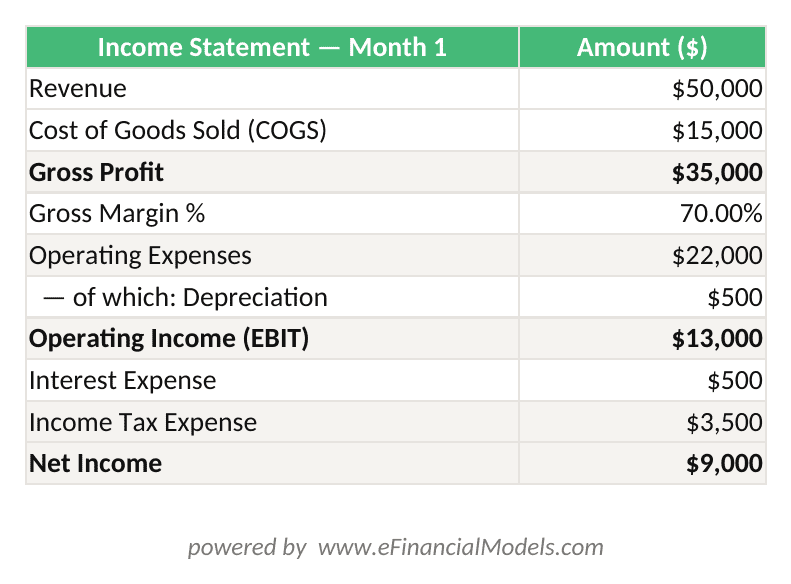
A single-month three-statement model for a $50,000-revenue service business. Net income of $8,500 flows to retained earnings; depreciation of $500 adds back on the cash flow statement; ending cash of $6,000 ties to the balance sheet.
Four links connect the three statements: net income to retained earnings, depreciation through all three, working capital to cash flow, and ending cash to the balance sheet.
Practical Tools and Implementation: Excel, QuickBooks, and Your Accountant
You have three realistic options for building your three-statement model, and they work best in combination.
Excel or Google Sheets: The most flexible option and the most common. Among small businesses not using full accounting platforms, Excel is the primary or supplemental tool for the majority (SBA Office of Advocacy, 2020). A well-structured Excel financial model uses separate tabs for each statement, with formulas linking them. Excel supports up to 64 levels of nested functions (Microsoft), which is far more than any small business model will ever require. Color-code your inputs (blue font) and formulas (black font) so you and your accountant can navigate the model quickly.
QuickBooks or Xero: Among small businesses with employees, 69% used accounting software to manage their books in 2020 (SBA Office of Advocacy, 2020). These platforms generate historical income statements and balance sheets automatically. Export that data monthly and paste it into your Excel model as the actuals layer. Then build your forward projections on top.
Your External Accountant: 73% of small employer firms used an external accountant or financial professional in 2019 (Federal Reserve Small Business Credit Survey, 2019). Your accountant is not a replacement for your model—they’re your model’s best reviewer. Share the Excel file monthly. Ask them to flag any line item that doesn’t match your tax basis. This collaboration catches errors before a lender does.
For startup financial models and early-stage businesses, a pre-built template with instructions saves 10 to 15 hours of setup time and eliminates formula-linking errors that are easy to make and hard to find.
The best implementation combines QuickBooks for actuals, Excel for projections, and your accountant for review—73% of small businesses already use external financial professionals.
Use Cases: Loan Applications, Investor Pitches, and Monthly Reviews
A three-statement model serves different audiences depending on your goal.
SBA Loan Applications: The SBA requires 3 years of historical financial statements plus 2 to 3 years of forward projections for most 7(a) and 504 loan applications. Lenders use your balance sheet to calculate your debt-service coverage ratio (DSCR = Net Operating Income / Total Debt Service). A DSCR above 1.25 is the standard minimum. Your three-statement model, built correctly, produces this ratio automatically.
Investor Pitches: Angel investors and small business-focused VCs want to see a 12-month monthly model and a 3-year annual summary. They focus on gross margin trajectory, burn rate (monthly cash consumption), and the month you reach cash-flow breakeven. A business valuation built on top of your three-statement model using a DCF approach gives investors the exit math they need.
Monthly Financial Reviews: Use your model as a budget-vs-actual tracker. Lock in your projections at the start of the year. Each month, paste in actuals from QuickBooks and let the variance column highlight where you’re off track. A 10% or greater variance in any line item warrants a conversation with your accountant.
Identifying Cash Crunches Early: Model your accounts receivable aging. If you have $80,000 in outstanding invoices with 45-day payment terms and payroll hits in 10 days, your cash flow statement will show the shortfall before it becomes a crisis. This is the model’s highest-value function for most small business owners.
A three-statement model serves four distinct audiences: SBA lenders, investors, your own monthly review process, and your early-warning cash management system.
Common Small Business Adjustments: Owner Compensation, Tax Treatment, and Seasonal Variations
Three adjustments trip up most first-time small business modelers.
Mistake 1: Treating Owner Draws as an Expense
Owner draws reduce equity, not profit. If you run a sole proprietorship and pay yourself $5,000 per month, that $5,000 does not appear on your income statement. It appears as a reduction in owner equity on the balance sheet and as a cash outflow in the financing section of the cash flow statement. Putting it on the income statement overstates your costs and understates your profit.
Mistake 2: Ignoring Accrual vs. Cash Accounting Differences
Cash accounting records revenue when cash is received and expenses when cash is paid. Accrual accounting records revenue when earned and expenses when incurred, regardless of cash timing. Most lenders and investors expect accrual-basis statements. If your QuickBooks is set to cash basis, ask your accountant to provide accrual adjustments before you build your model.
Mistake 3: Flat Monthly Revenue Projections
A retail business that does 40% of annual revenue in November and December will show a false cash surplus in Q3 and a false crisis in Q1 if you model revenue as a flat monthly amount. Build a seasonality row into your income statement: assign a percentage weight to each month (they must sum to 100%) and multiply annual revenue by that weight. This single adjustment makes your cash flow projections dramatically more accurate.
Mistake 4: Forgetting Loan Principal Repayments
Loan interest appears on the income statement as an expense. Loan principal repayments do NOT—they appear only on the cash flow statement (financing section) and reduce the loan balance on the balance sheet. Many small business owners model only the interest and wonder why their cash balance keeps dropping faster than expected.
Mistake 5: Not Reconciling the Balance Sheet
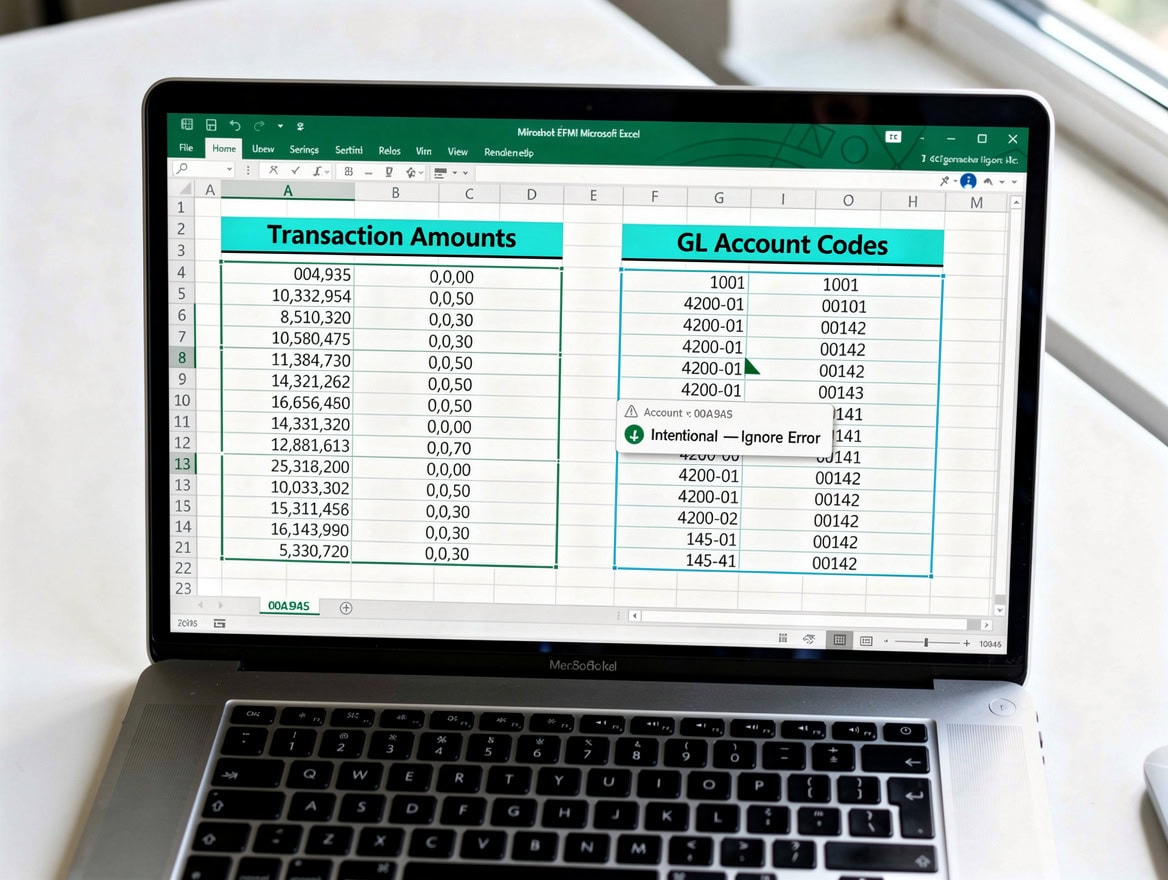
If your balance sheet doesn’t balance (Total Assets ≠ Total Liabilities + Equity), there’s a formula error somewhere. Build a reconciliation check cell that calculates Assets minus Liabilities minus Equity. If it shows anything other than zero, stop and find the error before sharing the model with anyone. A single Excel workbook can contain up to 255 sheets (Microsoft), giving you ample room to dedicate separate tabs to each statement, assumptions, and reconciliation checks without any structural constraints.
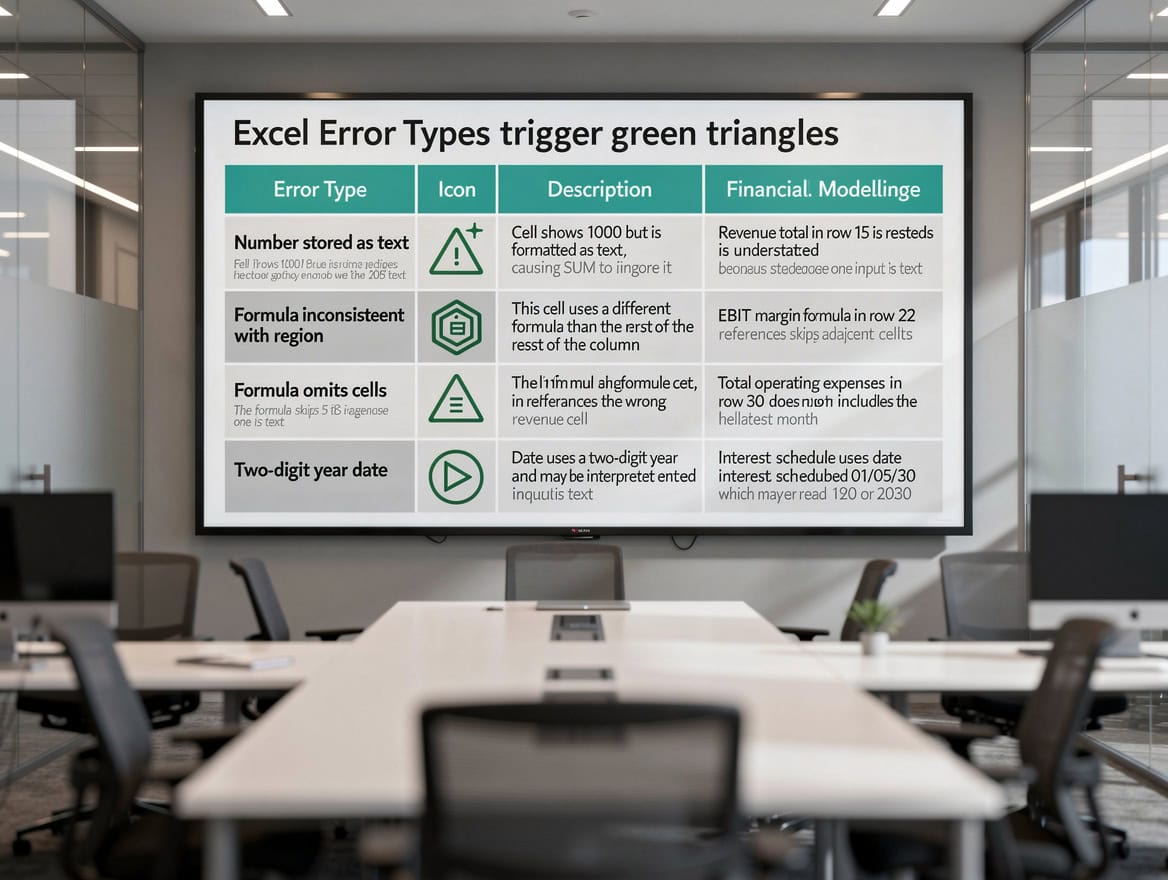
Five mistakes account for the majority of errors in small business three-statement models—each has a straightforward fix once you know what to look for.
Frequently Asked Questions
Do I really need all three statements, or can I just use a P&L?
A P&L (income statement) alone tells you whether you’re profitable, but it can’t tell you whether you’ll have cash next month or whether your business is solvent. The balance sheet shows what you own and owe at a point in time, and the cash flow statement shows whether profit is converting to actual cash. SBA lenders require all three for loan applications, and any investor worth working with will ask for all three. Building just a P&L is like navigating with a map that only shows roads—you’re missing terrain and weather. The three statements together take roughly the same time to build as a standalone P&L once you have a linked template.
How far forward should I project my three-statement model?
For most small businesses, a 12-month monthly projection is the minimum useful horizon. SBA loan applications typically require 2 to 3 years of forward projections, with the first year monthly and years 2 and 3 annual. For investor pitches, a 3-year monthly model is standard for early-stage businesses. Beyond 3 years, projection accuracy drops significantly for small businesses with variable revenue. Build your 12-month model first, then extend it annually. Use conservative revenue assumptions (10 to 15% below your best-case estimate) and realistic expense growth (3 to 5% annually for most cost categories).
What’s the difference between cash and accrual accounting, and which should I use for my model?
Cash accounting records transactions when cash changes hands. Accrual accounting records revenue when earned and expenses when incurred, even if cash hasn’t moved yet. A service business that invoices $20,000 in March and collects in May records $20,000 revenue in March under accrual and $0 in March under cash. Most lenders and investors require accrual-basis statements because they give a more accurate picture of business performance. If your books are on cash basis (common for small businesses under $25 million in revenue, per IRS rules), your accountant can prepare an accrual adjustment. Build your model on accrual and use the cash flow statement to track actual cash timing.
How do I handle inventory in my three-statement model?
Inventory appears as a current asset on the balance sheet. When you purchase inventory, cash decreases and inventory increases—no income statement impact yet. When you sell inventory, two things happen simultaneously: revenue appears on the income statement, and the cost of that inventory moves from the balance sheet (inventory) to the income statement (COGS). This is why inventory changes appear as a working capital adjustment on the cash flow statement. For a product business carrying $30,000 in inventory, a 20% increase in stock (adding $6,000) reduces cash from operations by $6,000 even if your profit is unchanged. Track inventory turns (COGS / Average Inventory) monthly—a ratio below 4 for most product businesses signals excess stock tying up cash.
Can I build this model in Excel without accounting software?
Yes. Excel is fully capable of handling a three-statement model for a business with up to 50 employees and 40 line items per statement. The key is structure: use one tab per statement, one tab for assumptions (revenue growth rate, payment terms, depreciation schedules), and one summary tab. All formulas should reference the assumptions tab so you can run scenarios by changing one number. Color-code inputs in blue and formulas in black. Protect formula cells to prevent accidental overwrites. A pre-built Excel financial model template with these conventions already in place saves significant setup time and reduces linking errors. If you later adopt QuickBooks or Xero, export your actuals monthly and paste them into the actuals columns of your Excel model.
What financial ratios should I track from my three-statement model?
Five ratios cover most small business monitoring needs. Current Ratio (Current Assets / Current Liabilities) should stay above 1.2 for lender comfort. Gross Margin (Gross Profit / Revenue) should be benchmarked against your industry—a restaurant below 60% gross margin has a food cost problem. Debt-Service Coverage Ratio (Net Operating Income / Annual Debt Payments) should exceed 1.25 for SBA loan eligibility. Days Sales Outstanding (Accounts Receivable / Revenue × 365) should stay below 45 days for service businesses. Operating Cash Flow Margin (Cash from Operations / Revenue) should be positive and growing—this is the ratio that most directly predicts business survival. Build these five ratios into a dashboard tab in your Excel model and review them monthly.
How do I use my three-statement model to prepare for an SBA loan?
SBA 7(a) and 504 loan applications require 3 years of historical financial statements (tax returns and accountant-prepared statements are both acceptable) plus 2 to 3 years of forward projections. Your three-statement model satisfies the projection requirement. Lenders will calculate your DSCR from your projected income statement and verify it against your balance sheet debt levels. They’ll also check your current ratio and look for any months where projected cash drops below zero—a red flag that triggers questions. Present your model with a one-page assumptions summary explaining your revenue growth rate, key cost drivers, and any planned capital expenditures. A model that clearly shows your assumptions is far more credible than one that just shows numbers.
Building Your First Three-Statement Model This Month
A three-statement model is not a corporate finance luxury. It’s the minimum viable financial tool for any small business that wants to survive a cash crunch, qualify for an SBA loan, or present credibly to an investor. The math is straightforward. The structure is learnable in an afternoon. The payoff is a complete, connected view of your business finances that catches problems before they become crises.
Start with your income statement using last month’s actuals from QuickBooks or your bank statements. Build the balance sheet from your most recent tax return. Construct the cash flow statement using the indirect method outlined above. Check that your balance sheet balances and that ending cash matches your bank statement. Then project forward 12 months using realistic assumptions.
I recommend downloading the EFM Small Business Three-Statement Model template to get started—it’s pre-built with linked formulas, color-coded inputs, a seasonality adjustment row, and instructions written specifically for businesses with 1 to 50 employees. Your accountant will thank you for showing up with a structured model instead of a shoebox of receipts.

























































