
0 ITEMS

Utility-Scale Solar PV Model | P50 Bias & Debt Sizing
Excel financial model for solar developers, IPPs and lenders, to size project debt the way a bank does and then test it against what plants actually produce. US fleets run 8.60% below their own P50 – more than the 6.92% the lender takes off in its adverse case. 10 sheets, 35-year cash flows, sculpted debt, ITC with credit transfer, 5-year MACRS.
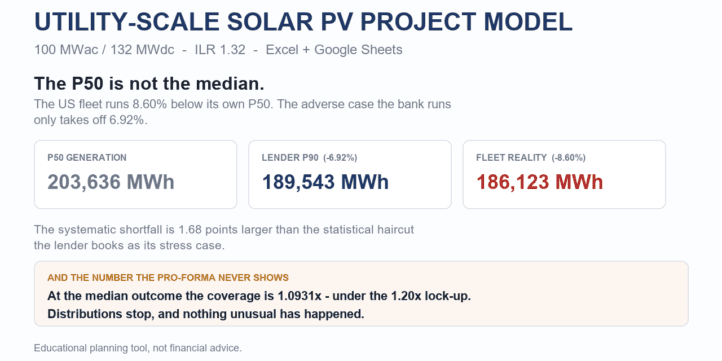


Contracted solar debt is sized on the P50, not the P90 – and the P50 itself is optimistic.
Lenders size contracted solar against a single constraint: a DSCR floor of 1.25-1.30x on the P50. The P99 test sits at 1.00x and rarely binds. Most models get that convention wrong. But the convention is not where the risk is.
Measured against their own P50, US plants come in 8.60% short. That figure is weather-adjusted, drawn from tens of thousands of system-months, and corroborated by a national-laboratory first-year performance index of 0.929 and by observed availability of 96.4-97.2% against the 99% every pro forma assumes. It is larger than the 6.92% haircut the bank applies as its adverse case.
So on the same loan, on the same 100 MWac plant:
- As sized (P50): minimum DSCR 1.30x, exactly at the floor. The pro forma.
- Lender stress (P90): 1.1335x. The bank adverse case.
- Observed fleet median: 1.0931x – below the bank own stress case, and below a 1.20x distribution lock-up, with nothing unusual having happened.
Priced as debt: 49,013,364 advanced against 42,621,546 that the observed median supports – 6,391,818 of over-lending, 13.0% of the advance, and 7.2% more equity than the pro forma asked for.
What is in the engine. Bias and variability are kept apart: the P90 prices variability, the fleet index prices bias, and applying a percentile to a shifted distribution hides the shift instead of correcting it. Set the index to 100% and the over-lending figure collapses to 0.00 exactly – a check that ships with the model. Debt service is sculpted: each year the payment follows that year cash flow, so coverage sits at the floor for the life of the loan, the way project finance actually sizes. A level annuity against a declining generation profile forces you to size on the worst year and under-finances the project.
Conventions corrected, and sourced. PPA prices are flat nominal – the 1-3% escalator is a residential convention and over 15 years is worth about 16% of levelised revenue. System degradation is 1.3% a year for plants above 25 MWac, not the 0.5% module figure. The merchant capture rate is 83% and falling. Availability is left at 100% on purpose, because the observed shortfall is already inside the fleet index and lowering it would double-count.
Tax attributes, because in solar they are half the return: a 30% ITC with a transfer discount, the standard 50%-of-credit basis reduction, 5-year MACRS and a 21% federal rate. The ITC is cash received in year 1, not a discount on the equity cheque at closing.
Three revenue structures reload the whole model: 20-year PPA (1.30x floor, 18-year tenor), 12-year PPA plus merchant tail (1.30x, 12), merchant or hedge (1.75x, 7). The tenor never exceeds the contract.
Base case (fully editable): 100 MWac / 132 MWdc, P50 capacity factor 24.33%, year-1 generation 203,636 MWh at P50 against 186,123 MWh at the observed median, total cost 138.0M, net ITC 38.5M, PPA 49.00/MWh flat for 20 years, leverage 35.5%, equity IRR 2.87% as sized and 0.90% at the median, and 25.7M of revenue the pro forma counts and the fleet does not produce. Yes, 2.87% is thin, and it was left there: the default PPA is the 25th-percentile offer price paired with the cheapest region capex, and nudging inputs until it looked better would defeat the purpose.
Verified, not asserted: 49 checks across three engines – structure, real Excel recalculation on every variant with zero error cells, and Google Sheets compatibility – including four logic proofs and three that test the thesis itself.
What it is not. State income taxes, tax-equity partnership flips, DSRA sizing, terminal value and pre-NTP development costs are not modelled. Early-year tax losses are assumed monetised. Defaults are declared model inputs with stated ranges, not certified benchmarks. There are dozens of solar models on the market; this is not the first of anything. It is the one that corrects the P50 with what the fleet actually produces.
Educational planning tool. Not financial, tax, legal or investment advice.
Similar ProductsOther customers were also interested in...



 eFinancialModels
Electric Vehicle (EV) Charging Station Financial M...
With this comprehensive 5- or 10-year monthly tool, investors can assess the viability of setting up... Read more

Financial Model for Mobile App | Mobile App Busine...
The Mobile App Financial Plan Template in Excel allows you to develop financial projections when lau... Read more

 HenrySheykin
Food Truck Financial Model Excel Template
The Food Truck Financial Model helps entrepreneurs, founders, business owners, consultants, and anal... Read more

Green Hydrogen Production from Wind Energy Financi...
The Green Hydrogen from Wind Financial Model aims to comprehensively forecast a horizon of 40 years ... Read more

Simple Mutual Non-Disclosure Agreement Template
Protect your business secrets with ease using our Simple Mutual Non-Disclosure Agreement Template. S... Read more

Solar Energy Financial Model
The Solar Energy Financial Model Spreadsheet Template in Excel assists you in preparing a sophistica... Read more

 Peter Graf
The Customer-Centric Financial Model for Restauran...
Starting a restaurant without a financial plan is like driving a car blindfolded. You wouldn´t do i... Read more
You must log in to submit a review.