
0 ITEMS

Tailor Financial Model Excel Template
The Tailor Shop Financial Model helps entrepreneurs, business owners, consultants, and analysts turn a tailoring business idea into a structured financial forecast. Instead of building spreadsheets from scratch, users can work from a ready-to-use model designed around the realities of a tailor shop, including alterations, repairs, custom tailoring, retail accessories, customer visits, service pricing, staffing needs, supply costs, rent, equipment, and launch investment. It gives users a practical way to estimate revenue potential, startup costs, operating expenses, payroll, cash flow, profitability, and funding needs before opening, expanding, or presenting the business to stakeholders. This financial model template is useful for anyone preparing a tailoring business plan, loan application, investor pitch, internal budget, or operational forecast. The model connects core assumptions such as daily customer traffic, service mix, average order value, pricing, cost of goods sold, employee wages, overhead, and growth expectations with projected financial statements. Users can adjust the editable assumptions to reflect their own location, shop size, pricing strategy, service offering, and growth plan, making the forecast more relevant than a generic small business spreadsheet. The template supports financial planning and decision-making by showing how changes in revenue assumptions, startup capital, operating expenses, and payroll affect cash flow and profitability over time. It helps users understand whether the tailor shop can cover fixed costs, when it may reach break-even, how much cash should be available during the launch phase, and which services contribute most to performance. This is especially valuable for founders who need to test their business model before committing to leases, equipment purchases, hiring, or marketing spend. With pre-built formulas, investor-ready formatting, and compatibility with Excel and Google Sheets, the Tailor Shop Financial Model is designed to save time while still offering detailed financial insight. Users can review scenario outcomes, analyze revenue streams, prepare lender-friendly reports, evaluate profitability, and present key metrics with greater confidence. Whether the goal is to open a new alterations shop, add custom tailoring services, expand an existing sewing business, or prepare professional funding documents, this template provides a clear framework for planning, budgeting, and smarter financial decisions.
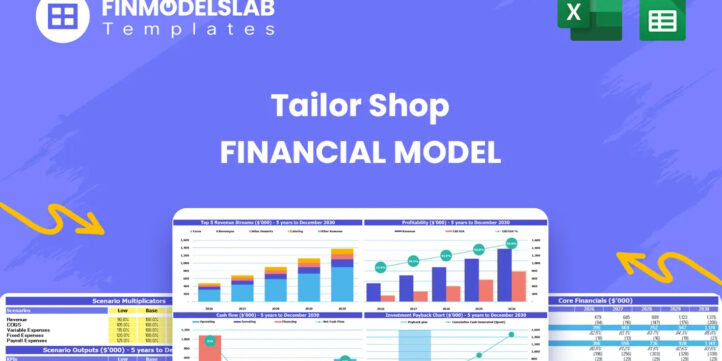


Financial Model Overview
The Tailor Shop Financial Model is a ready-to-use financial model template built for planning, launching, managing, or expanding a tailoring business. It is designed around the economics of a tailor shop, where revenue may come from alteration services, garment repairs, custom tailoring, and retail accessory sales, while costs may include fabric and notions, payroll, rent, equipment, marketing, utilities, and shop build-out expenses. The template gives entrepreneurs, business owners, consultants, and analysts a structured way to estimate revenue, startup investment, operating expenses, cash flow, profitability, and funding requirements without having to create a complex spreadsheet from the ground up.
With editable assumptions and automated calculations, users can customize the model to reflect their own pricing, customer volume, service mix, staffing plan, and local cost structure. This makes the template useful for business plans, investor discussions, loan applications, internal budgeting, and day-to-day decision-making.
All-in-One Dashboard
The all-in-one dashboard brings the most important inputs and outputs into a single, easy-to-review area so users can quickly understand the financial direction of the tailor shop. This component is designed to connect core assumptions such as daily customer visits, average service pricing, revenue mix, staffing levels, operating costs, capital expenditures, and financing assumptions with high-level outputs such as total revenue, gross profit, EBITDA, net income, ending cash balance, and return metrics.
Instead of searching across multiple worksheets to understand performance, users can review the overall forecast from one central view and identify the assumptions that have the greatest impact on results. For a tailor shop, this is especially helpful because small changes in customer traffic, average order value, labor utilization, and material costs can meaningfully affect margins.
The dashboard supports faster planning and decision-making by showing whether the business model is financially viable, whether the projected cash position is strong enough, and whether the shop is moving toward sustainable profitability. It is also useful for presenting the business to partners, lenders, or investors because it summarizes the financial story in a clear and professional format.
Low, Base, and High Scenario Analysis
The low, base, and high scenario analysis component allows users to test how the tailor shop could perform under different business conditions. The base case may represent the expected operating plan, while the low case can reflect slower customer growth, lower pricing, weaker retail sales, higher payroll, or increased overhead, and the high case can reflect stronger demand, better pricing power, improved service mix, or faster expansion.
This section typically uses inputs such as daily visits, average transaction value, service category mix, cost of goods sold, payroll assumptions, rent, marketing spend, and growth rates to generate alternative revenue, profit, and cash flow outcomes. Scenario analysis is valuable because tailor shops often depend on local demand, repeat customers, reputation, walk-in traffic, partnerships with boutiques, and seasonal service patterns.
By comparing different cases, users can understand the downside risk of opening the shop, the upside potential of strong execution, and the level of cash buffer needed if ramp-up takes longer than expected. This component helps business owners and planners make more resilient decisions, prepare contingency plans, and communicate a more credible forecast to stakeholders who want to see more than a single optimistic projection.
Professional Charts and Visual Reports
The professional charts and visual reports component turns the financial forecast into presentation-ready visuals that make key trends easier to understand. This section may include charts for revenue growth, profitability, cash flow, expense categories, service mix, margin progression, and cumulative investment recovery.
For a tailor shop, these visuals help show how income from alterations, repairs, custom garments, and retail sales develops over time, how operating costs scale as the shop grows, and how the business moves from launch investment to operating stability. The inputs behind these charts are driven by the model’s assumptions and financial statements, while the outputs create a visual summary that can be used in pitch decks, business plans, management meetings, and funding discussions.
Visual reporting is important because lenders, investors, and partners often need to understand the financial plan quickly, without reviewing every formula or worksheet. Clear charts can highlight whether revenue is growing steadily, whether margins are improving, whether cash flow becomes positive, and whether the business can support future expansion. This component makes the Tailor Shop Financial Model more useful not only as an analytical tool, but also as a communication tool for explaining the business case professionally.
ROE Components and DuPont Analysis
The ROE components and DuPont analysis section helps users understand the drivers behind return on equity rather than looking only at a single headline return metric. This component typically breaks return on equity into operating profitability, asset efficiency, and financial leverage, allowing users to see whether returns are being created through healthy margins, efficient use of assets, or the amount of debt and equity used to finance the business.
For a tailor shop, this can be particularly useful because the business may require upfront investment in sewing machines, pressing equipment, shop build-out, inventory, and working capital, while long-term returns depend on repeat customers, service margins, labor productivity, and capacity utilization. Inputs may include net income, total revenue, total assets, equity funding, debt financing, and balance sheet values, while outputs show how each factor contributes to overall equity performance.
This component is useful for investors and owners because it provides a deeper view of financial quality. A tailor shop that generates strong returns from efficient operations and steady margins may be more attractive than one relying heavily on leverage. DuPont analysis also helps users identify which levers to improve, such as increasing average revenue per visit, reducing material waste, improving staff productivity, or managing asset purchases more carefully.
Revenue Inputs and Assumptions
The revenue inputs and assumptions section is where users define the commercial engine of the tailor shop. This component allows the model to forecast sales based on practical drivers such as daily customer visits, operating days, average order value, service pricing, sales mix, growth rates, repeat customer behavior, and revenue categories. A tailor shop may generate income from basic alterations, hemming, resizing, zipper replacement, garment repairs, custom tailoring, wedding and formalwear adjustments, and retail sales of accessories such as buttons, threads, garment bags, or care products.
By separating these assumptions, users can build a more realistic forecast than a simple top-down revenue estimate. The section may include researched starting assumptions that can be edited to reflect the user’s own city, positioning, service quality, target customers, and marketing strategy. Outputs from this section flow into monthly and annual revenue projections, gross profit calculations, cash flow forecasts, and profitability summaries. This component is useful because it forces users to think through the actual sources of revenue and the operating capacity of the business. It helps answer whether the shop needs more walk-in customers, higher-value custom work, stronger retail upsells, or better pricing in order to cover costs and achieve the desired profit level.
Bank-Ready Financial Reports
The bank-ready financial reports component produces structured financial outputs that are suitable for lenders, investors, grant reviewers, and other stakeholders who need to evaluate the business professionally. This section typically includes projected income statements, cash flow statements, balance sheets, and supporting schedules that organize the forecast into a familiar financial reporting format.
For a tailor shop seeking funding, these reports can help explain how much capital is needed, how the funds will be used, how revenue is expected to grow, when the business may become profitable, and whether future cash flow can support loan repayments or owner returns. Inputs from revenue assumptions, startup costs, operating expenses, payroll, financing, taxes, and working capital flow into these statements automatically, reducing the time required to prepare formal financial documents.
This component is useful because many business plans fail to provide a complete financial picture. A lender may want to see projected cash flow, not just sales potential, while an investor may want to understand margins, capital efficiency, and payback timing. By providing clean and organized financial reports, the Tailor Shop Financial Model helps users present a more credible, complete, and decision-ready forecast.
Revenue Breakdown by Stream
The revenue breakdown by stream component gives users a detailed view of how each service category contributes to total sales. Instead of treating the tailor shop as one single revenue line, this section separates income sources such as alteration services, garment repair services, custom tailoring, and retail accessory sales. Each stream can be driven by its own assumptions, including pricing, customer mix, job volume, purchase frequency, and growth rate.
This is useful because different tailoring services can have very different economics. Basic alterations may generate frequent recurring jobs with relatively predictable demand, custom tailoring may produce higher ticket values but require more labor and longer completion times, repairs may support steady local traffic, and retail sales may improve average revenue per customer without requiring as much service labor. Outputs may include monthly revenue by category, annual revenue by stream, percentage contribution to total sales, and changes in sales mix over time.
This component helps users identify which services are most important to profitability and where marketing or operational focus should be placed. It also supports pricing decisions, capacity planning, and expansion strategy by showing whether growth is coming from high-margin work, volume-based services, or add-on sales.
KPI Dashboard and Industry Benchmarks
The KPI dashboard and industry benchmark component helps users evaluate performance using the metrics that matter most for a tailor shop. This section may track revenue growth, gross margin, EBITDA margin, net profit margin, average revenue per visit, customer volume, payroll as a percentage of revenue, cost of goods sold, operating expense ratio, cash balance, payback period, and return measures. It may also allow users to compare projected performance against industry standards or practical benchmarks for similar service businesses.
For a tailoring business, benchmarks are useful because they help users test whether assumptions are realistic. If payroll is too high relative to revenue, pricing may need to increase or staffing may need to be adjusted. If material costs are too high, the owner may need better supplier terms, tighter inventory control, or improved job costing. If average revenue per customer is too low, the shop may need stronger upselling, premium services, or better promotion of custom tailoring. The KPI dashboard turns the forecast into a management tool by highlighting whether the business is operating efficiently, where performance is improving, and where corrective action may be needed. It also helps stakeholders quickly understand the health of the business without reviewing every detailed worksheet.
Startup Costs and Operating Expense Planning
The startup costs and operating expense planning component helps users estimate both the upfront investment required to launch the tailor shop and the recurring expenses needed to keep it running. Startup costs may include shop build-out, lease deposits, industrial sewing machines, overlock machines, pressing equipment, cutting tables, mirrors, fitting rooms, signage, licenses, initial inventory, website setup, point-of-sale tools, and pre-opening marketing. Operating expenses may include rent, utilities, insurance, wages, payroll taxes, cleaning, software, repairs and maintenance, marketing, professional services, supplies, and other overhead.
This section uses editable cost assumptions to calculate total funding needs before launch and expected monthly cost levels after opening. The outputs help users understand how much cash is required before the first customer is served, what fixed cost burden the business must cover each month, and how expenses scale over the forecast period. For entrepreneurs, this component reduces the risk of underestimating the true cost of opening a tailor shop. For lenders or investors, it provides a clear use-of-funds view and helps show whether the requested capital is grounded in a practical operating plan. It also supports budgeting decisions by separating essential costs from optional or growth-related spending.
Break-Even and Cash Flow Forecasting
The break-even and cash flow forecasting component helps users determine when the tailor shop may become financially self-sustaining and whether it has enough liquidity during the ramp-up period. Break-even analysis can use assumptions such as fixed monthly costs, average revenue per visit, gross margin, contribution margin, and customer volume to estimate how many jobs or visits are needed to cover expenses. Cash flow forecasting then shows how money moves through the business month by month, including revenue collections, payroll, rent, supplier payments, taxes, startup investments, loan proceeds, debt repayment, and ending cash balance.
This is especially important for a tailor shop because profitability on paper does not always mean the business has enough cash to handle equipment purchases, deposits, seasonal slowdowns, or early marketing costs. Outputs may include monthly cash flow, cumulative cash position, minimum cash balance, funding gap, break-even timing, and payback period. This component supports better decision-making by showing whether the owner should raise more capital, delay certain expenses, adjust pricing, require deposits for custom garments, or maintain a larger reserve. It is also highly valuable for funding discussions because it demonstrates when the business expects to cover its costs and how it plans to manage liquidity along the way.
Similar ProductsOther customers were also interested in...


 HenrySheykin
Online Clothing Store Financial Model Excel Templa...
The Online Clothing Store Financial Model helps founders, entrepreneurs, business owners, consultant... Read more
Clothing Store Financial Model Excel Template
The Clothing Store Financial Model helps turn a retail apparel concept into a structured financial f... Read more
Clothing Line Business Financial Model Excel Templ...
The Clothing Line Financial Model helps founders, apparel entrepreneurs, consultants, analysts, and ... Read more
Fashion Marketplace Financial Model Excel Template
The Fashion Retail Financial Model helps entrepreneurs, founders, business owners, consultants, and ... Read more
Baby Clothes Store Financial Model Excel Template
The Baby Clothing Store Financial Model helps entrepreneurs, boutique owners, consultants, analysts,... Read more
Bridal Shop Financial Model Excel Template
The Bridal Shop Financial Model helps users turn a wedding dress boutique concept into a structured,... Read more

 Jason Varner
Laundromat Financial Model – 10 Year
This template allows the user to produce financial statements based on assumptions specific to the l... Read more

 Giorgos
Online Clothing Wholesaler – 5 Year Financia...
Advanced Financial Model presenting a 5 Year Business Plan for an Online Clothing Wholesale company.... Read more

Fashion Designer (Independent) – 5 Year Financia...
Financial Model providing a highly sophisticated 5-year financial plan for a startup Independent Fas... Read more

Clothing Boutique Financial Model – Dynamic 10 Y...
Financial Model providing a dynamic up to 10-year financial forecast for a startup or existing Cloth... Read more
Reviews
You must log in to submit a review.