
0 ITEMS

Space Economy & Launch Services Financial Model – Reuse, Backlog, Constellation, Three Statements & Valuation
🚀 Evaluate a launch-services and satellite-constellation business with an integrated 46-sheet, 10-year financial model. The workbook connects launch cadence, reusable-booster amortization, Wright’s-law learning, cost per launch, cost per kilogram, payload capacity, manifest/backlog conversion, dedicated and rideshare pricing, government/commercial contract risk, broadband, Earth observation, IoT, mission reliability, insurance, operating costs, capex, funding, three financial statements, scenarios, sensitivities, and valuation. All editable assumptions are centralized on one Control Panel. Select Bear, Base, or Bull, or create a custom case, then review three dashboards, KPI outputs, linked statements, DCF/EV-revenue valuation, project IRR, funding need, and 25 automated audit checks. The macro-free workbook is fully editable, self-contained, and contains no external file links. Illustrative assumptions are included and should be replaced with case-specific inputs.
🚀 SPACE LAUNCH ECONOMICS & VALUATION
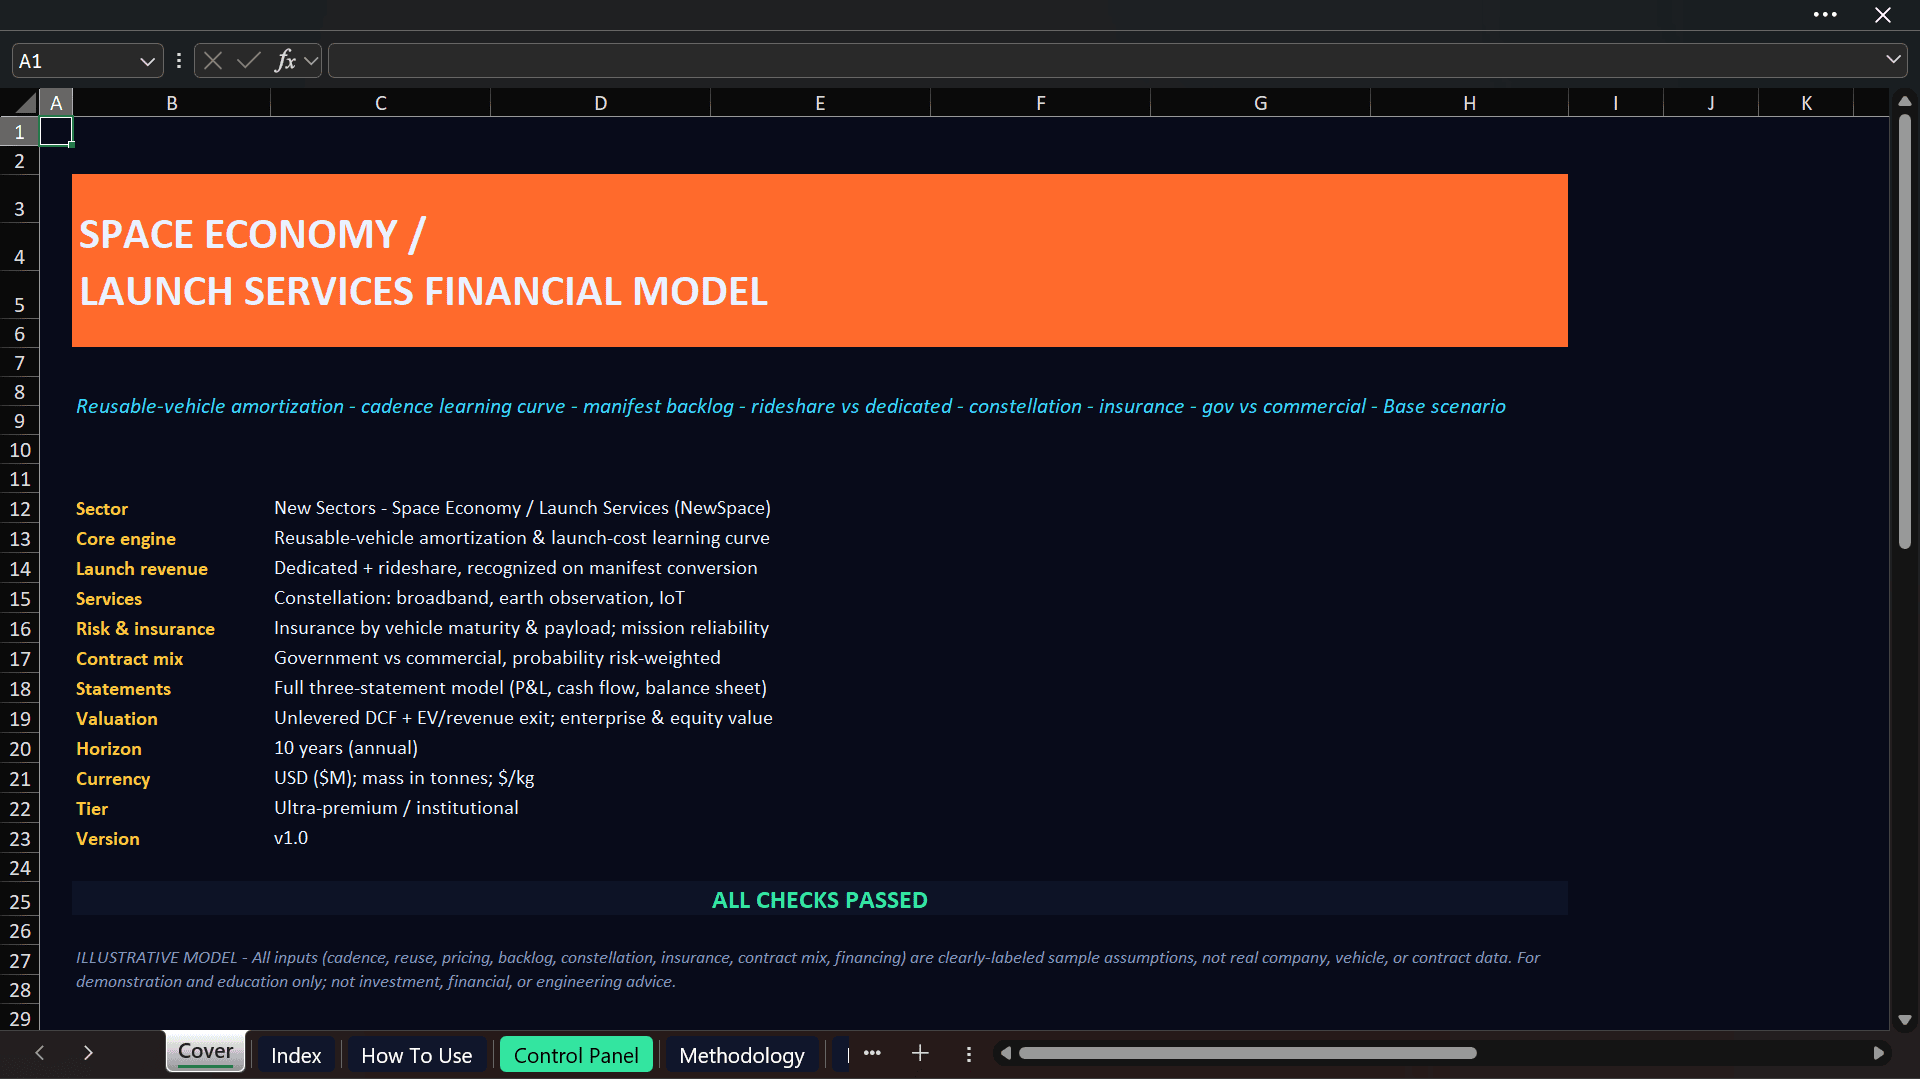
This 46-sheet Excel workbook evaluates a launch-services platform over a 10-year forecast. It connects reusable-vehicle economics, cadence, learning, manifest conversion, dedicated and rideshare pricing, constellation services, risk, insurance, funding, three-statement forecasting, scenarios, and valuation.
It models the mechanics that determine whether a launch platform can scale: cadence, booster reuse, cumulative learning, backlog conversion, mission pricing, and recurring constellation revenue.
It is designed for founders, finance teams, investors, consultants, and analysts translating a NewSpace thesis into financial projections. All editable assumptions are centralized on one Control Panel.
🎯 WHAT THIS MODEL HELPS YOU ANSWER
• How many launches can the platform support as cadence ramps toward physical capacity?
• How do booster life, average reflights, refurbishment cost, and fairing recovery affect cost per mission?
• What happens to cost per launch and cost per kilogram as the fleet gains experience?
• How much revenue comes from dedicated launches versus rideshare missions?
• How does signed manifest backlog convert into flown and recognized revenue?
• Can new bookings replenish backlog fast enough to support future launch activity?
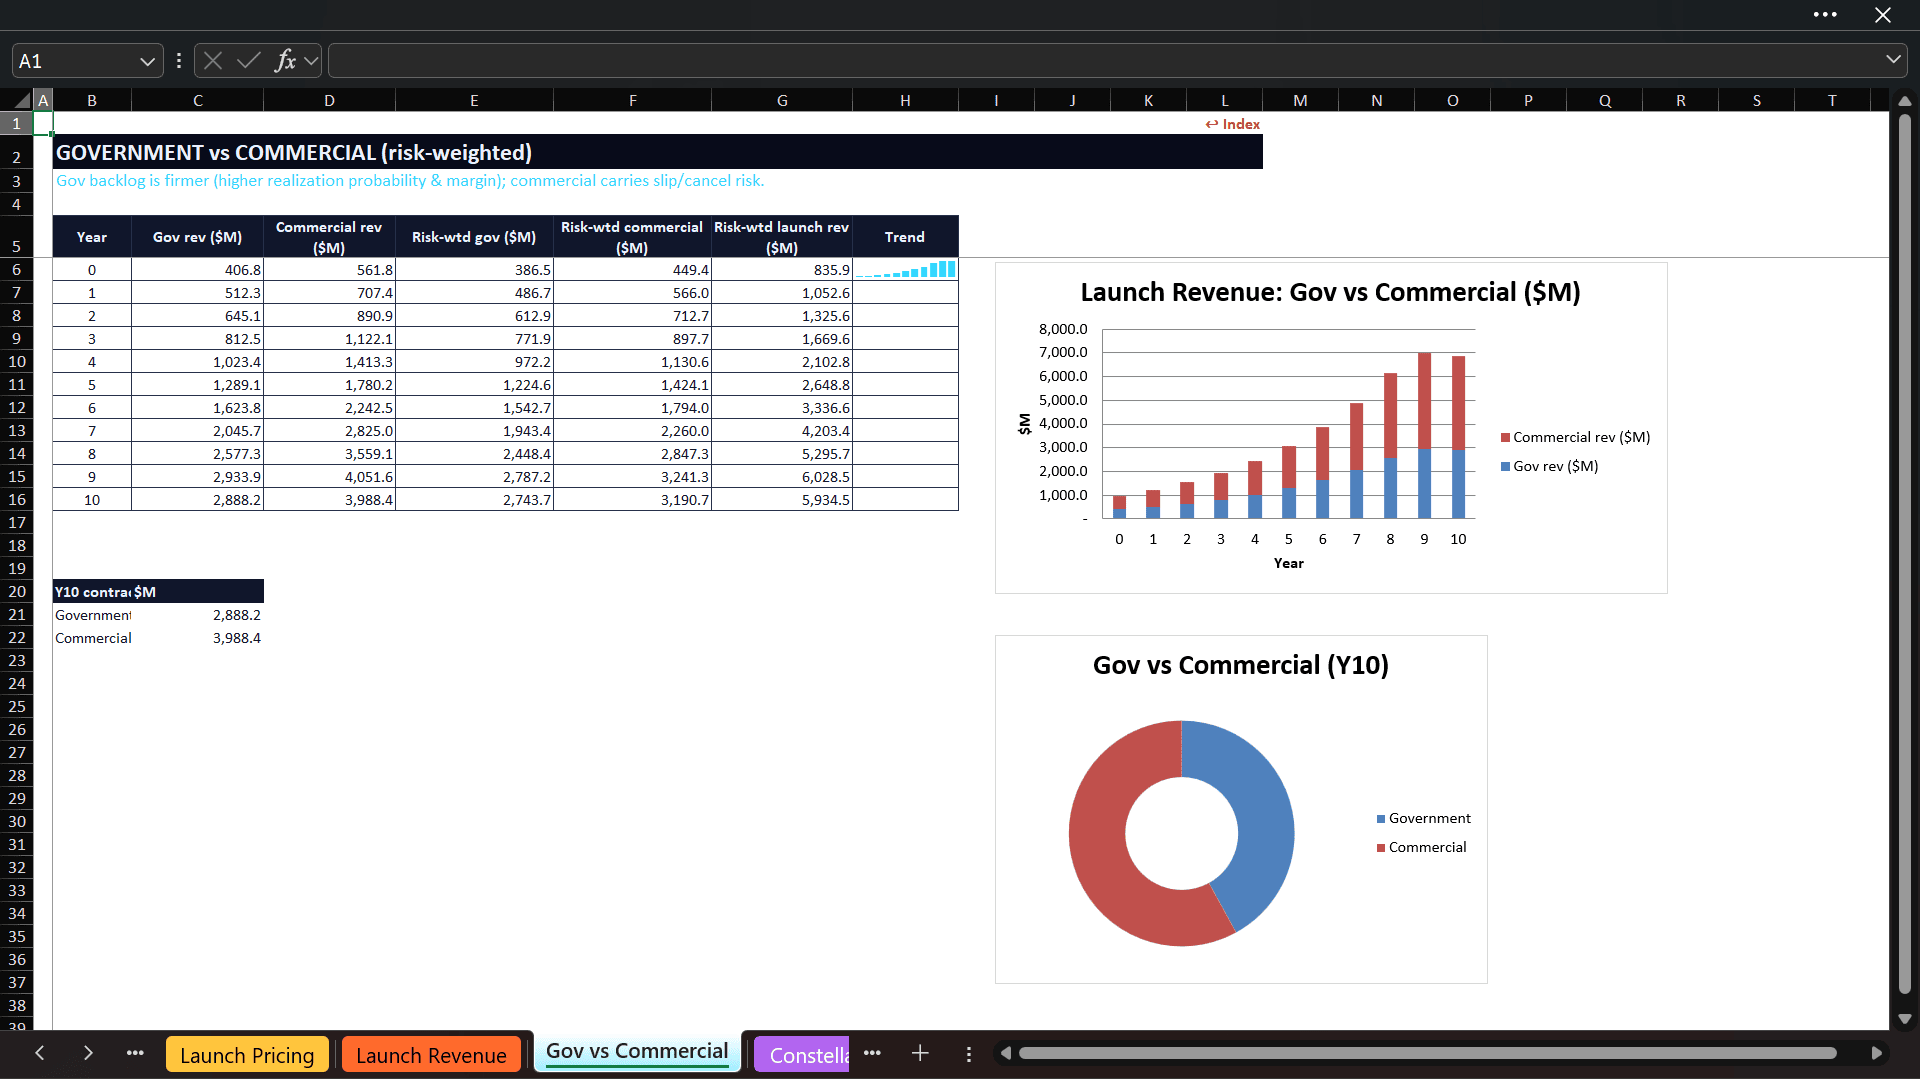
• What is the impact of government versus commercial contract mix and realization risk?
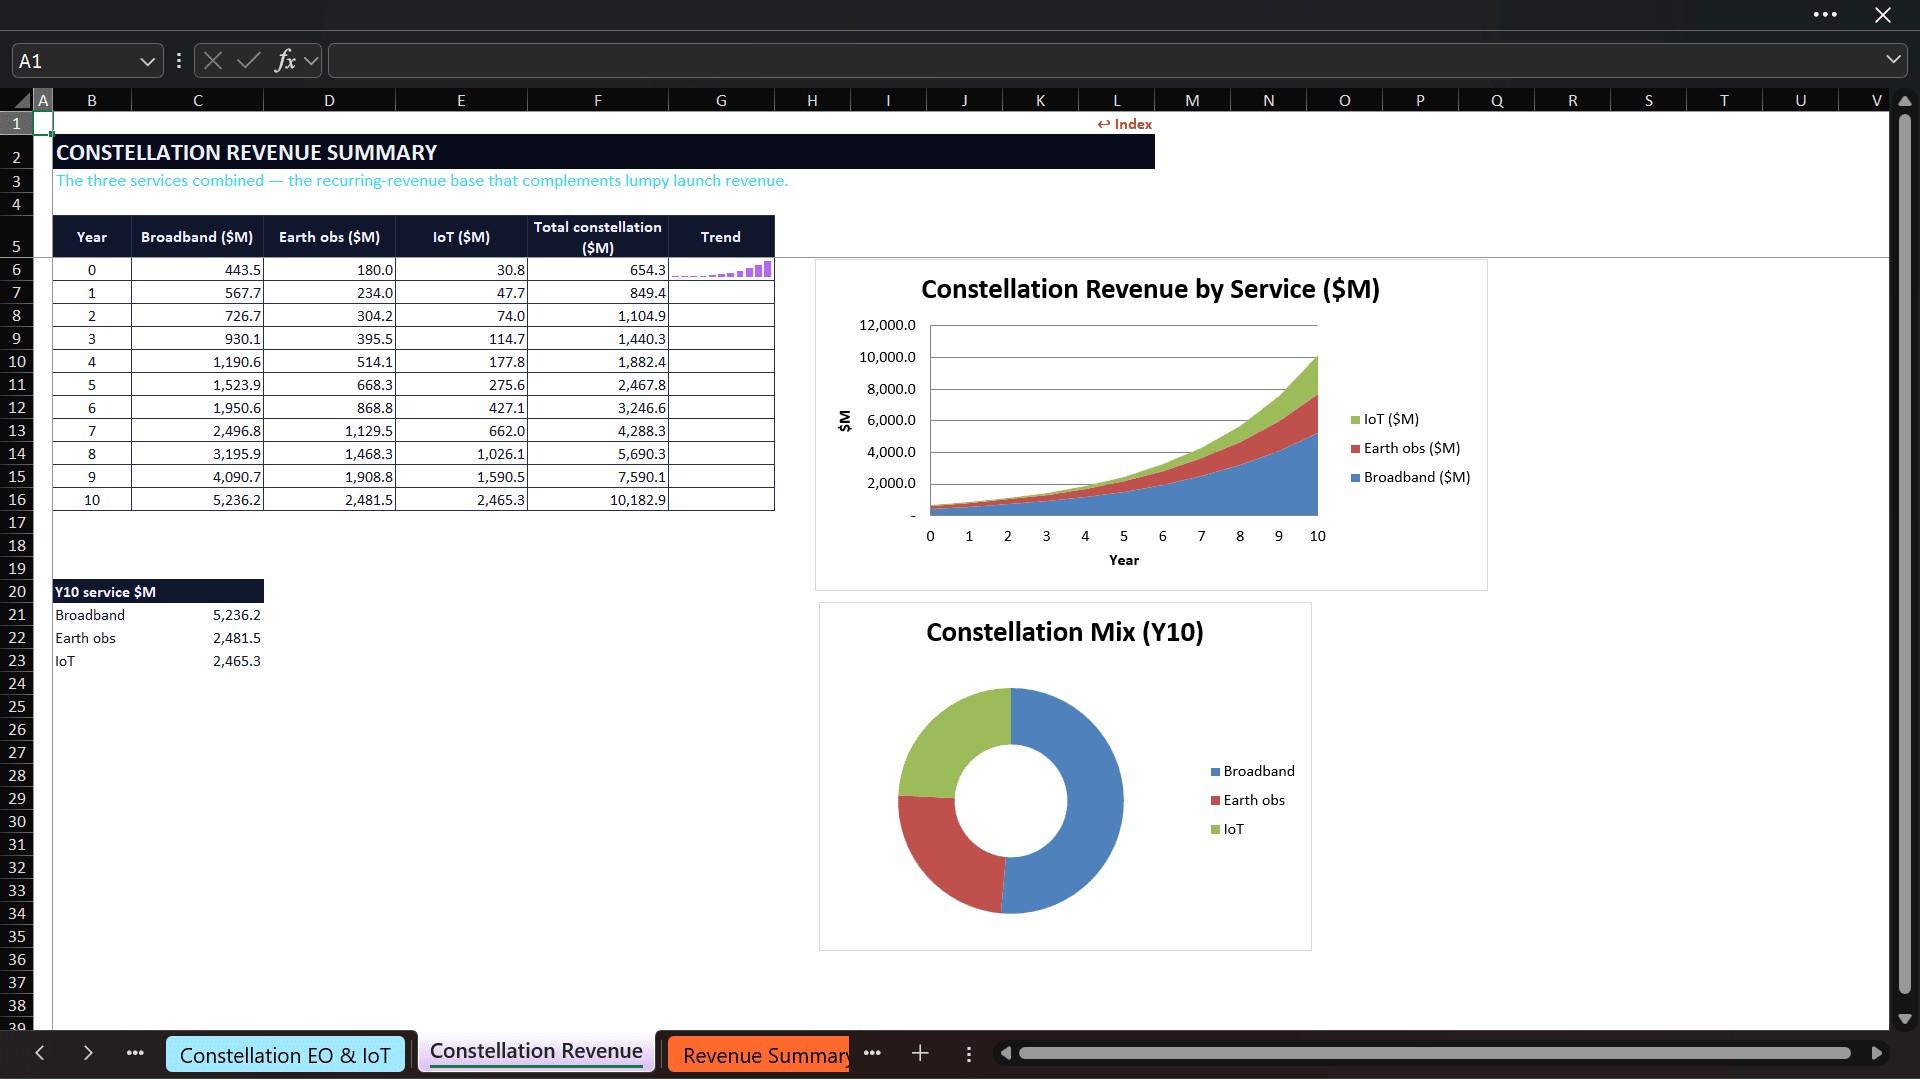
• How much recurring revenue can be generated by broadband, Earth-observation, and IoT services?
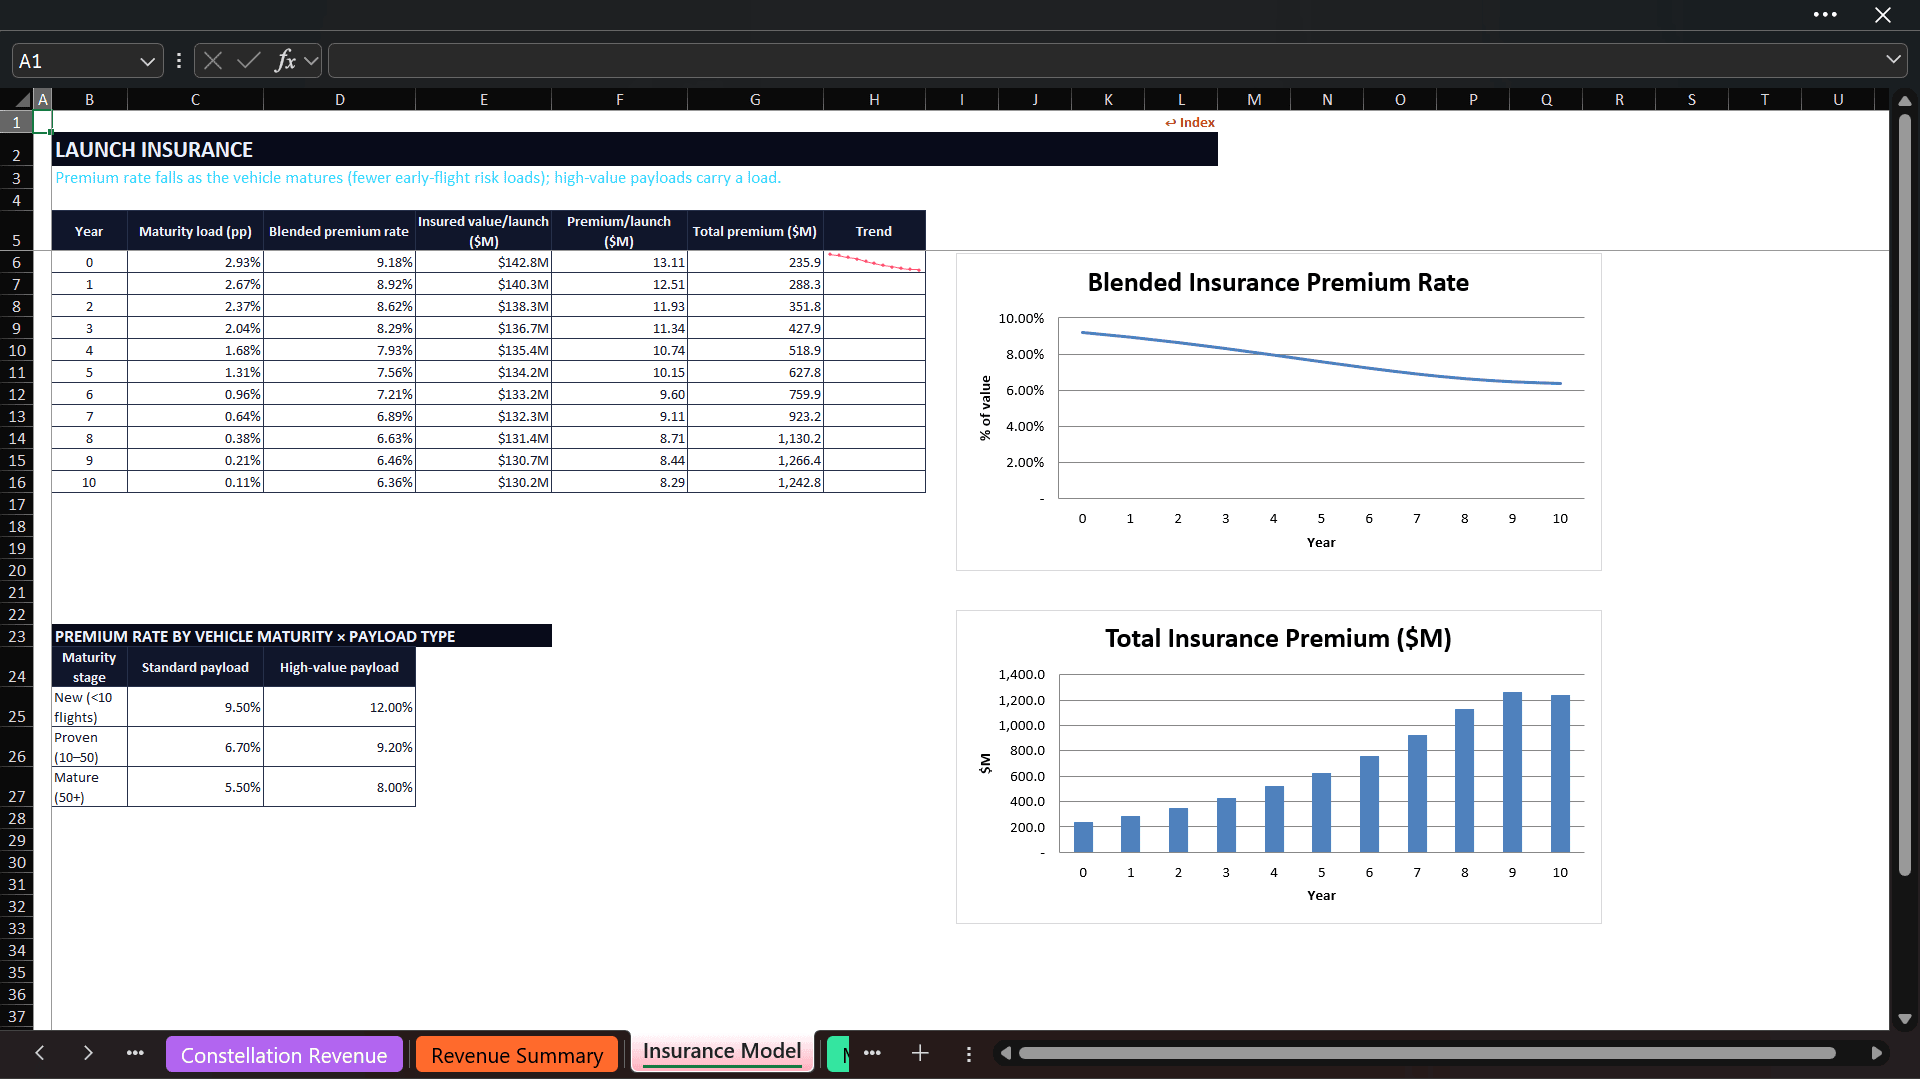
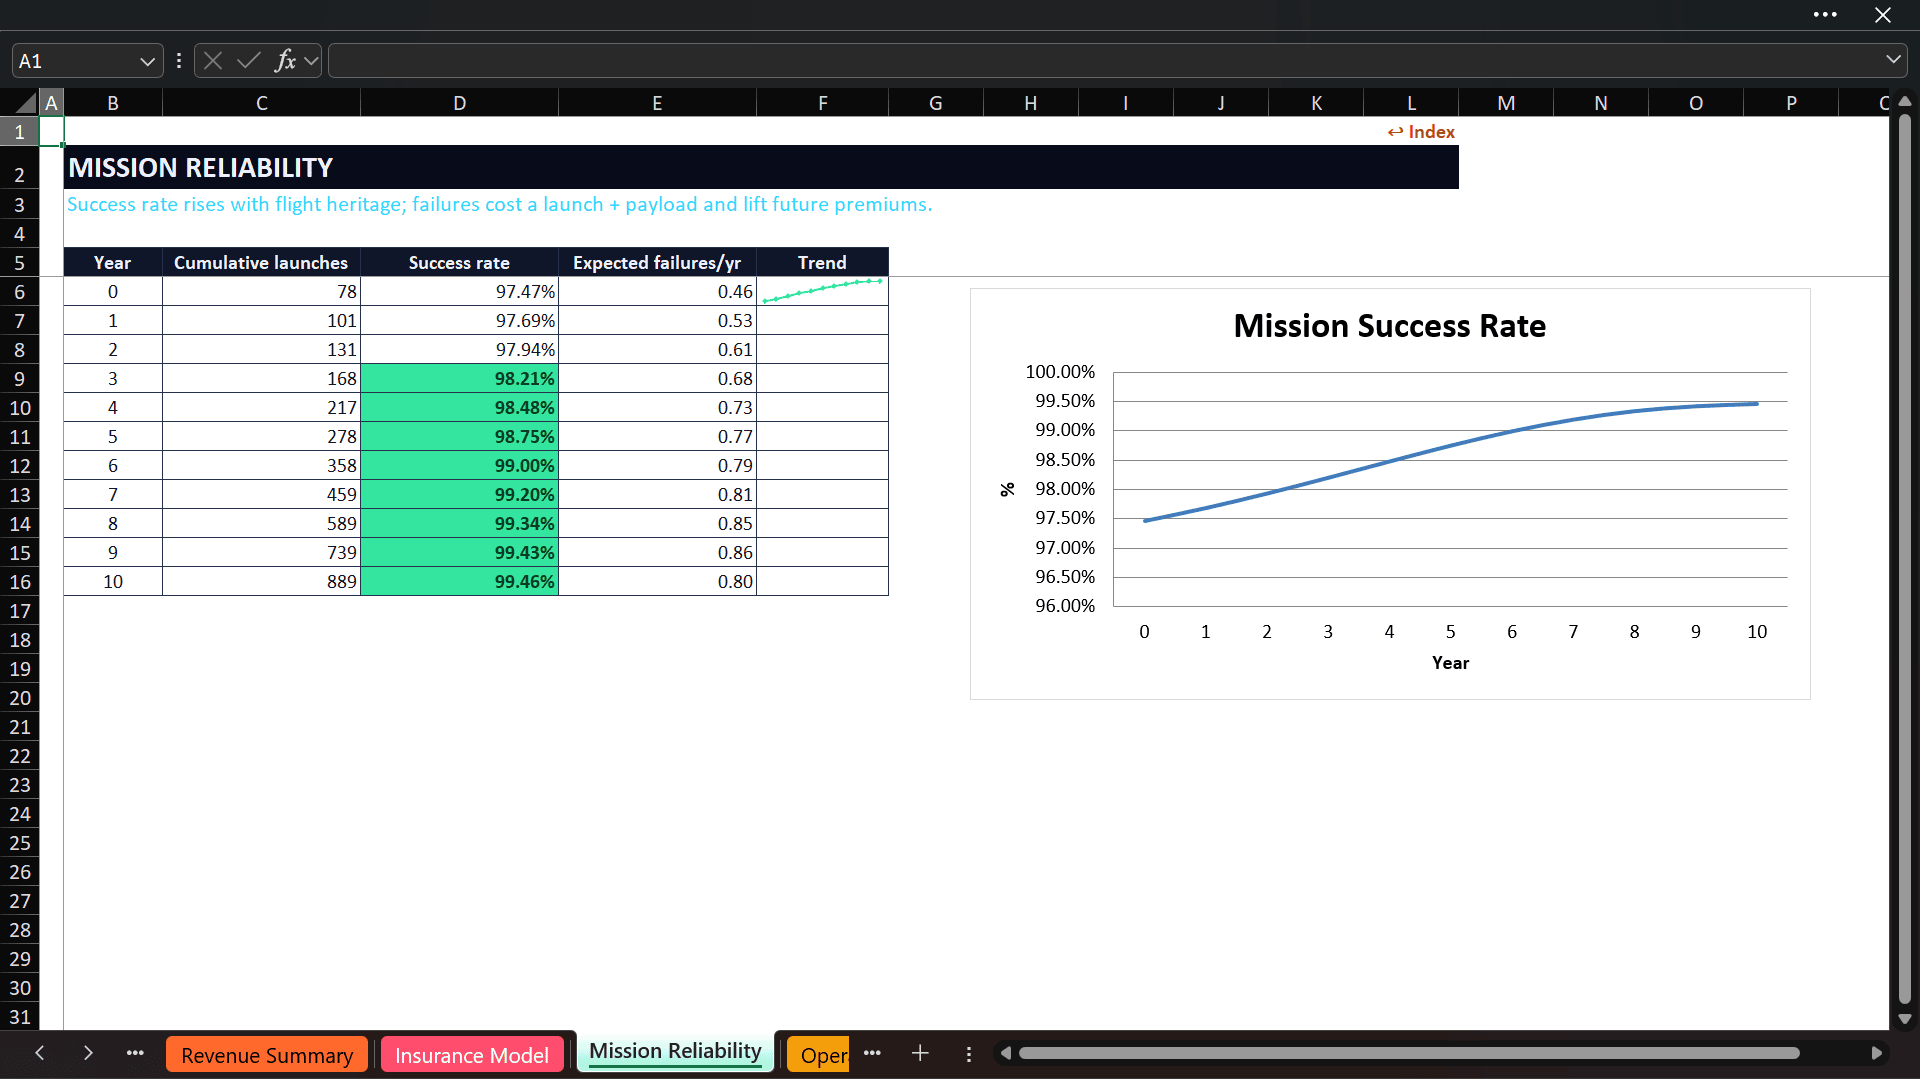
• How do vehicle maturity, payload value, and mission reliability affect insurance cost?
• What level of R&D, fleet infrastructure, and constellation capex must be funded?
• When does the business generate positive earnings and cash flow under the selected case?
• What enterprise value, equity value, project IRR, and funding requirement result from the operating plan?
• Which assumptions create the greatest upside or downside to valuation?
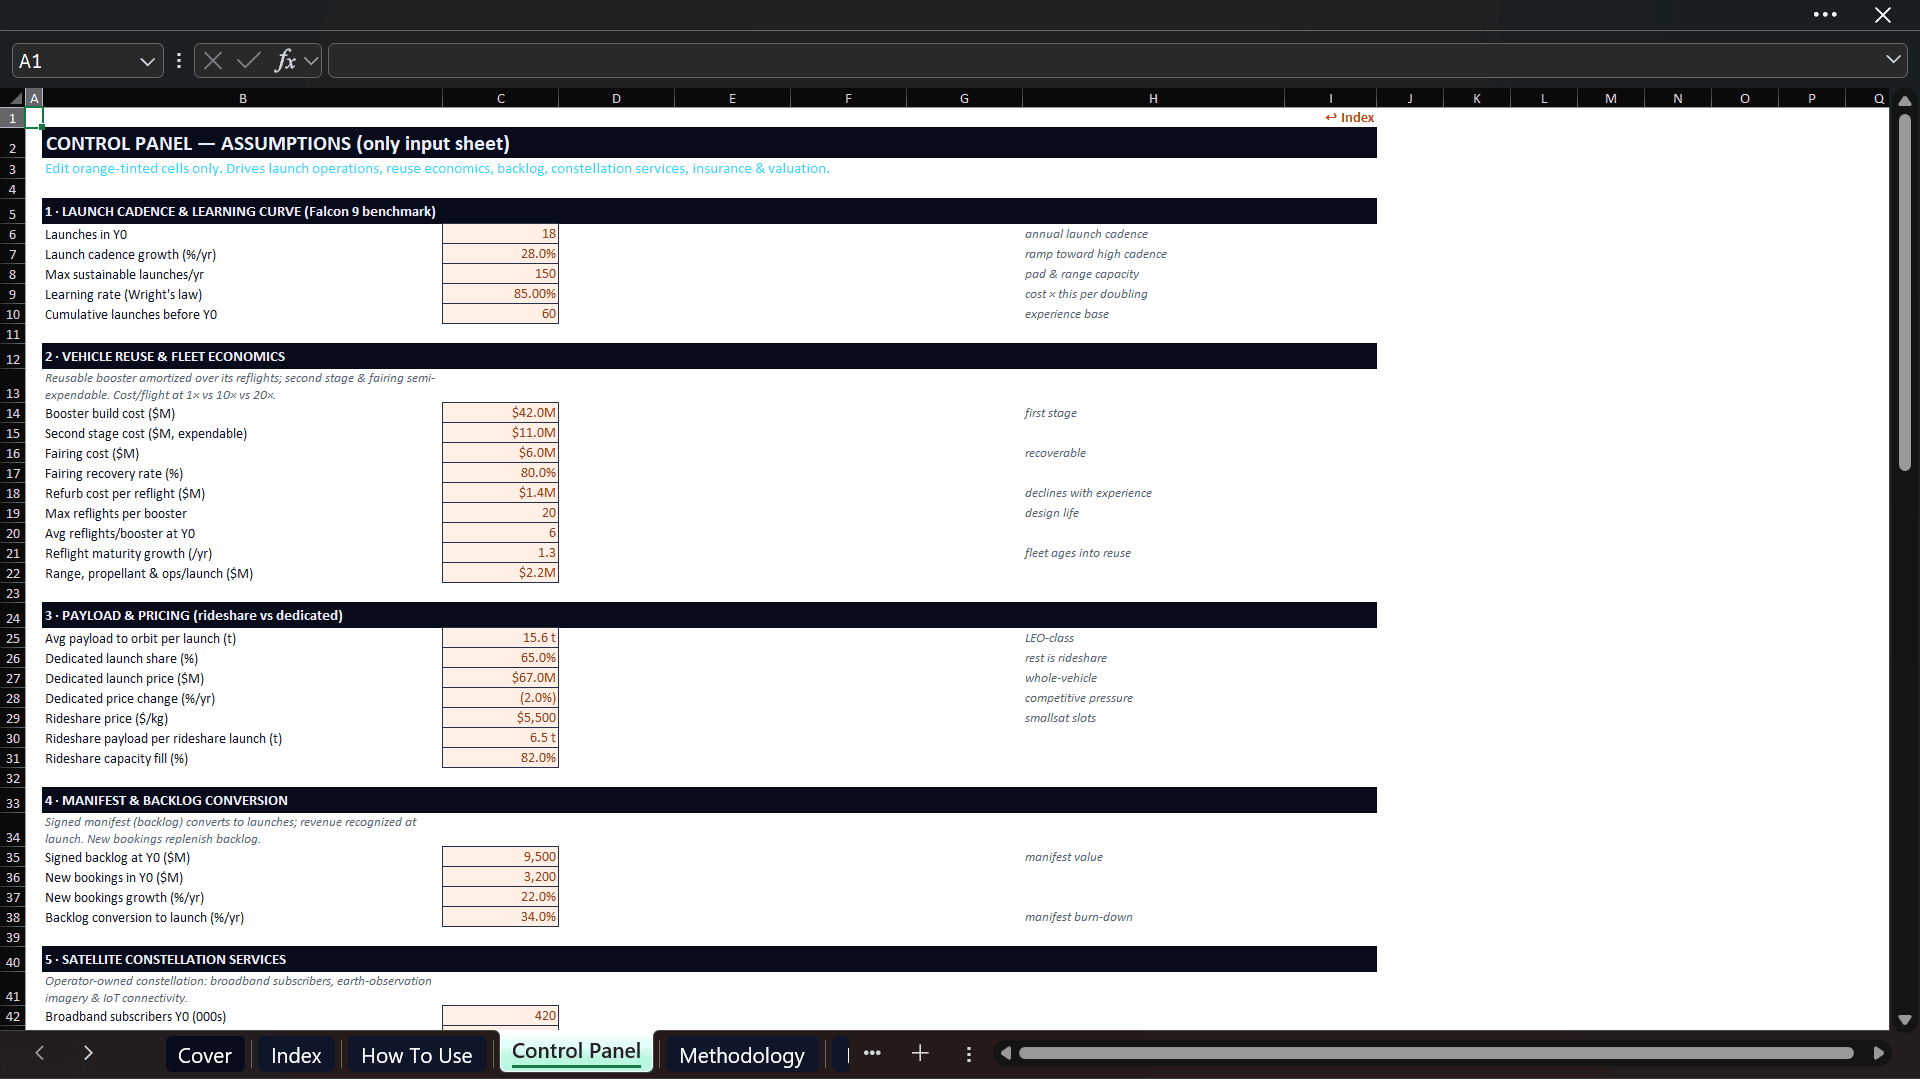
🧭 A CENTRAL CONTROL PANEL—THE ONLY INPUT SHEET
The model has one clearly organized Control Panel containing the editable, orange-tinted assumptions. The remaining sheets calculate automatically. Inputs are grouped into 11 practical sections:
• Launch cadence and the Wright’s-law learning curve
• Vehicle reuse and fleet economics
• Payload capacity and dedicated/rideshare pricing
• Manifest backlog and conversion
• Satellite-constellation services
• Insurance by vehicle maturity and payload type
• Government versus commercial contract mix
• Operating cost and capex
• Finance and valuation assumptions
• Balance-sheet and funding assumptions
• Bear, Base, and Bull scenario controls
The Control Panel also includes validation flags for important inputs such as learning rate, launch mix, backlog conversion, maximum reflights, government share, capacity, and scenario selection. This keeps the model easy to operate while giving users visibility over the assumptions that drive the result.
📈 10-YEAR LAUNCH CADENCE & LEARNING-CURVE ENGINE
Annual launches ramp from the initial cadence toward a configurable sustainable-capacity ceiling. Cumulative launches then feed a Wright’s-law learning curve, allowing the workbook to estimate how experience changes the cost base as the organization flies more missions.
The cadence engine connects directly to capacity, payload mass, fleet requirements, launch revenue, operating costs, capex, and valuation. A change in launch growth therefore flows through the full model rather than changing a stand-alone chart.
Dedicated sheets present:
• Annual launch cadence and cumulative launches
• Cadence utilization versus the capacity ceiling
• Cumulative payload mass delivered to orbit
• Learning factors through the forecast horizon
• Annual and cumulative cost-efficiency trends
♻️ REUSABLE-VEHICLE AMORTIZATION & FLEET MATURITY
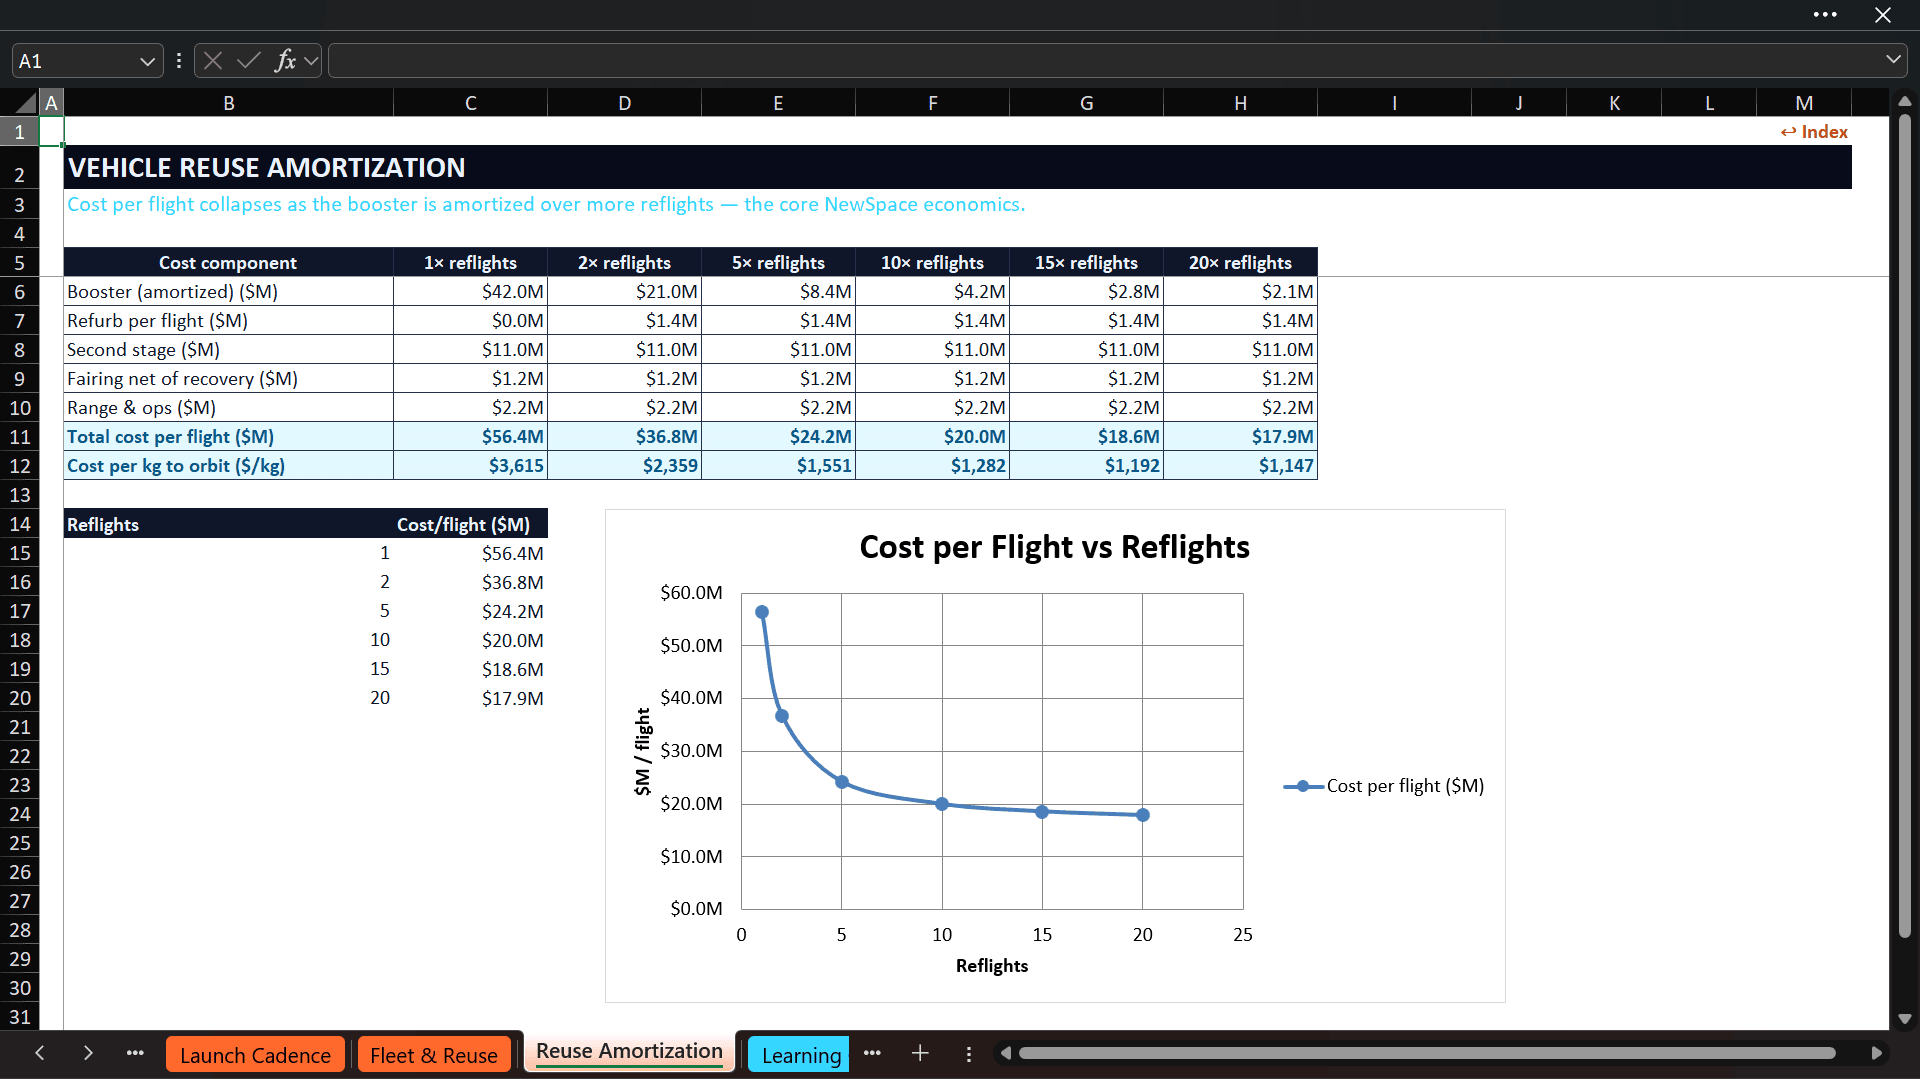
Reuse is treated as an operating and capital-allocation driver—not a cosmetic assumption. The model separates booster build cost, expendable second-stage cost, fairing cost and recovery, refurbishment, and range/propellant/launch-operations cost.
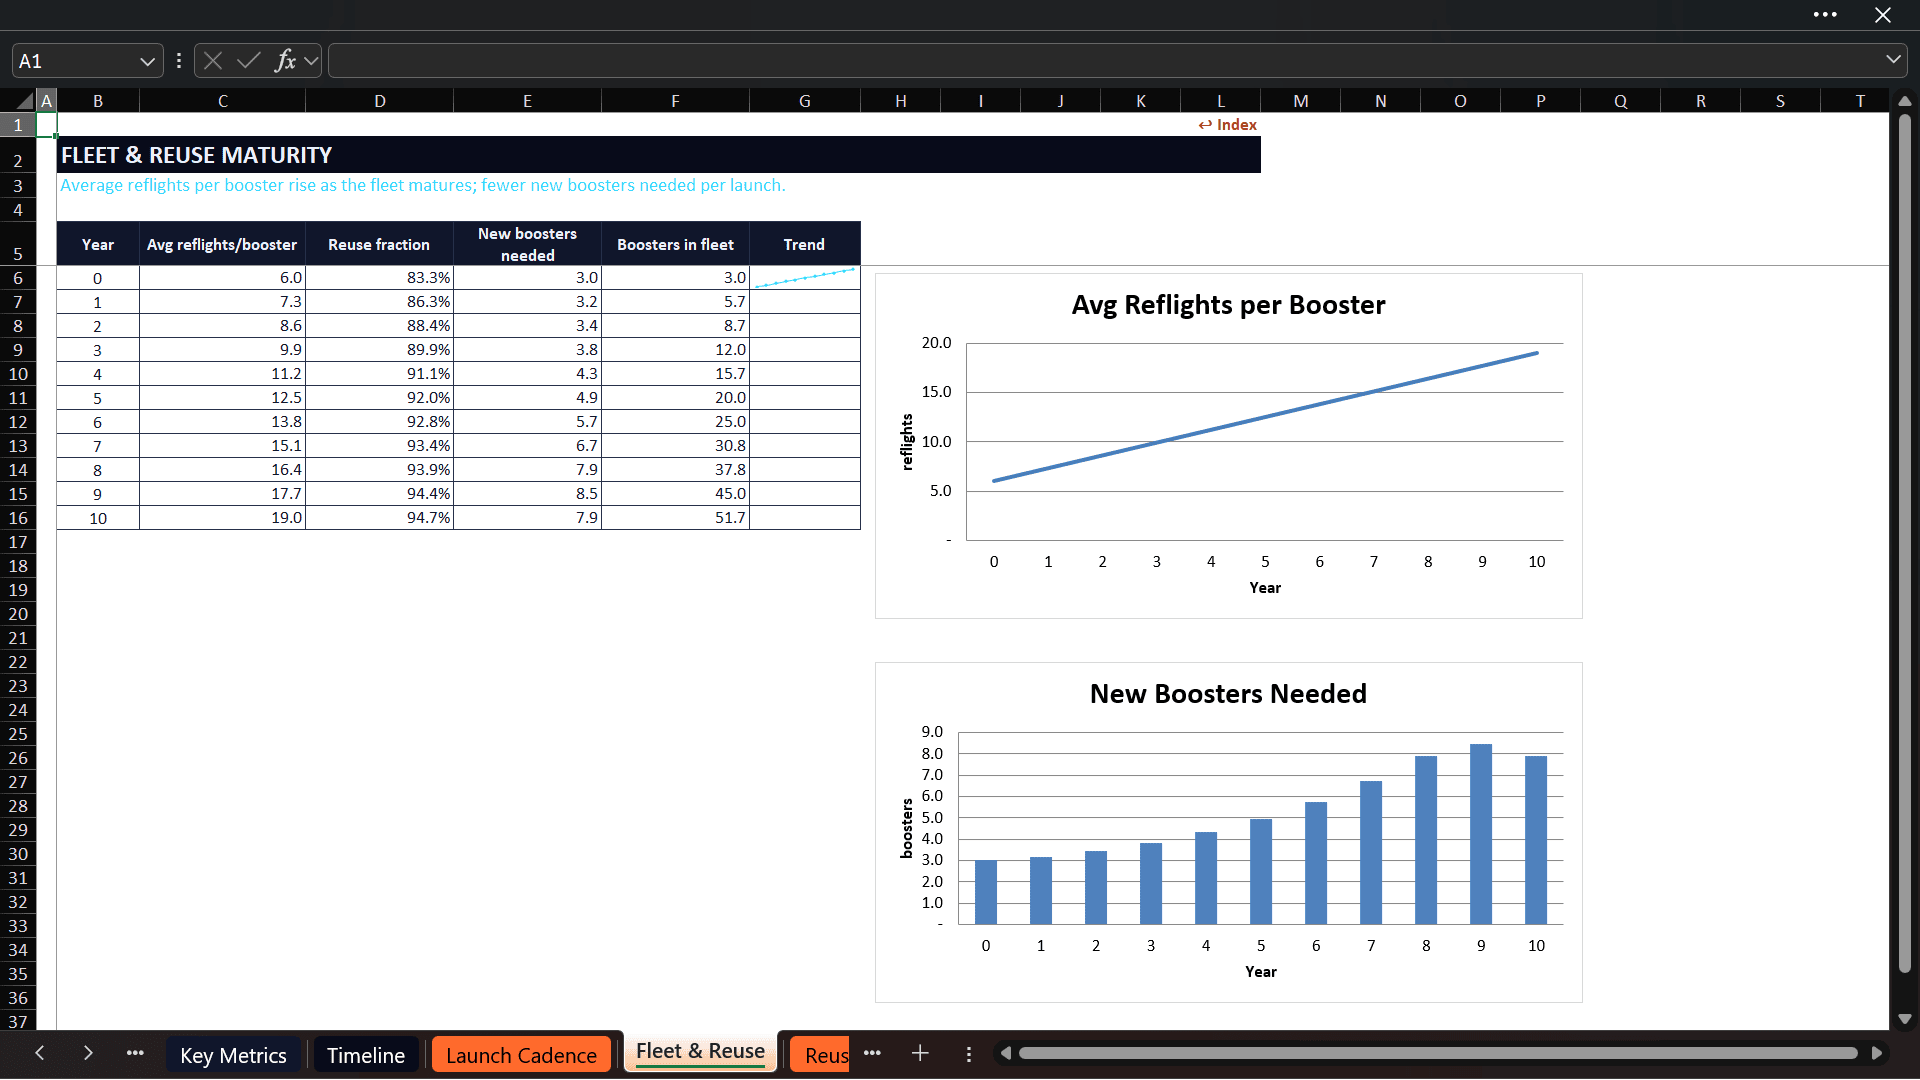
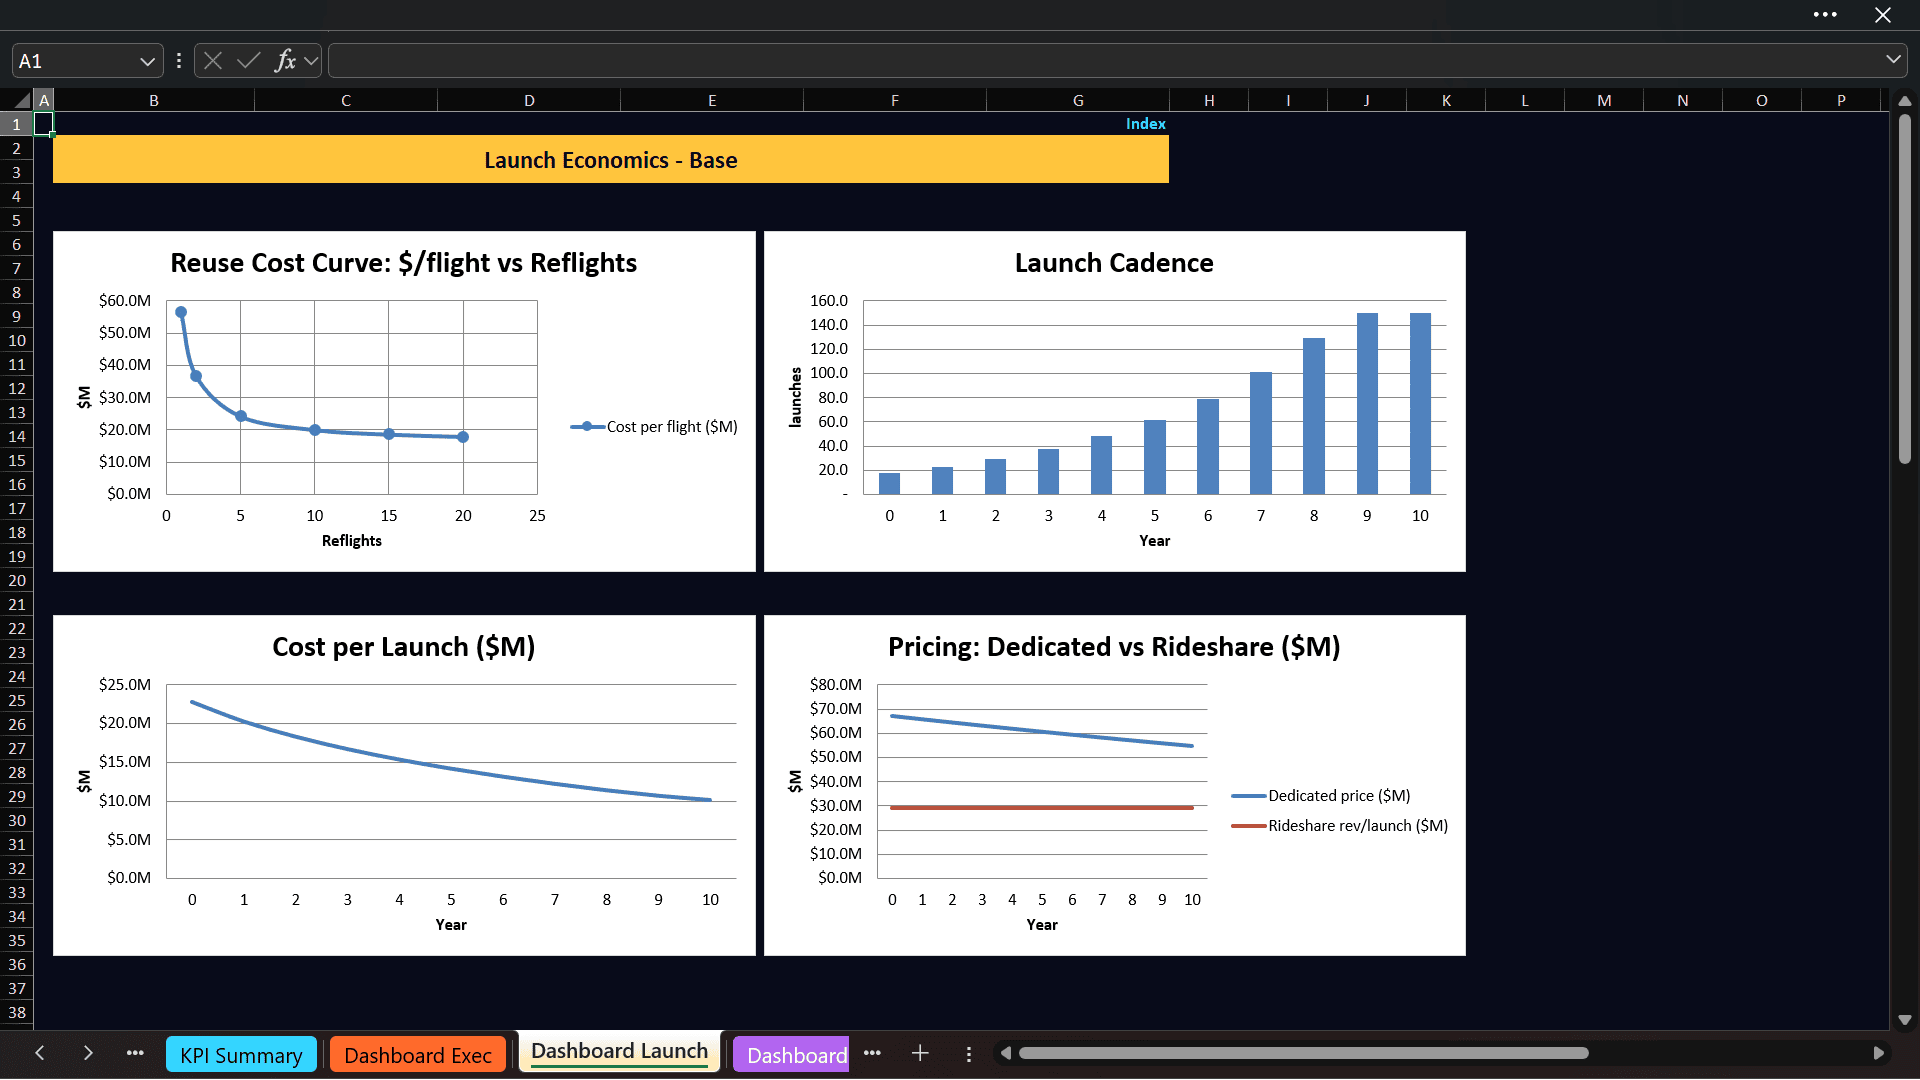
The signature Reuse Amortization schedule shows cost per flight at 1, 2, 5, 10, 15, and 20 reflights. Users can see how allocating booster build cost over more missions changes the economics of each launch. The Fleet & Reuse schedule also projects average reflights, reuse fraction, new boosters required, and fleet growth over time.
Analyze:
• Booster amortization over its useful flight life
• Refurbishment and semi-expendable hardware cost
• Fairing recovery economics
• New-booster requirements as cadence grows
• Fleet maturity and achievable reuse fraction
• The combined impact of reuse and organizational learning
💸 COST PER LAUNCH, COST PER KG & UNIT ECONOMICS
The cost engine combines reusable hardware amortization, refurbishment and operations, second-stage and fairing economics, and the learning factor. It calculates a blended marginal cost per launch for every forecast year.
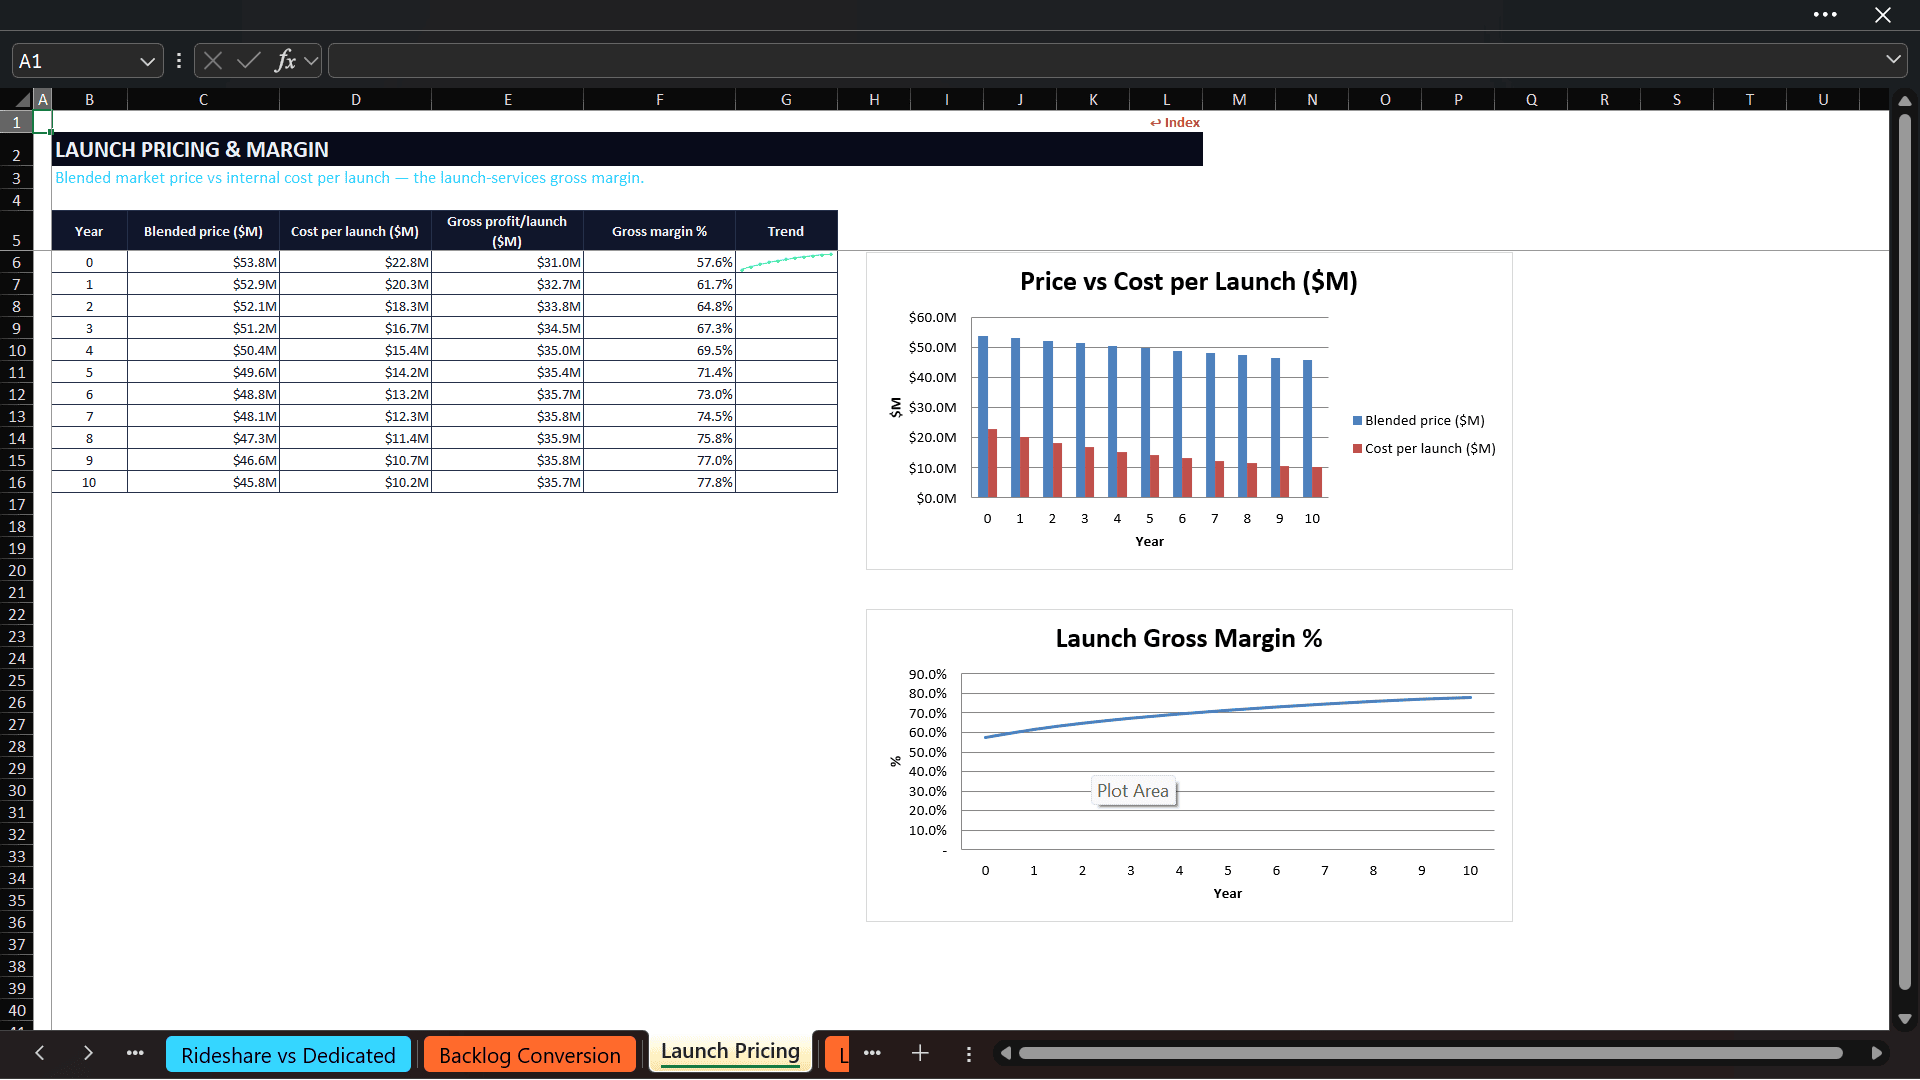
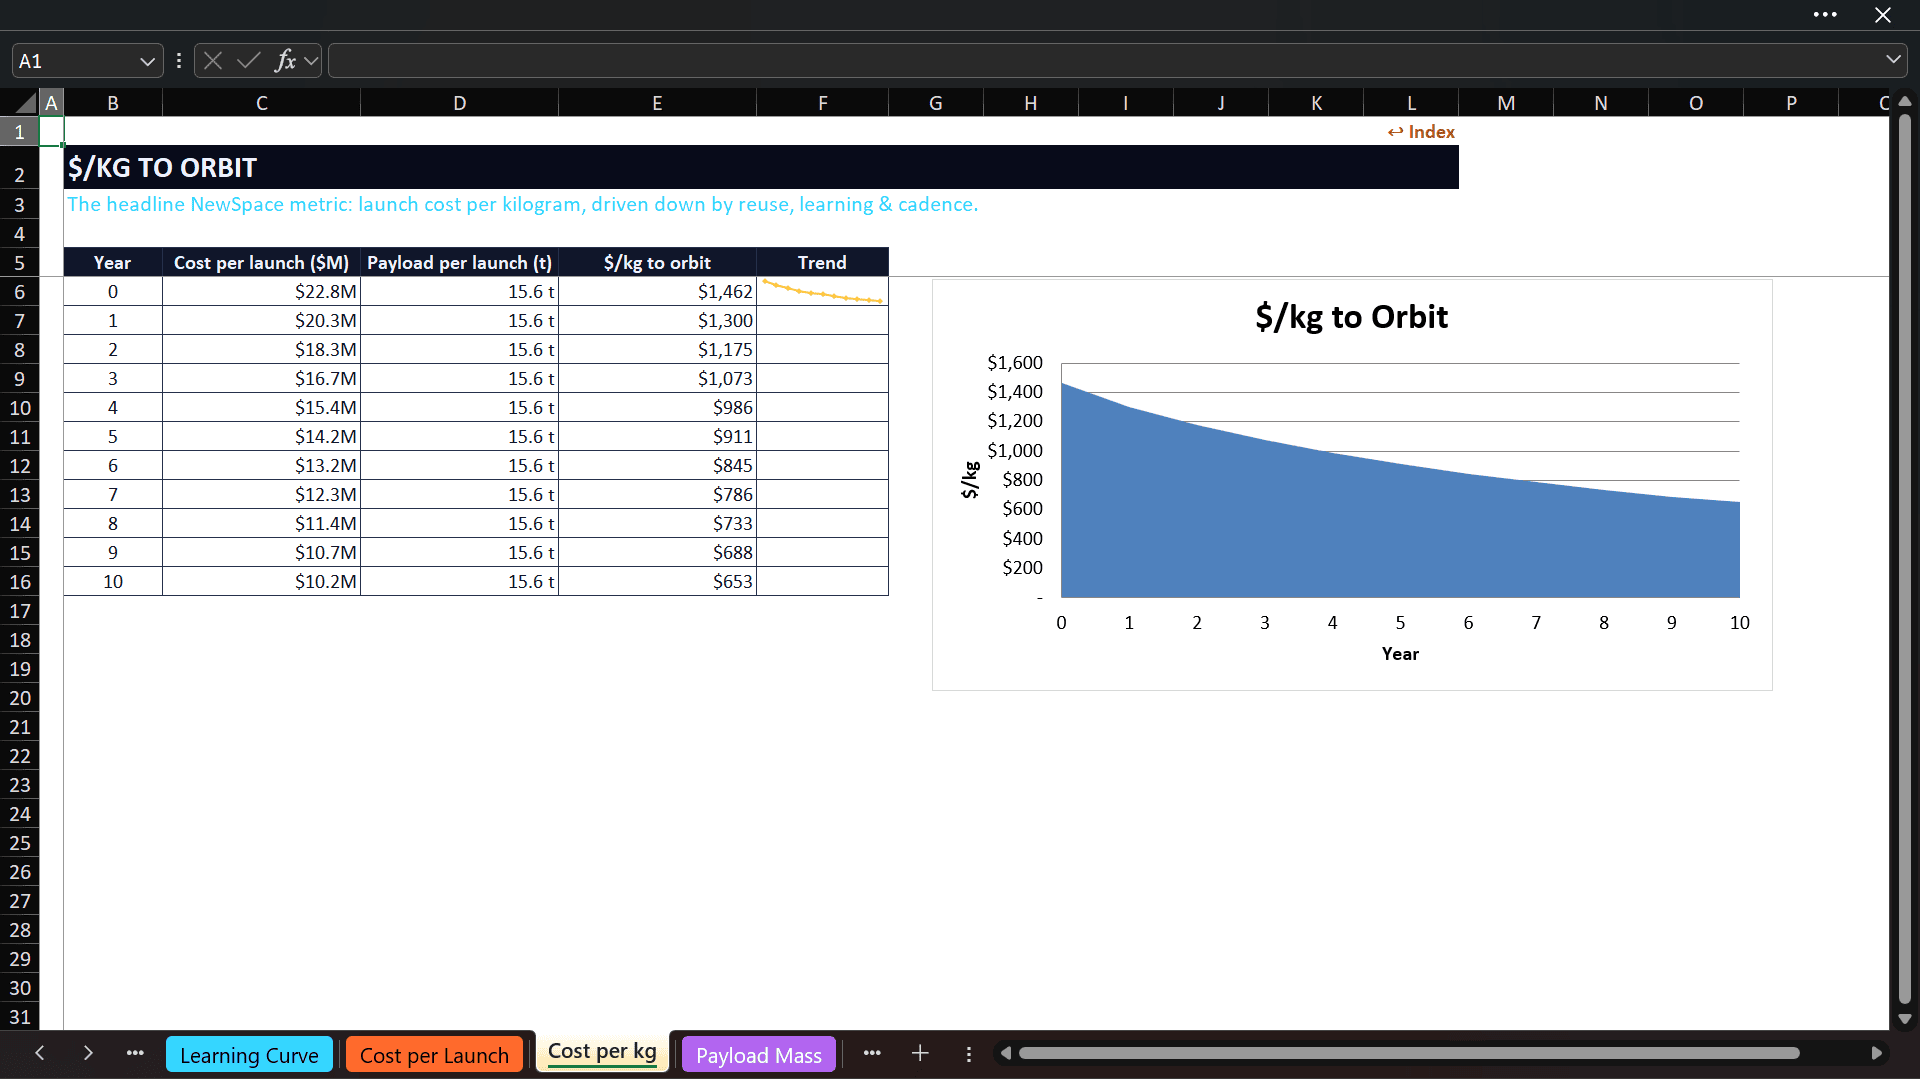
That cost is divided by the assumed payload mass to calculate cost per kilogram to orbit—a central operating-efficiency metric for launch businesses. A dedicated Y10 Unit Economics sheet then summarizes launches, blended revenue per launch, cost per launch, gross profit per launch, launch gross margin, cost per kilogram, payload mass, insurance cost, average booster reflights, and mission success rate.
Linked outputs show how payload utilization, reusable life, cadence, or learning rate affects mission and company economics.
📚 MANIFEST, BOOKINGS & BACKLOG CONVERSION
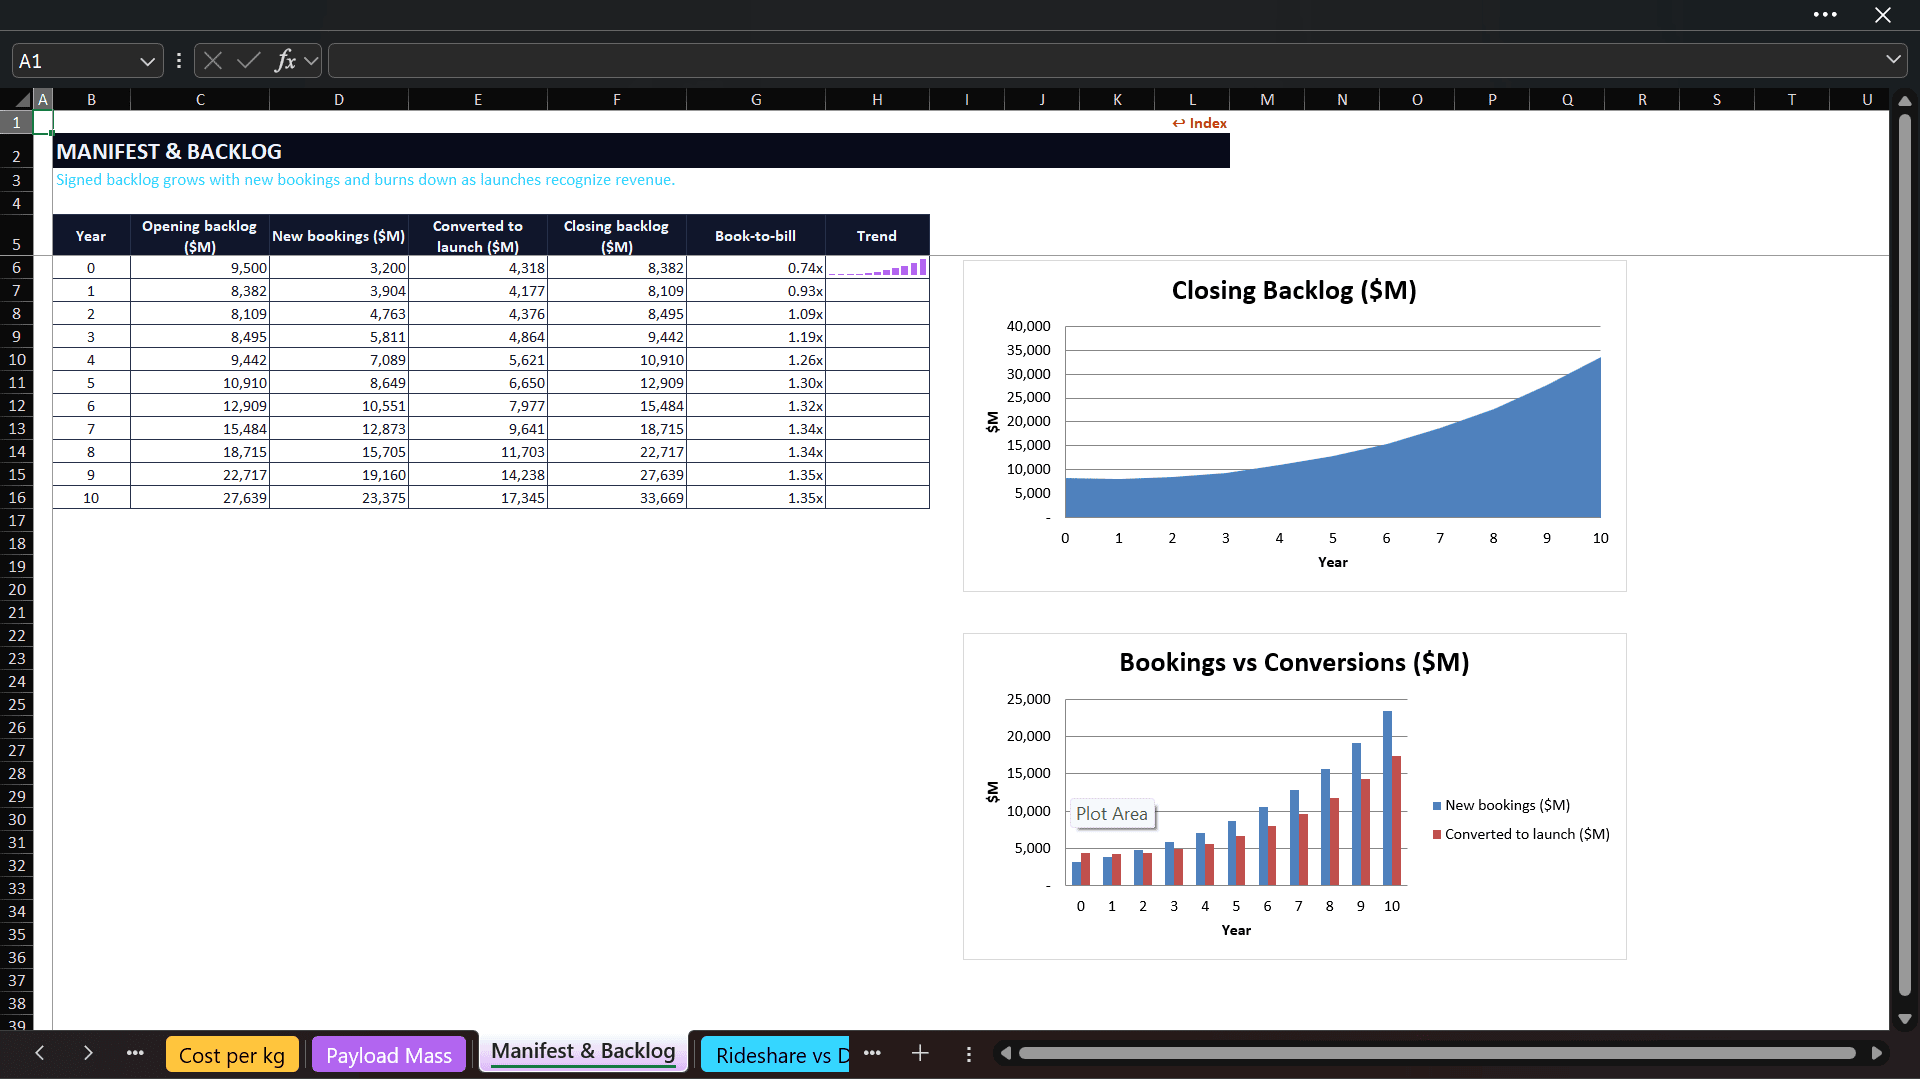
The model does not assume that all signed contracts immediately become revenue. It begins with a signed manifest, adds new bookings, converts backlog according to a configurable rate, and recognizes launch revenue when missions are flown.
Recognized launch revenue is also limited by physical launch capacity at the blended market price. This prevents the forecast from recognizing more launch revenue than the fleet and launch schedule can deliver. The model calculates opening backlog, new bookings, converted revenue, closing backlog, and book-to-bill performance for each year.
🛰️ DEDICATED, RIDESHARE & BLENDED LAUNCH PRICING
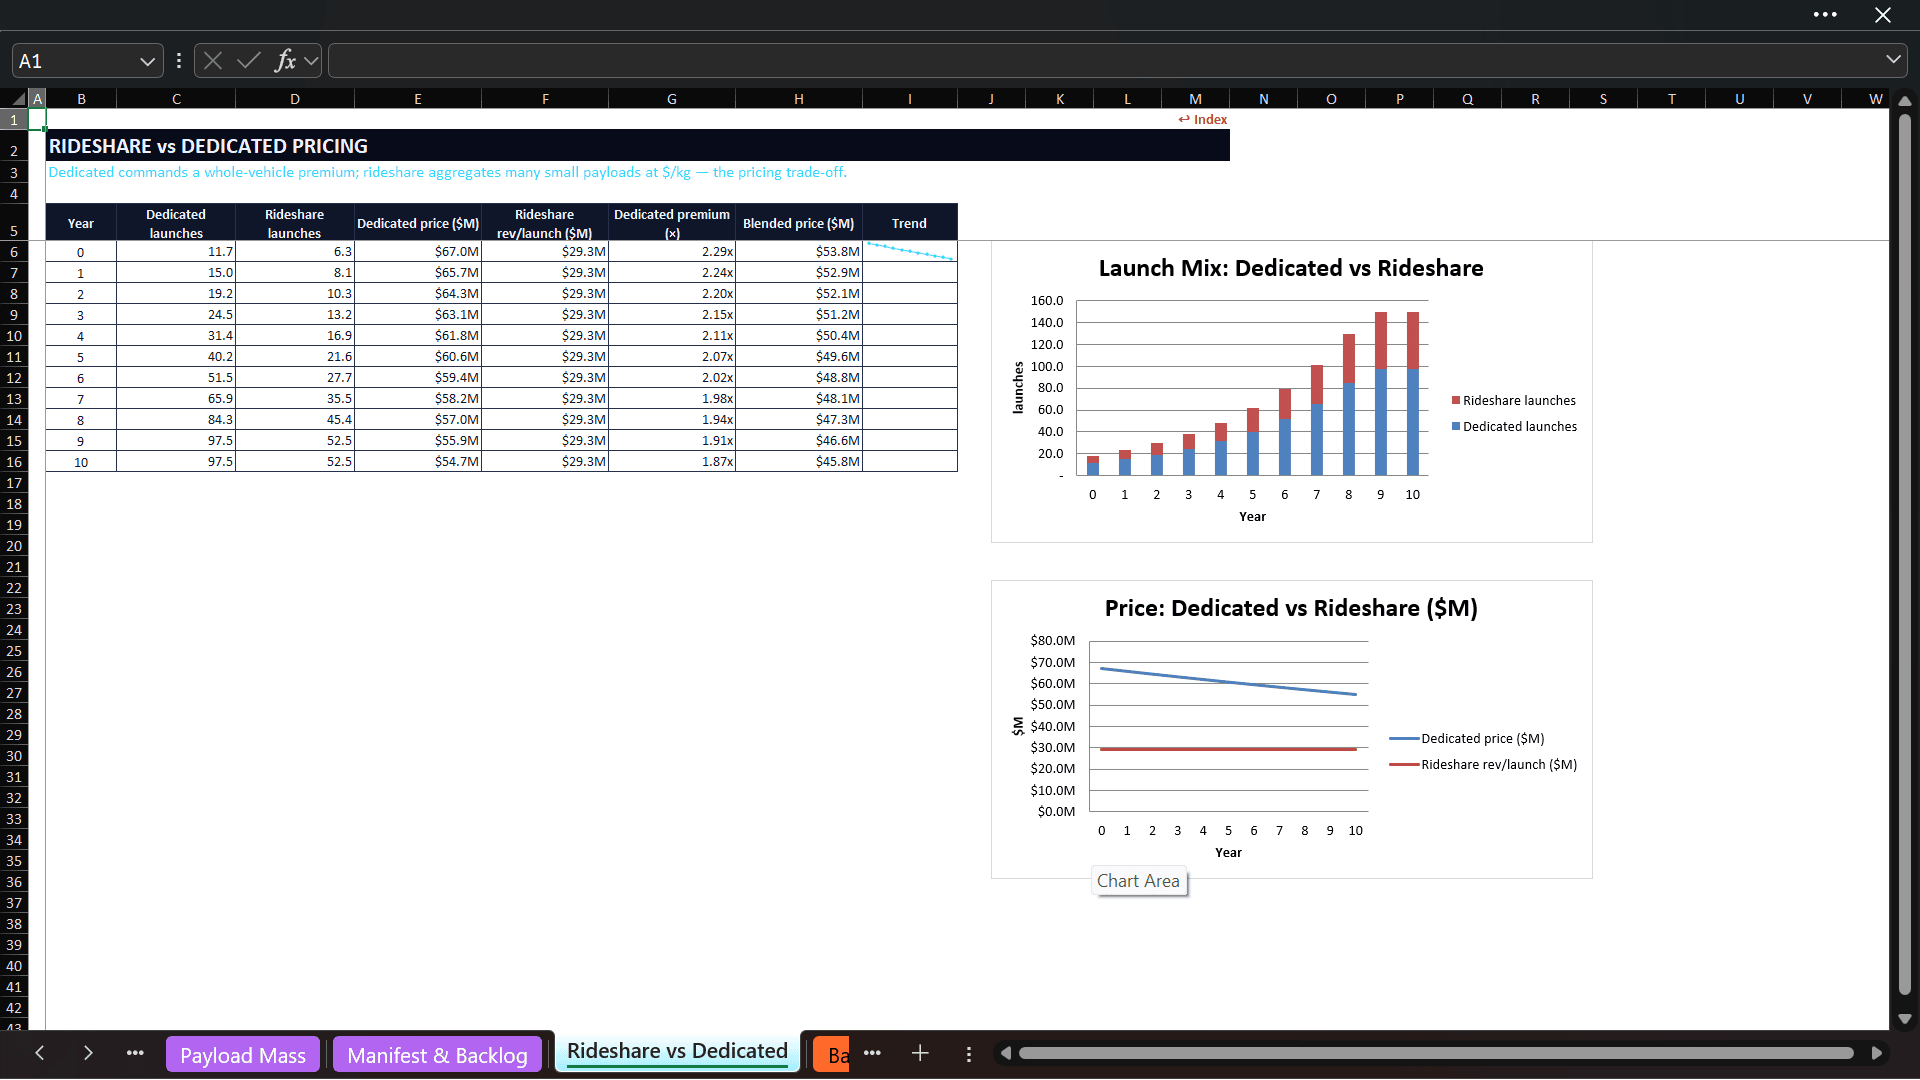
Dedicated missions use a whole-vehicle price, while rideshare missions combine payload capacity, fill rate, and a price per kilogram. The two streams are then combined using the mission mix.
Outputs include dedicated launches, rideshare launches, dedicated price, rideshare revenue per mission, dedicated pricing premium, blended revenue per launch, cost per launch, gross profit per mission, and launch gross margin. Users can assess pricing pressure, mission mix, capacity utilization, and the trade-off between whole-vehicle contracts and aggregated small-payload demand.
🌐 THREE CONSTELLATION REVENUE ENGINES
The workbook includes an operator-owned satellite-constellation business alongside launch services. This allows the business case to combine transaction-based launch revenue with recurring downstream services.
The constellation modules cover:
• Broadband subscribers and monthly ARPU
• Earth-observation imagery and analytics revenue
• IoT devices and annual revenue per connected device
• Growth assumptions for each service line
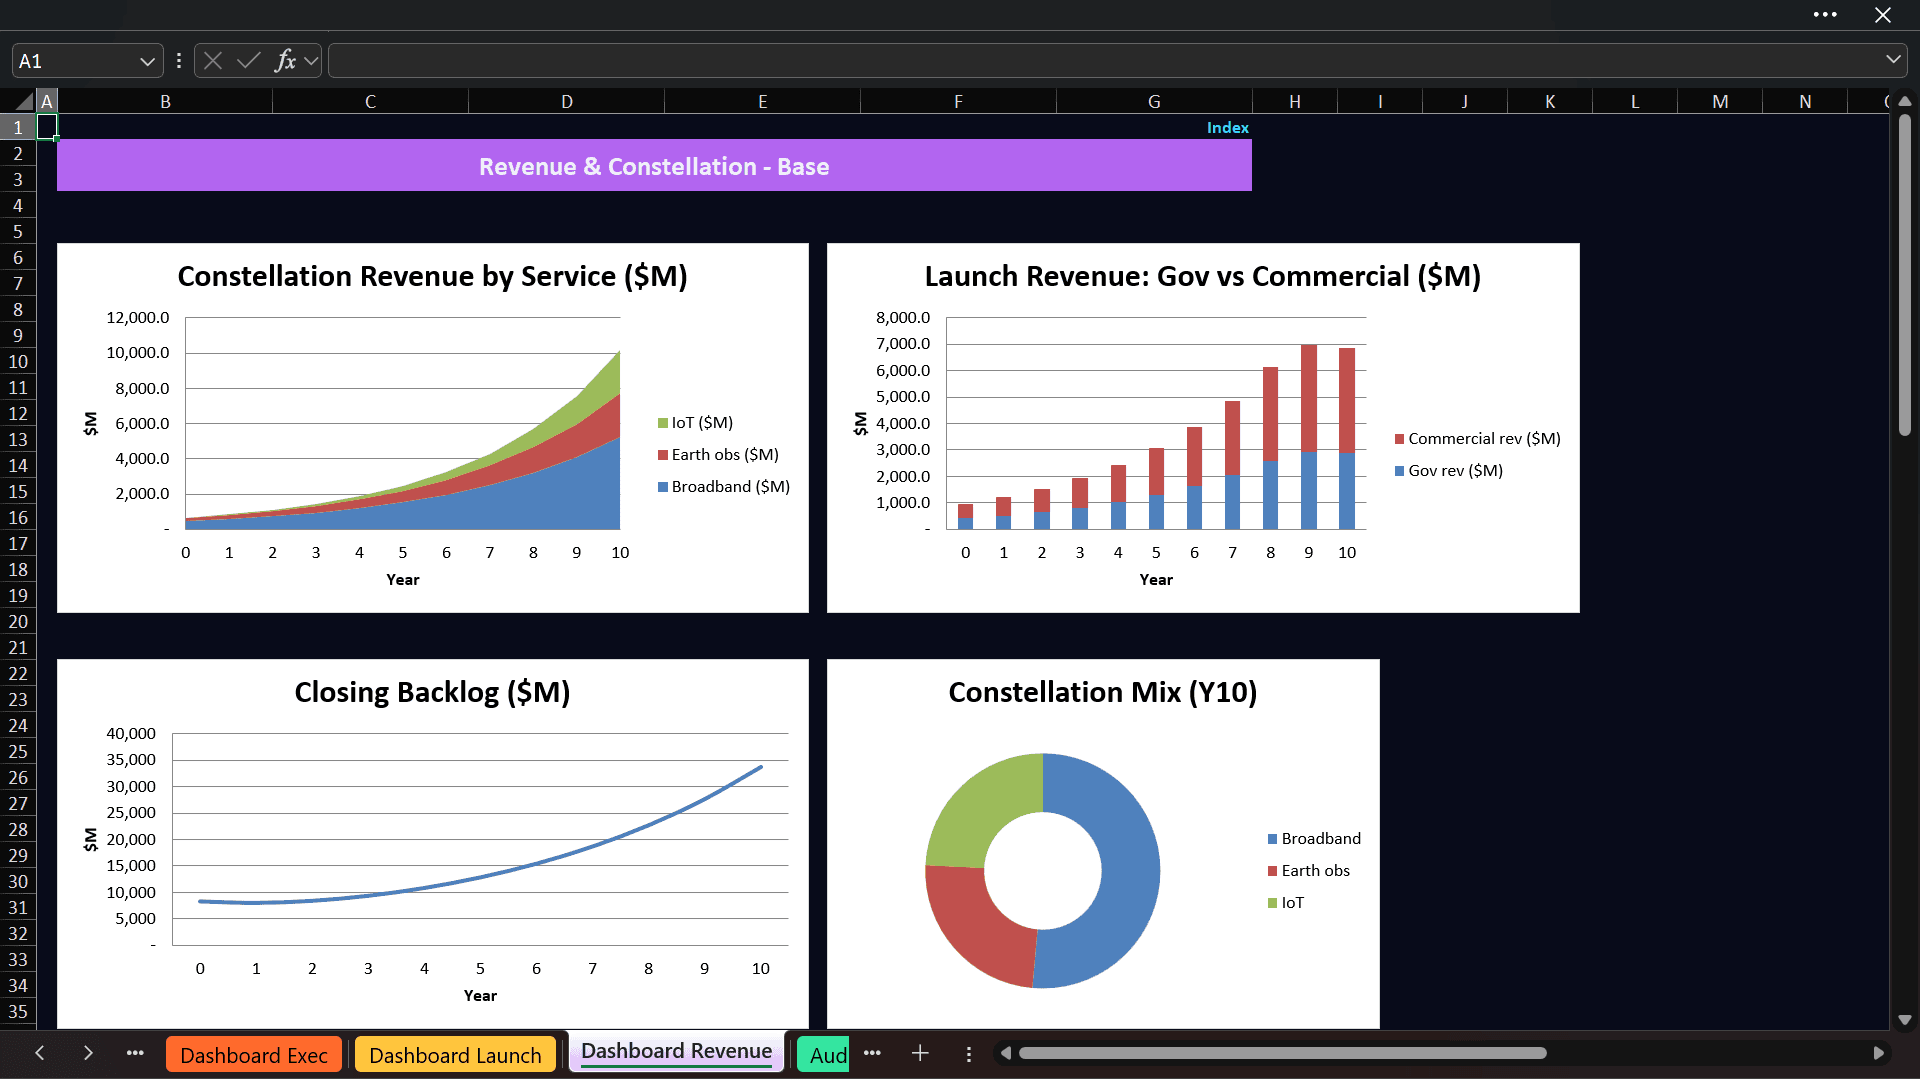
• A combined constellation revenue summary and service mix
Broadband, Earth observation, and IoT are calculated independently before flowing into total revenue. Users can evaluate a vertically integrated business or reduce the constellation inputs when focusing on launch services.
🛡️ MISSION RELIABILITY, INSURANCE & CONTRACT RISK
Launch insurance is calculated as a premium on insured value, combining launch cost and payload value. The premium rate reflects a base rate, an additional new-vehicle risk load that declines with flight heritage, and an extra load for high-value payloads.
The Mission Reliability schedule models success probability as cumulative experience increases. The model also divides launch revenue between government and commercial customers. Each stream is probability-weighted using separate realization assumptions, while the government segment can receive a gross-margin premium.
Together, these schedules help users examine how vehicle maturity, payload profile, contract quality, launch heritage, and customer mix affect risk-adjusted revenue and cost.
🏗️ OPERATING COST, CAPEX & FUNDING
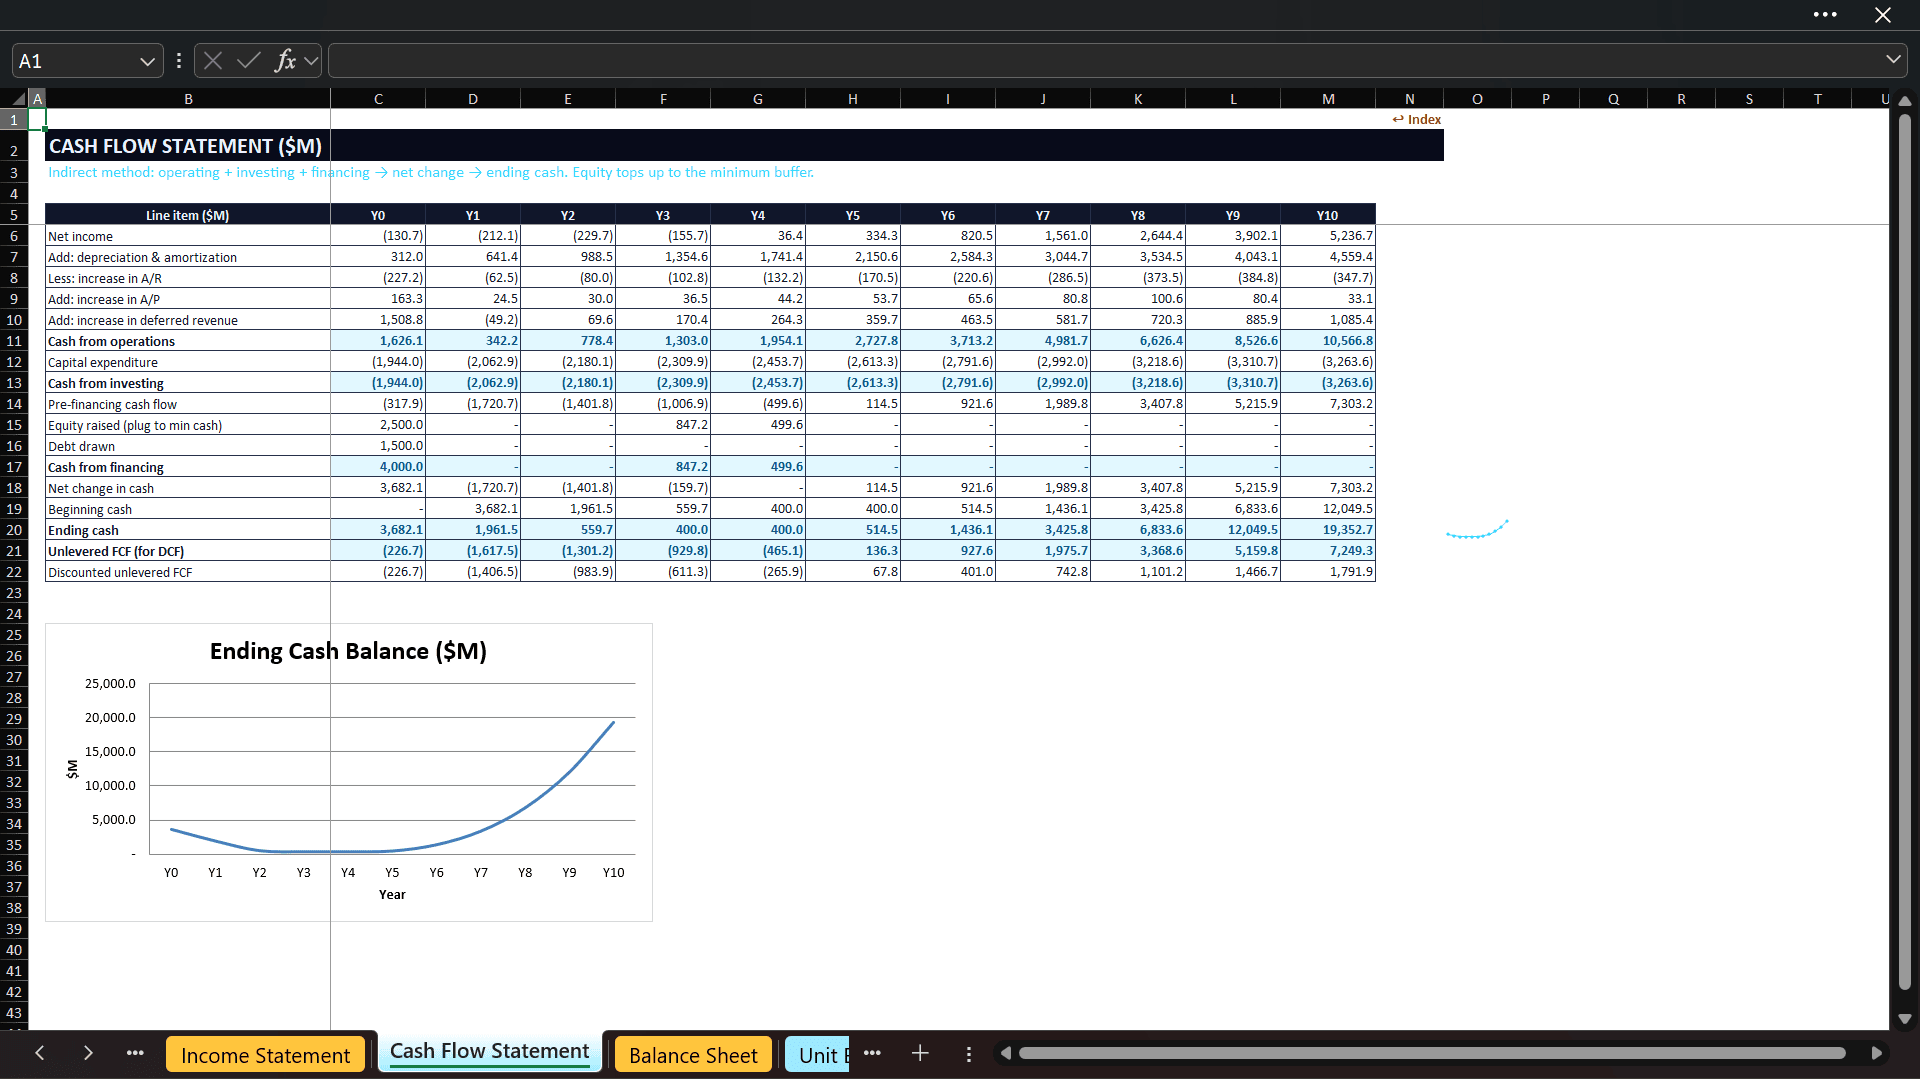
The cost schedule links launch cost, insurance, R&D, and SG&A to the revenue plan. Capex is separated between launch fleet/infrastructure and the constellation. Supporting schedules calculate working capital, depreciation, interest, and taxes. Financing assumptions include opening equity, long-term debt, customer deposits, and a minimum cash buffer. The cash-flow logic identifies equity funding required to maintain that buffer and calculates peak cumulative funding need.
🧾 FULLY LINKED THREE-STATEMENT FINANCIAL MODEL
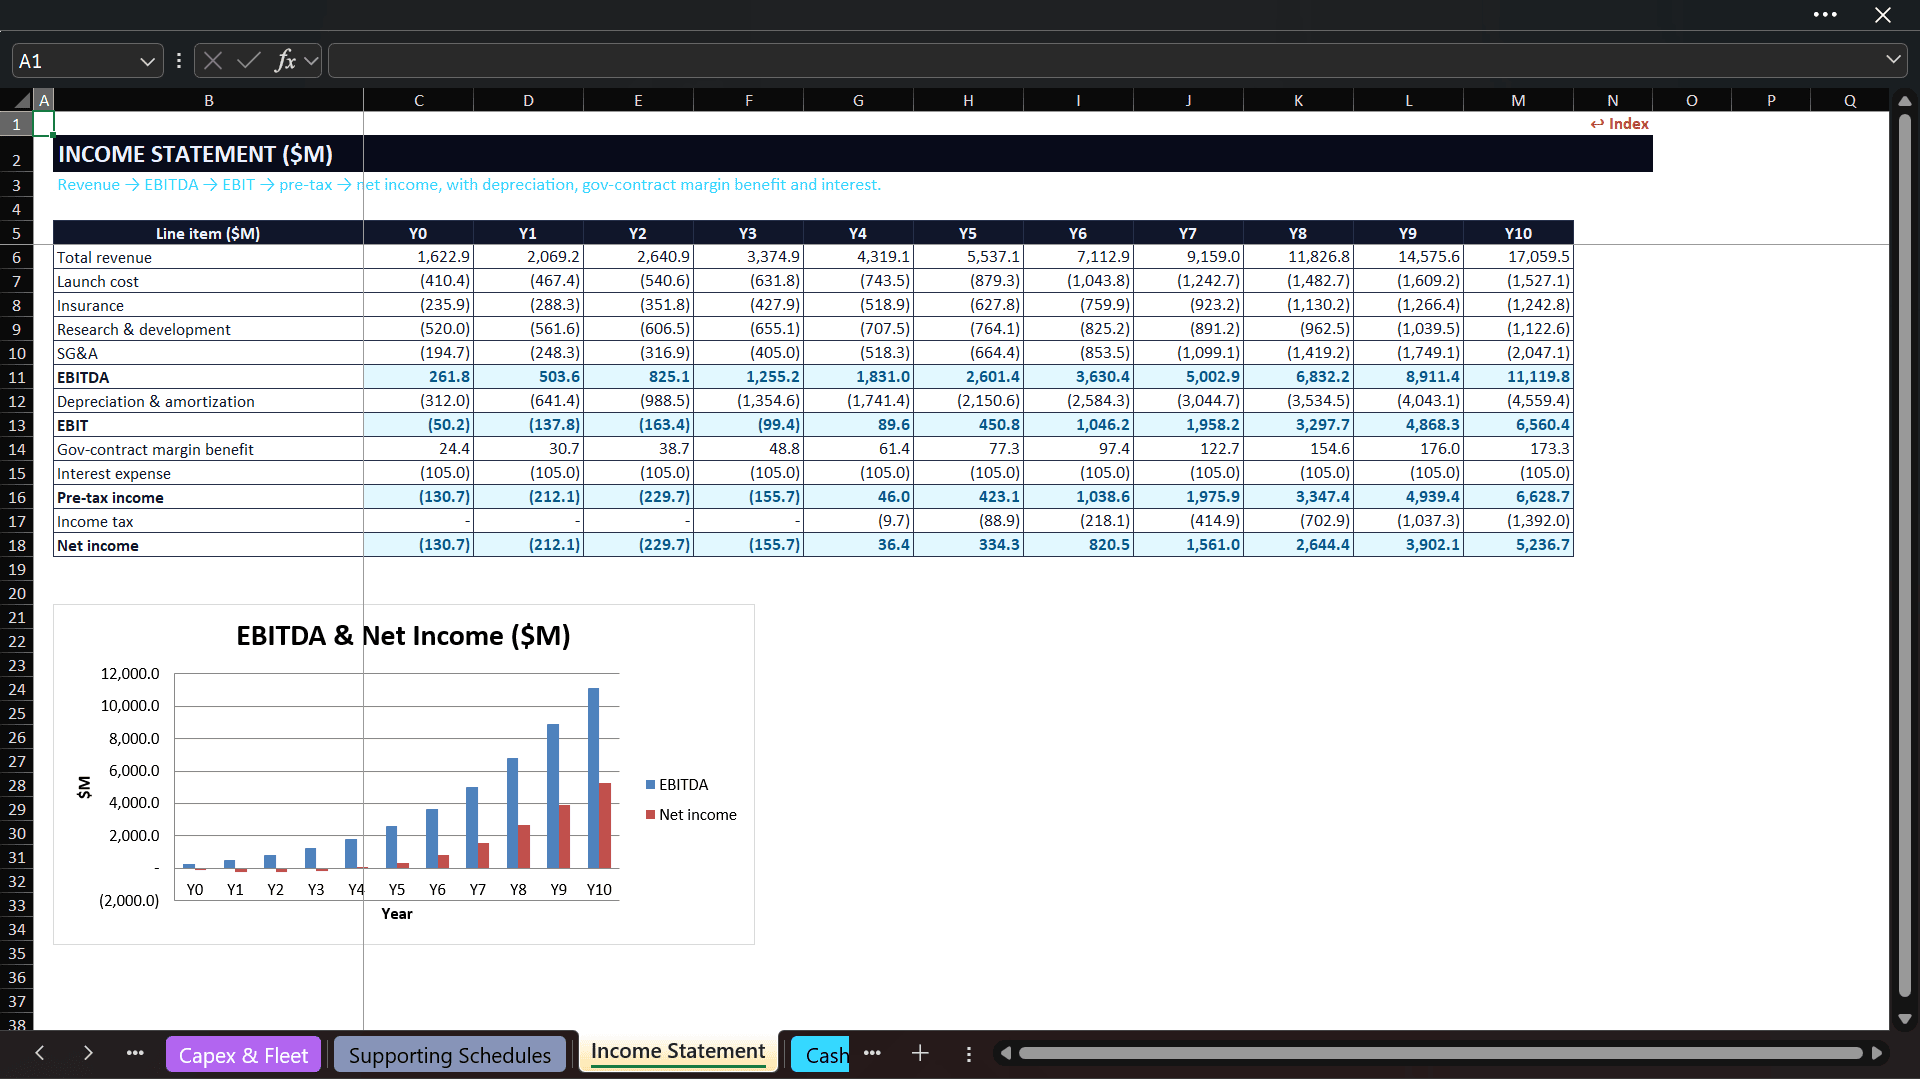
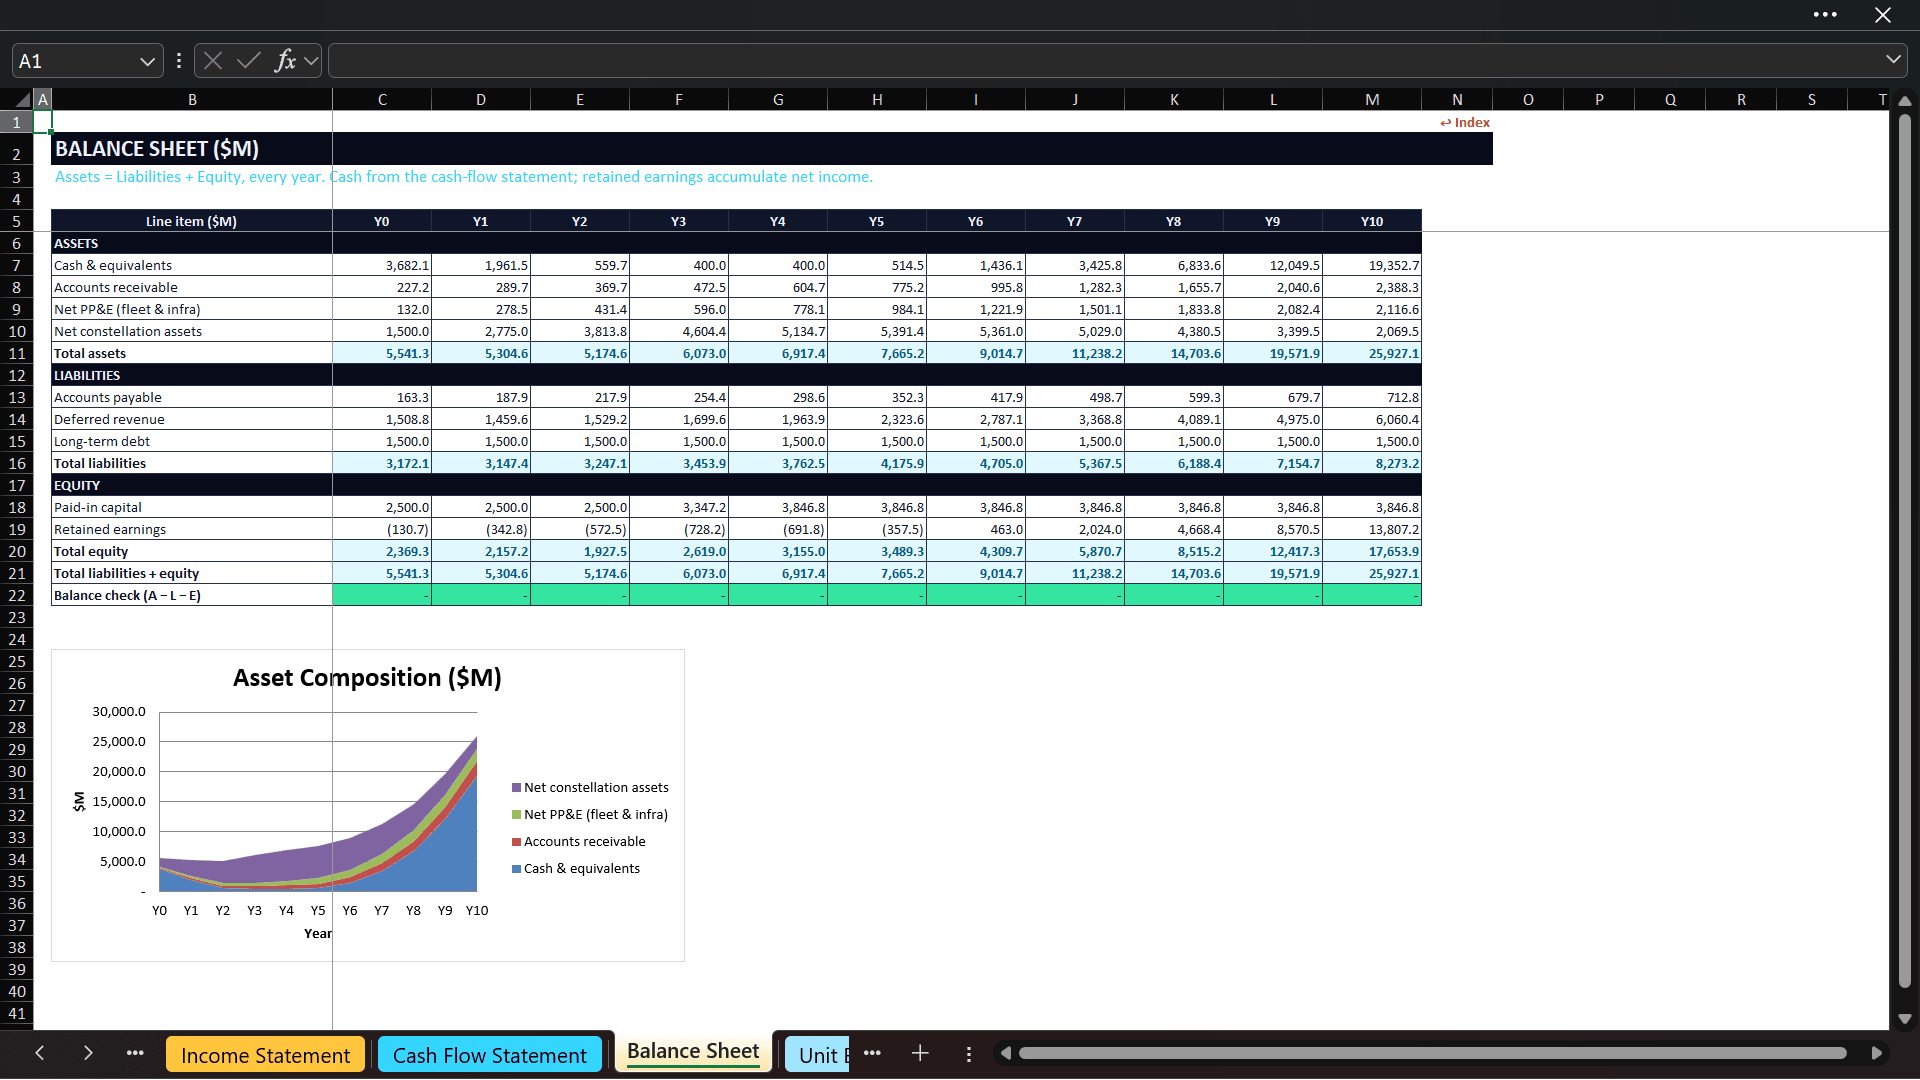
The workbook includes a linked Income Statement, Cash Flow Statement, and Balance Sheet across Y0 to Y10.
The Income Statement contains launch revenue, constellation revenue, total revenue, launch cost, insurance, R&D, SG&A, EBITDA, depreciation, EBIT, interest, taxes, and net income.
The indirect Cash Flow Statement bridges net income to operating cash flow, incorporates working capital, fleet and constellation capex, financing, and ending cash.
The Balance Sheet includes cash, receivables, fleet/infrastructure assets, constellation assets, payables, deferred revenue, debt, paid-in capital, retained earnings, and total equity. A check confirms that assets equal liabilities plus equity in every year.
💎 VALUATION, RETURNS & COMPARABLE MULTIPLES
Valuation combines an unlevered discounted cash flow with a terminal enterprise value based on an exit EV/revenue multiple. The model calculates operating NPV, discounted terminal value, enterprise value, net debt, equity value, peak funding requirement, project IRR, revenue CAGR, EBITDA margin, and implied valuation multiples.
A comparable-multiple schedule shows how alternative EV/revenue assumptions change implied exit value and present enterprise value.
🔀 BEAR, BASE & BULL SCENARIOS
The scenario selector changes five major drivers together:
• Launch cadence
• Launch pricing
• Reuse maturity
• Constellation demand
• New bookings
The active scenario feeds the full workbook. A Scenario Summary displays launch activity, cost per kilogram, launch revenue, constellation revenue, total revenue, EBITDA, and net income; the full value and return outputs are presented on the Valuation & Returns sheet.
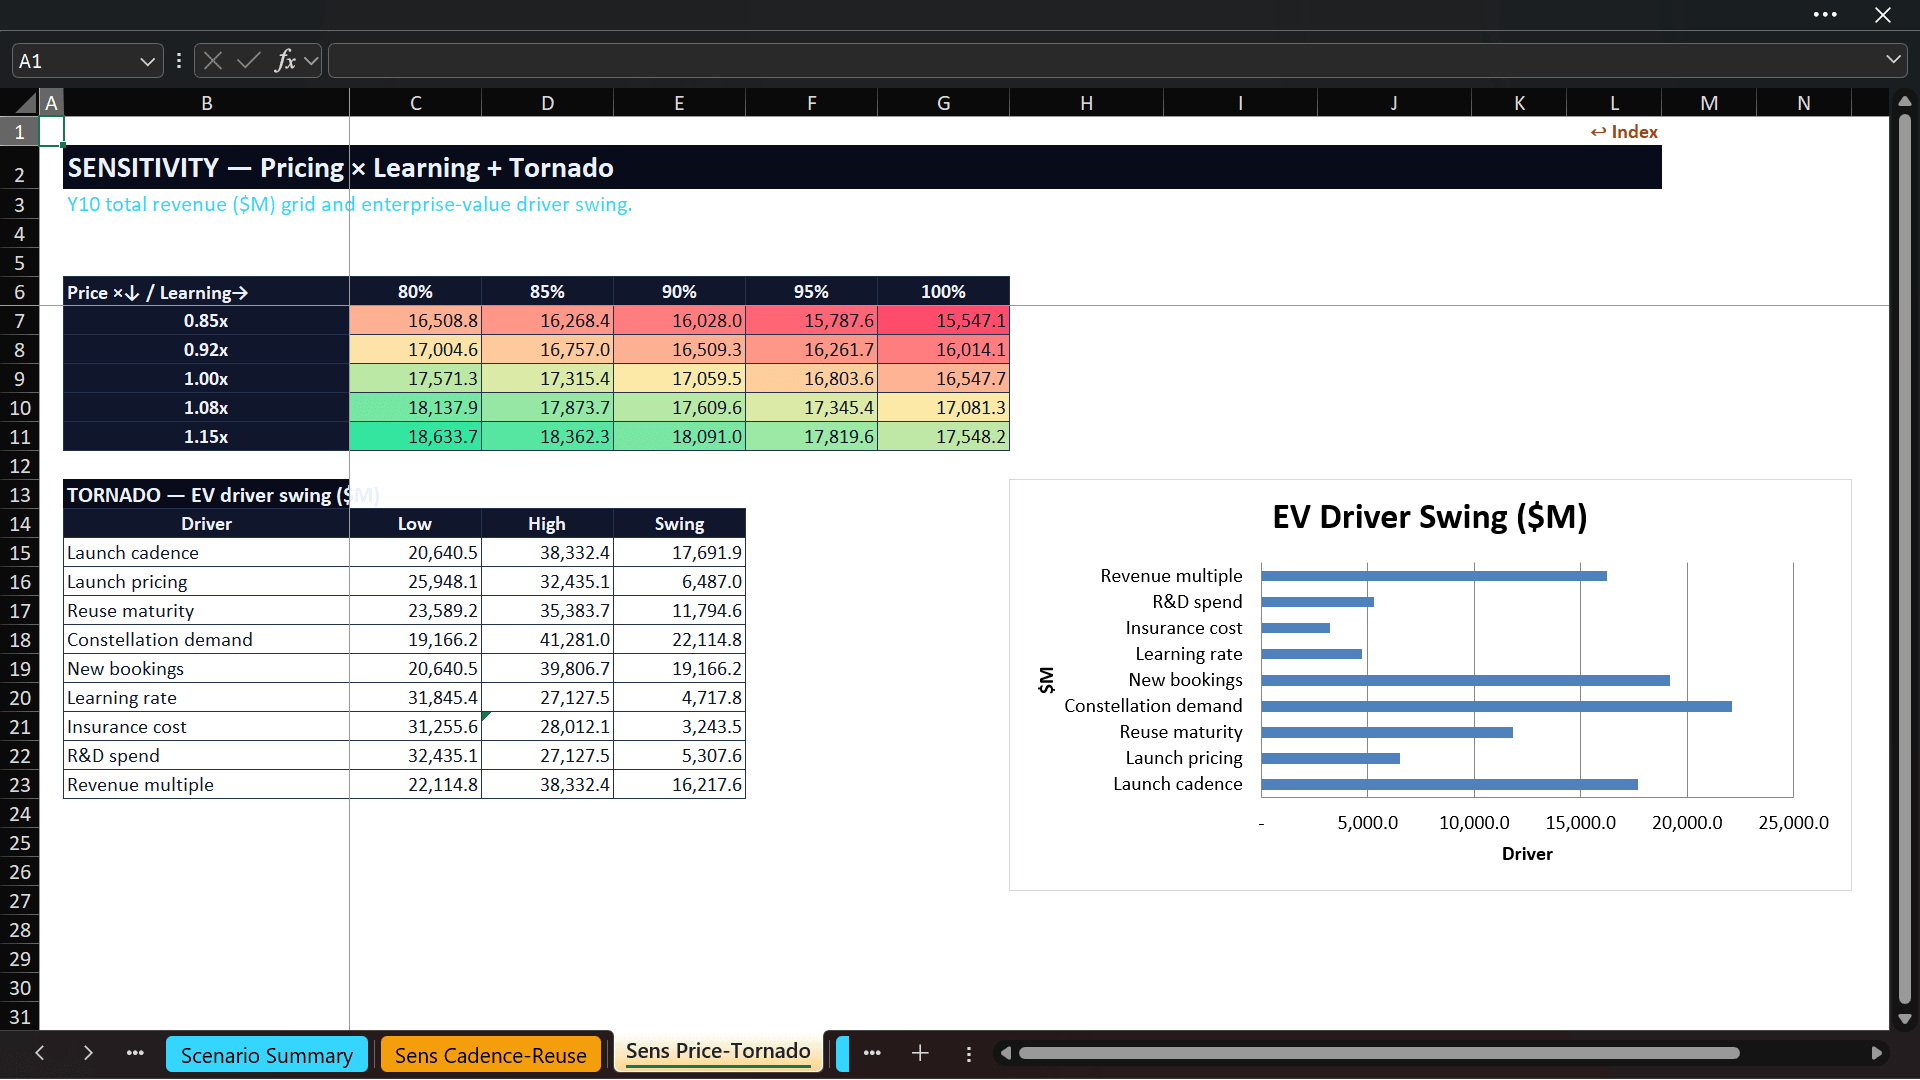
🌡️ SENSITIVITY ANALYSIS & TORNADO VIEW
The model includes a cadence-versus-reuse sensitivity table for Y10 launch gross profit and a pricing-versus-learning grid for Y10 revenue. A tornado analysis compares the enterprise-value swing caused by changes in cadence, launch pricing, reuse maturity, constellation demand, bookings, learning rate, insurance cost, R&D spending, and exit multiple.
📊 THREE DASHBOARDS, KPI SUMMARY & AUDIT CONTROLS
Three presentation-ready dashboards organize the outputs for different decision makers:
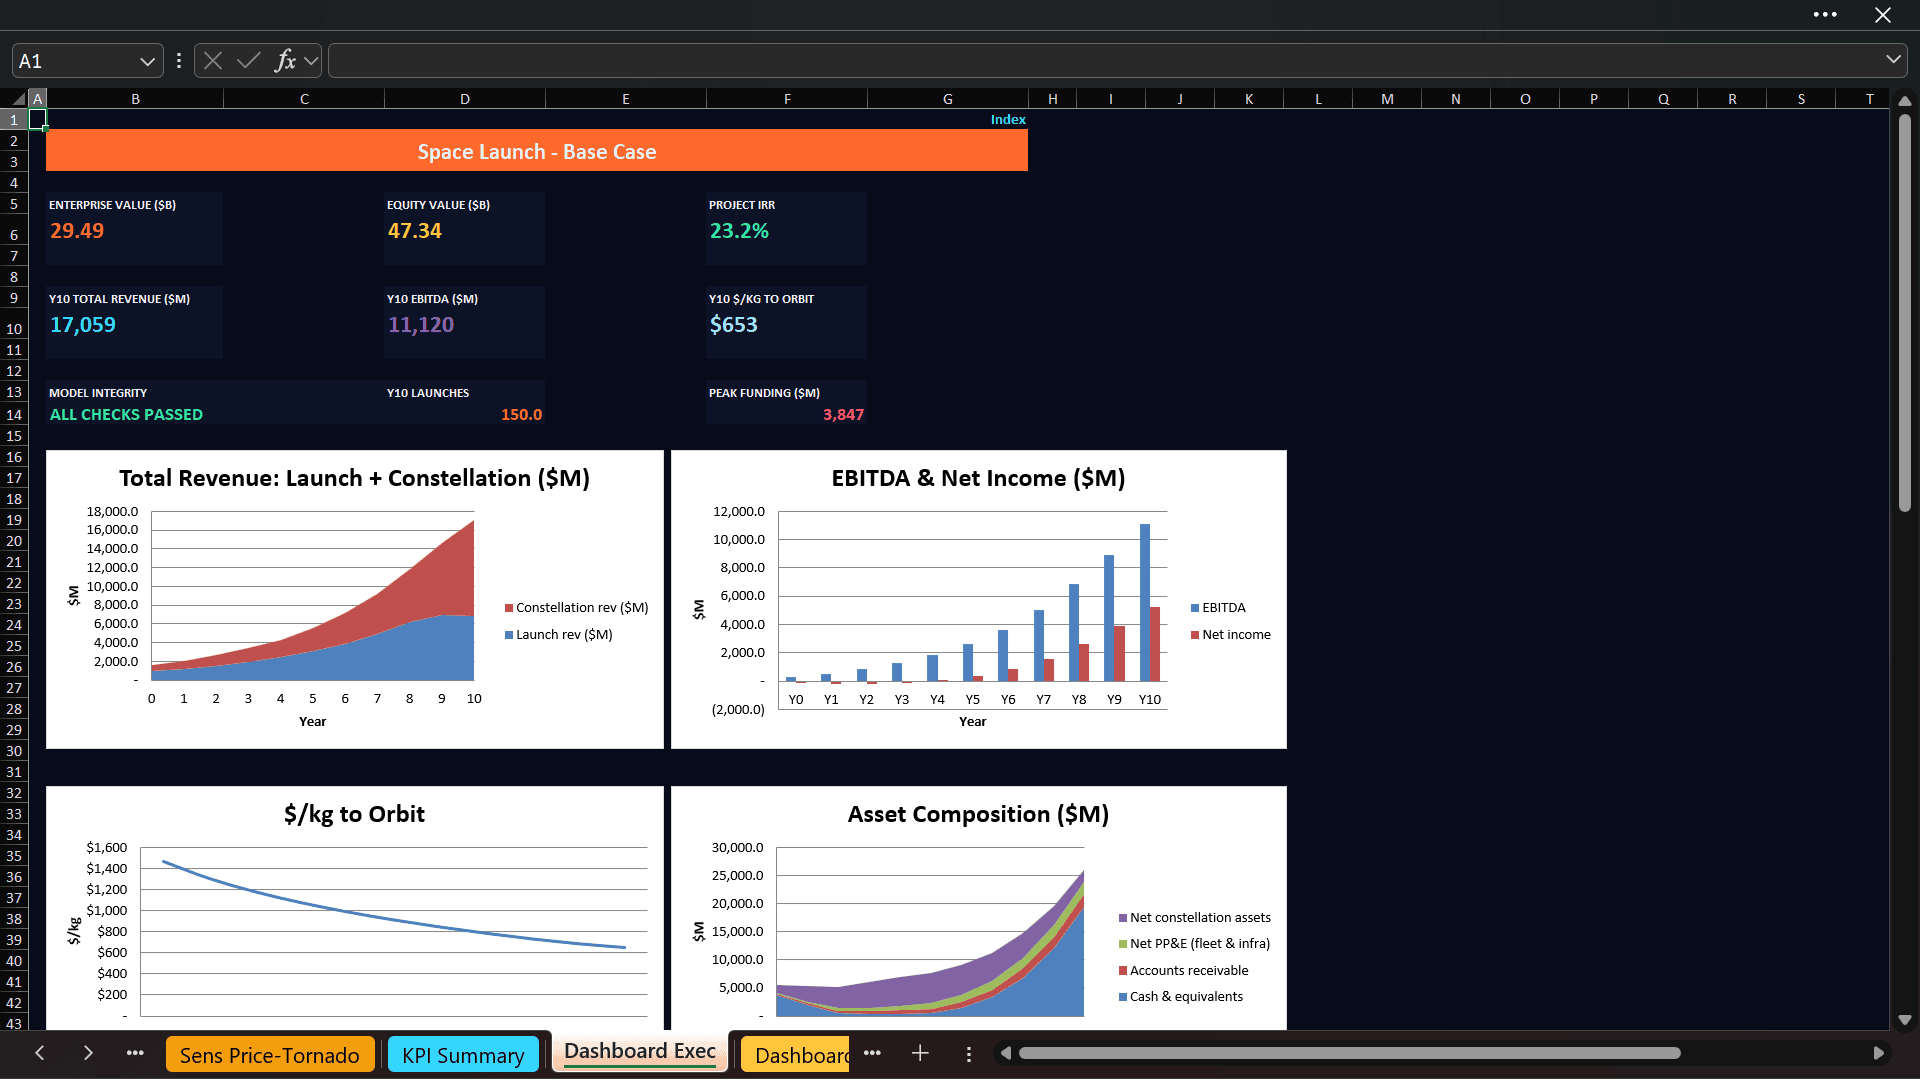
• Executive Dashboard—total revenue, earnings, cost efficiency, and asset composition
• Launch Dashboard—reuse amortization, cadence, cost per launch, and mission reliability
• Revenue Dashboard—constellation mix, launch mix, backlog, and government/commercial exposure
A KPI Summary provides a single source for headline outputs. The Audit sheet runs 25 automated checks covering revenue composition, backlog, capacity-limited revenue, contract mix, reuse amortization, unit economics, earnings, cash flow, balance-sheet ties, key bounds, and scenario validity.
⚙️ HOW TO USE THE MODEL
- Save an untouched master copy and open the working version in Microsoft Excel.
- Go to the Control Panel and edit only the orange-tinted assumption cells.
- Enter assumptions for cadence, reuse, payload, pricing, backlog, constellation demand, insurance, contract mix, operating costs, capex, financing, and valuation.
- Select Bear, Base, or Bull to test an integrated case, or adjust individual assumptions for a custom case.
- Review the launch, revenue, fleet, insurance, statement, and valuation schedules to understand the result.
- Use the dashboards, KPI Summary, scenario output, sensitivities, and tornado view for decision making and presentation.
- Confirm that the Control Panel validation flags and Audit sheet remain clear before relying on the outputs.
✅ WHY THIS MODEL IS VALUABLE
A credible space-launch model must connect capacity, reusable hardware, learning, payload economics, backlog, mission mix, reliability, insurance, downstream services, capex, funding, accounting, and valuation. This workbook supplies that integrated architecture in an editable format. Use it for business planning, fundraising preparation, feasibility assessment, investment review, budgeting, scenario analysis, commercial diligence, valuation, and internal decision support.
📦 WHAT THE BUYER RECEIVES
• One fully editable Microsoft Excel workbook
• 46 organized worksheets with navigation and instructions
• A 10-year forecast grid from Y0 through Y10
• Centralized assumptions with Bear/Base/Bull scenario selection
• Live formulas, 47 embedded charts, three dashboards, and 25 automated audit checks
• A macro-free, self-contained workbook with no external file links
• Methodology, glossary, conventions, and an illustrative-data disclaimer
Similar ProductsOther customers were also interested in...



 eFinancialModels
Electric Vehicle (EV) Charging Station Financial M...
With this comprehensive 5- or 10-year monthly tool, investors can assess the viability of setting up... Read more

Financial Model for Mobile App | Mobile App Busine...
The Mobile App Financial Plan Template in Excel allows you to develop financial projections when lau... Read more

 HenrySheykin
Food Truck Financial Model Excel Template
The Food Truck Financial Model helps entrepreneurs, founders, business owners, consultants, and anal... Read more

Green Hydrogen Production from Wind Energy Financi...
The Green Hydrogen from Wind Financial Model aims to comprehensively forecast a horizon of 40 years ... Read more

Simple Mutual Non-Disclosure Agreement Template
Protect your business secrets with ease using our Simple Mutual Non-Disclosure Agreement Template. S... Read more

Solar Energy Financial Model
The Solar Energy Financial Model Spreadsheet Template in Excel assists you in preparing a sophistica... Read more

 Peter Graf
The Customer-Centric Financial Model for Restauran...
Starting a restaurant without a financial plan is like driving a car blindfolded. You wouldn´t do i... Read more
You must log in to submit a review.