
0 ITEMS

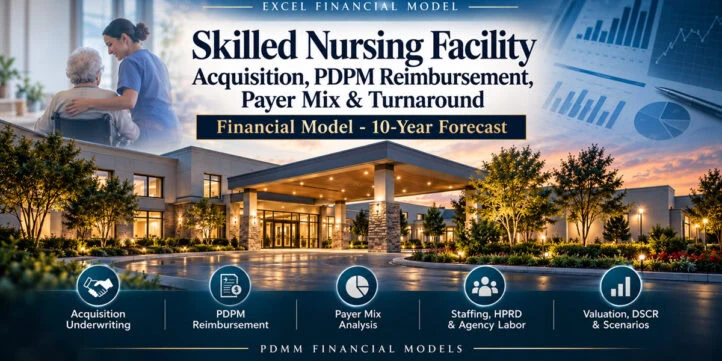
Skilled Nursing Facility Acquisition, PDPM Reimbursement, Payer Mix & Turnaround Financial Model – 10-Year Forecast
🏥 Skilled Nursing Facility Acquisition & Turnaround Decision Model Underwriting a skilled nursing facility requires more than a simple occupancy forecast. Revenue depends on payer mix, Medicare FFS PDPM economics, Medicare Advantage contracting, Medicaid and private-pay rates, while labor economics are driven by HPRD, wage levels, benefits, agency utilization and turnover. At the same time, an acquisition buyer must understand debt capacity, working capital, renovation requirements, downside coverage, exit value and the operational initiatives needed to move from current performance to a credible stabilized case.
🏥 Skilled Nursing Facility Acquisition & Turnaround Decision Model
Underwriting a skilled nursing facility requires more than a simple occupancy forecast. Revenue depends on payer mix, Medicare FFS PDPM economics, Medicare Advantage contracting, Medicaid and private-pay rates, while labor economics are driven by HPRD, wage levels, benefits, agency utilization and turnover. At the same time, an acquisition buyer must understand debt capacity, working capital, renovation requirements, downside coverage, exit value and the operational initiatives needed to move from current performance to a credible stabilized case.
This 10-year Skilled Nursing Facility Acquisition, PDPM Reimbursement, Payer Mix & Turnaround Financial Model brings those decisions into one fully linked Excel system. It is designed for operators, acquisition teams, healthcare investors, independent sponsors, lenders, advisors and management teams evaluating an existing nursing facility rather than relying on a generic nursing-home forecast.
🎯 What decisions can the model support?
The workbook helps answer practical transaction and operating questions such as:
- Should the facility be acquired at the proposed purchase price?
- How quickly must occupancy recover for the investment case to work?
- How does Medicare FFS compare with Medicare Advantage, Medicaid, private pay and other payers?
- What PDPM assumptions drive the Medicare FFS daily rate?
- How much EBITDA depends on reducing agency labor or controlling wage inflation?
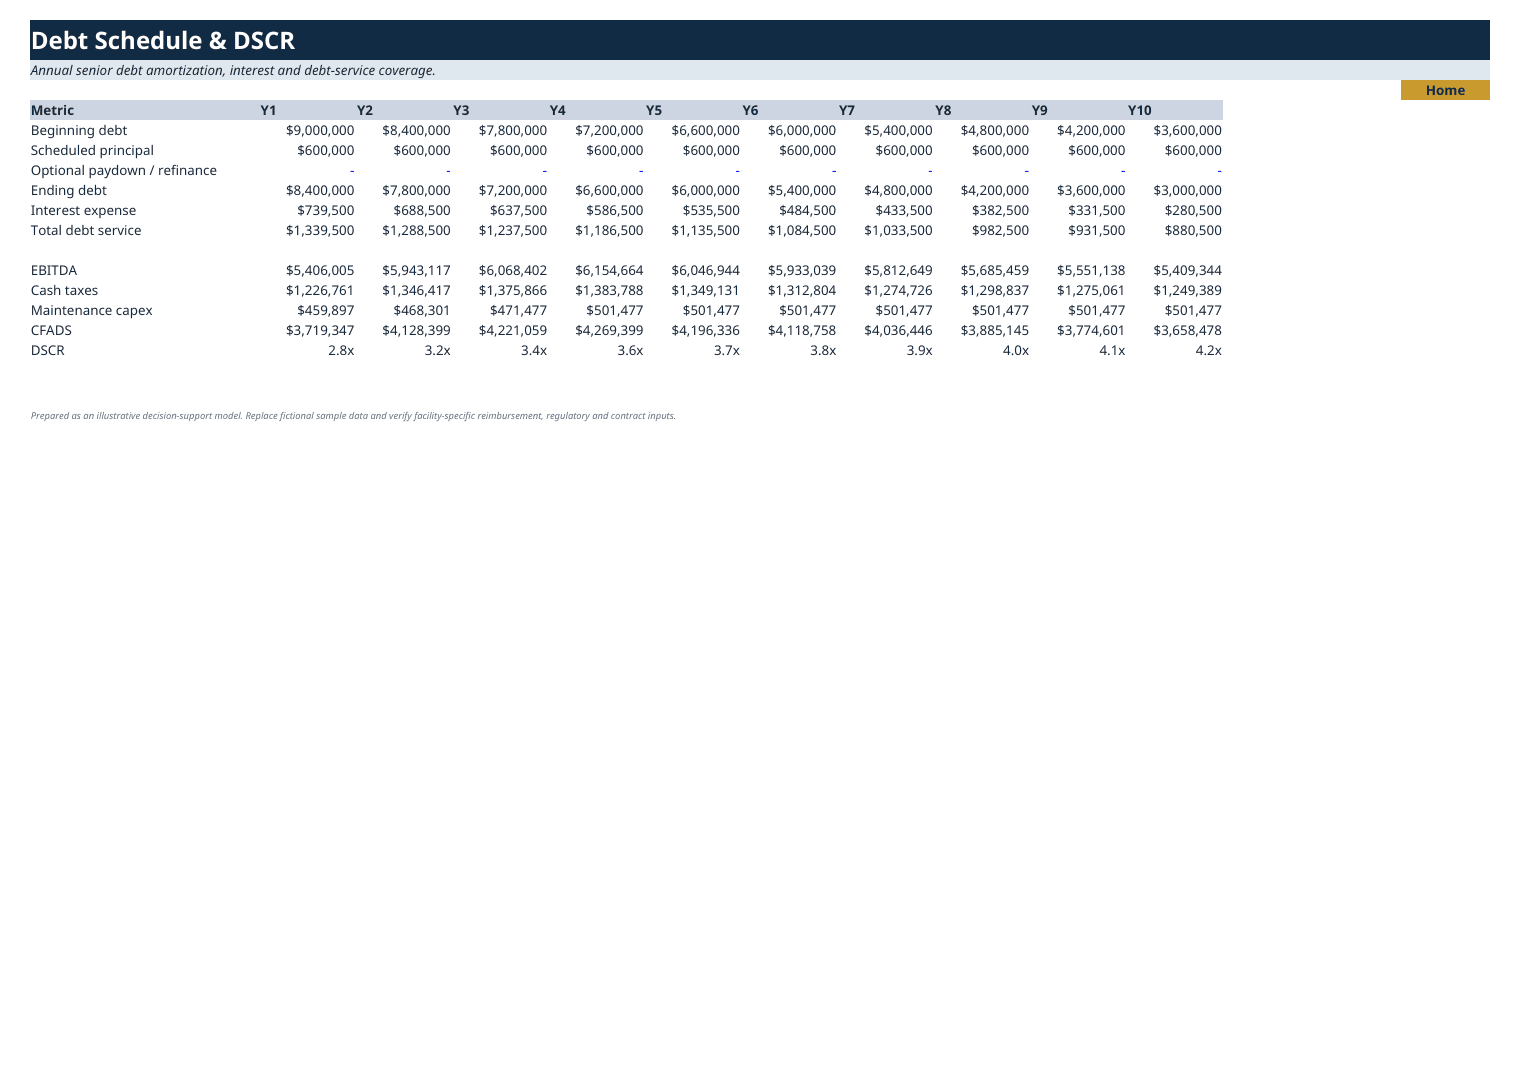
- What level of debt can the facility support while maintaining adequate DSCR?
- Which turnaround initiatives create the most EBITDA and cash-flow value?
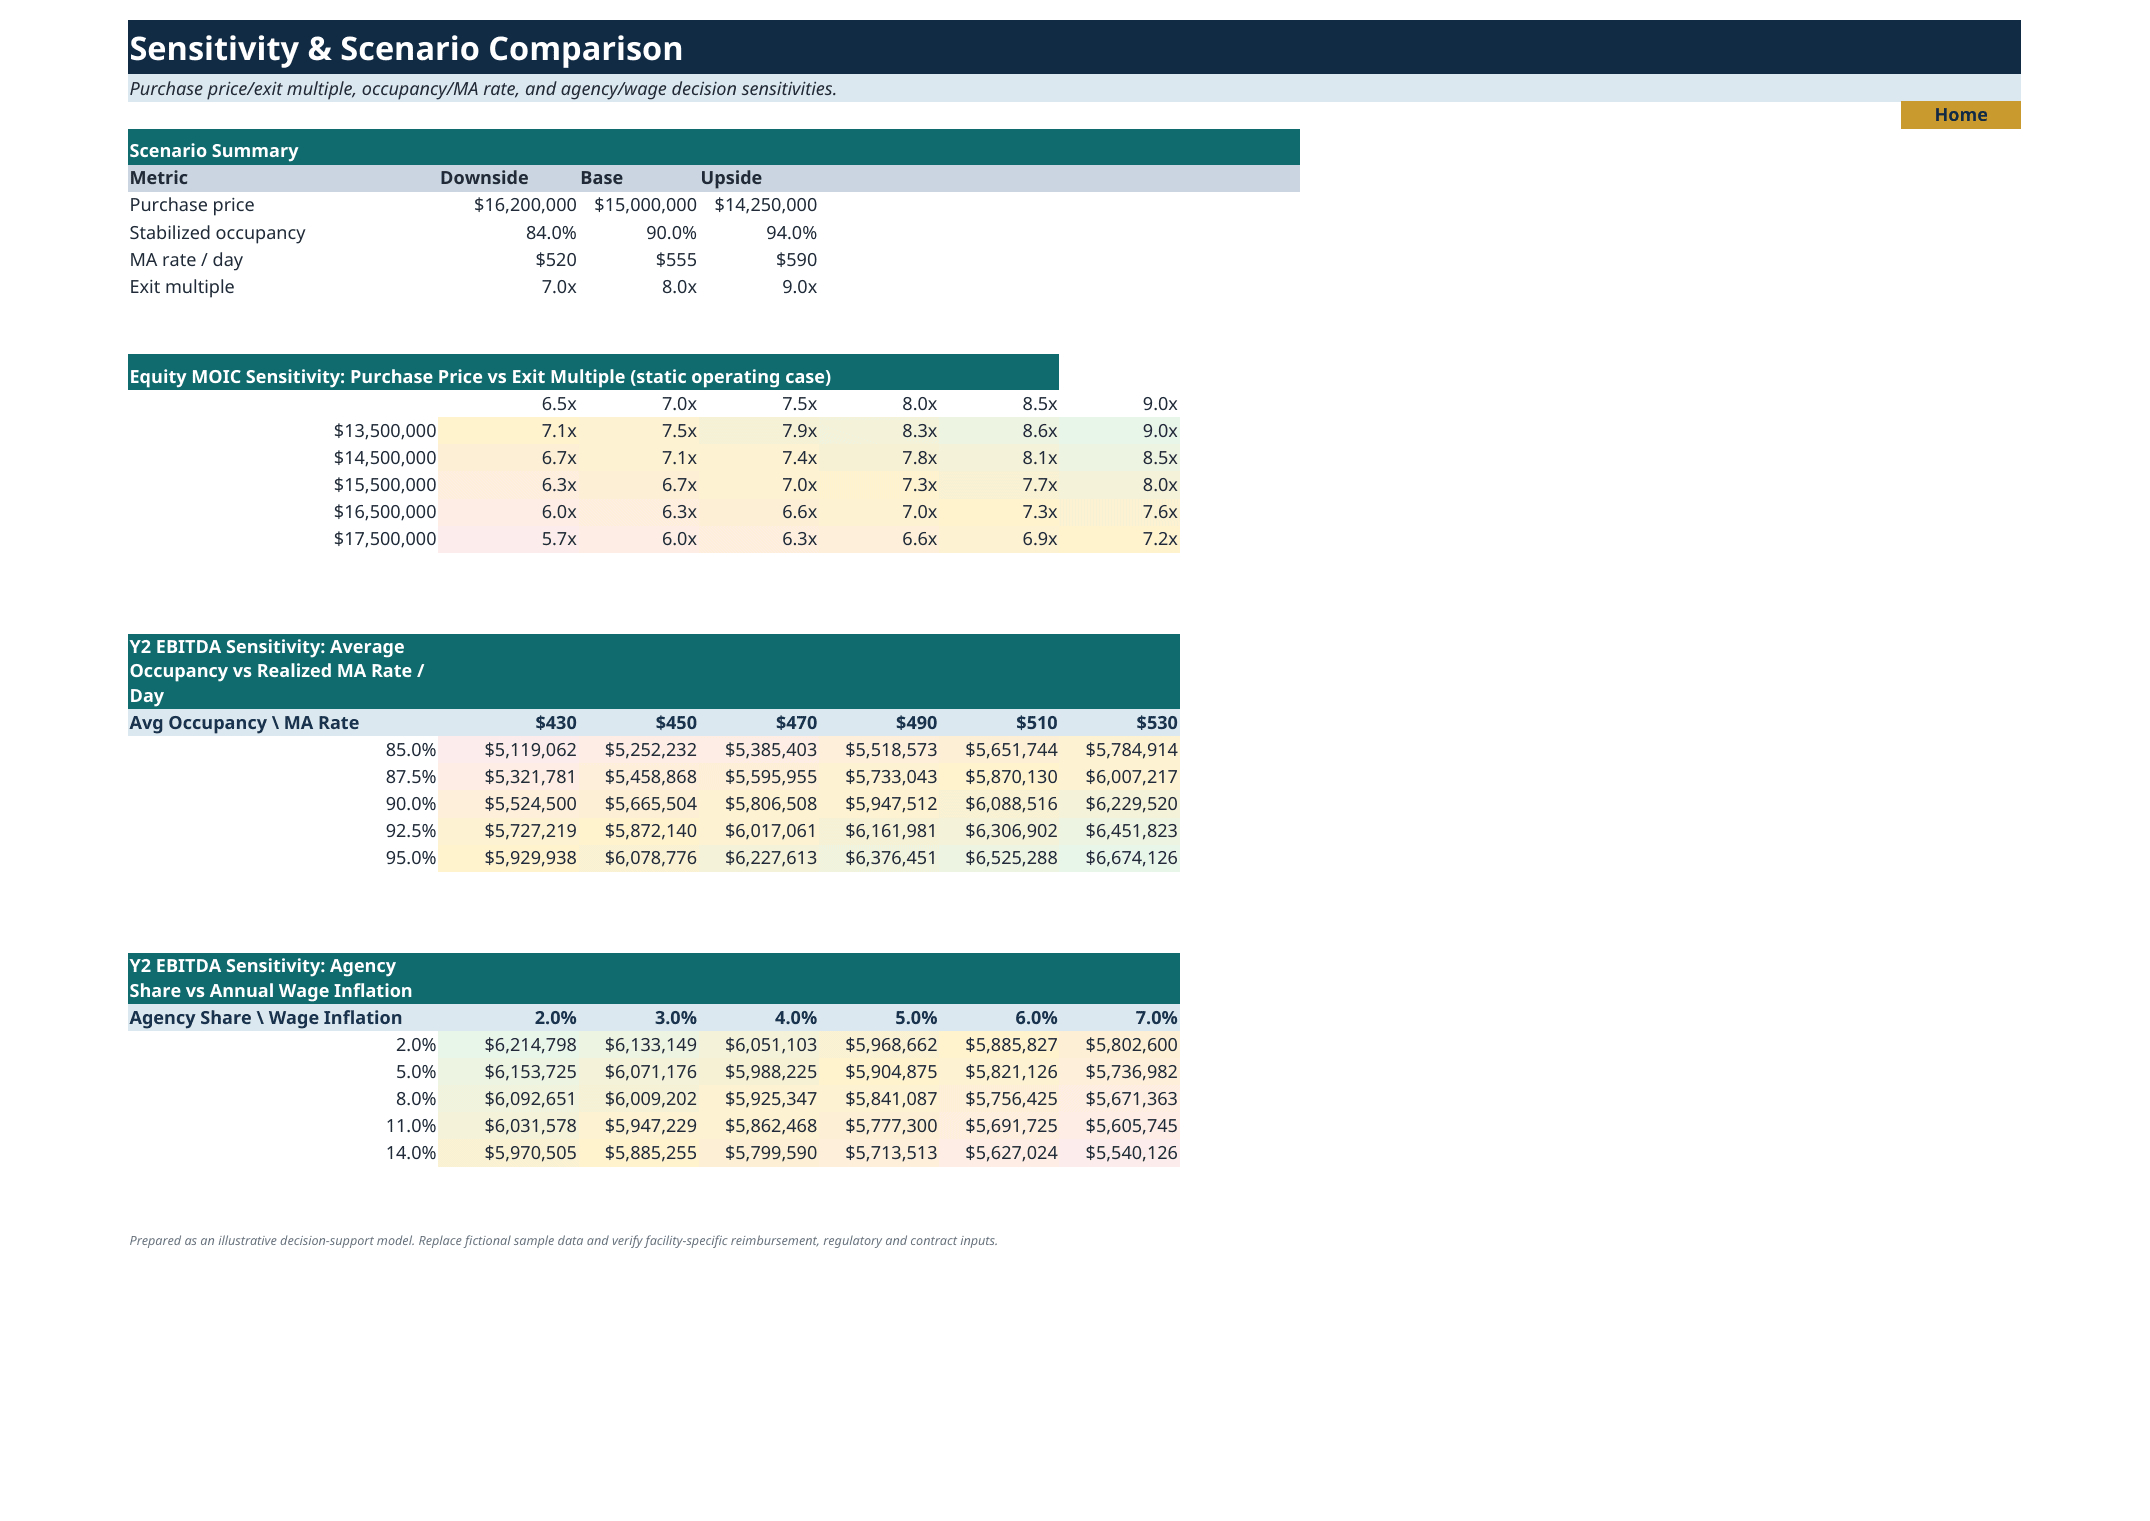
- How sensitive are returns to purchase price, exit multiple, occupancy, MA rates, wages and agency utilization?
- What do the Downside, Base and Upside cases imply for operating performance and investor returns?
⚙️ Editable assumptions and operating drivers
All principal business assumptions are centralized in the scenario manager. The sample Base case can be replaced with facility-specific information, while Downside and Upside columns allow fast stress testing. Editable drivers include licensed and available beds, opening and stabilized occupancy, occupancy ramp timing, payer shares, reimbursement benchmarks, Medicaid and private-pay rates, RN/LPN/CNA/therapy HPRD, hourly wages, benefits burden, agency labor share and premium, wage and operating-cost inflation, VBP payment multiplier, purchase price, transaction costs, renovation capex, leverage, interest rate, amortization term, exit multiple, discount rate, tax rate and exit year.
The workbook contains coherent fictional sample data so every schedule, dashboard, scenario and sensitivity is immediately demonstrable.
🔄 Model workflow
1. Set the transaction and scenario assumptions. Select Downside, Base or Upside and update acquisition, operating and financing inputs.
2. Review historical / run-rate performance. The historical input sheet frames current revenue, costs and normalized EBITDA.
3. Build census and reimbursement. Monthly census, occupancy, resident days and payer mix feed the reimbursement schedules.
4. Model labor and quality economics. HPRD and wage assumptions translate resident volume into employee and agency labor costs, while VBP assumptions show quality-linked Medicare economics.
5. Apply turnaround initiatives. The 24-month turnaround schedule organizes occupancy, payer, labor, quality and operating initiatives.
6. Review financing and financial statements. Sources & uses, debt, DSCR, income statement, balance sheet and cash flow are fully linked.
7. Evaluate valuation and risk. DCF, exit value, MOIC, IRR proxy, scenario comparisons and two-way sensitivities support the final acquisition decision.
📚 28-sheet architecture
Orientation, control and acquisition framing
- 00 Cover & Nav – model promise, workflow, model metadata and internal navigation.
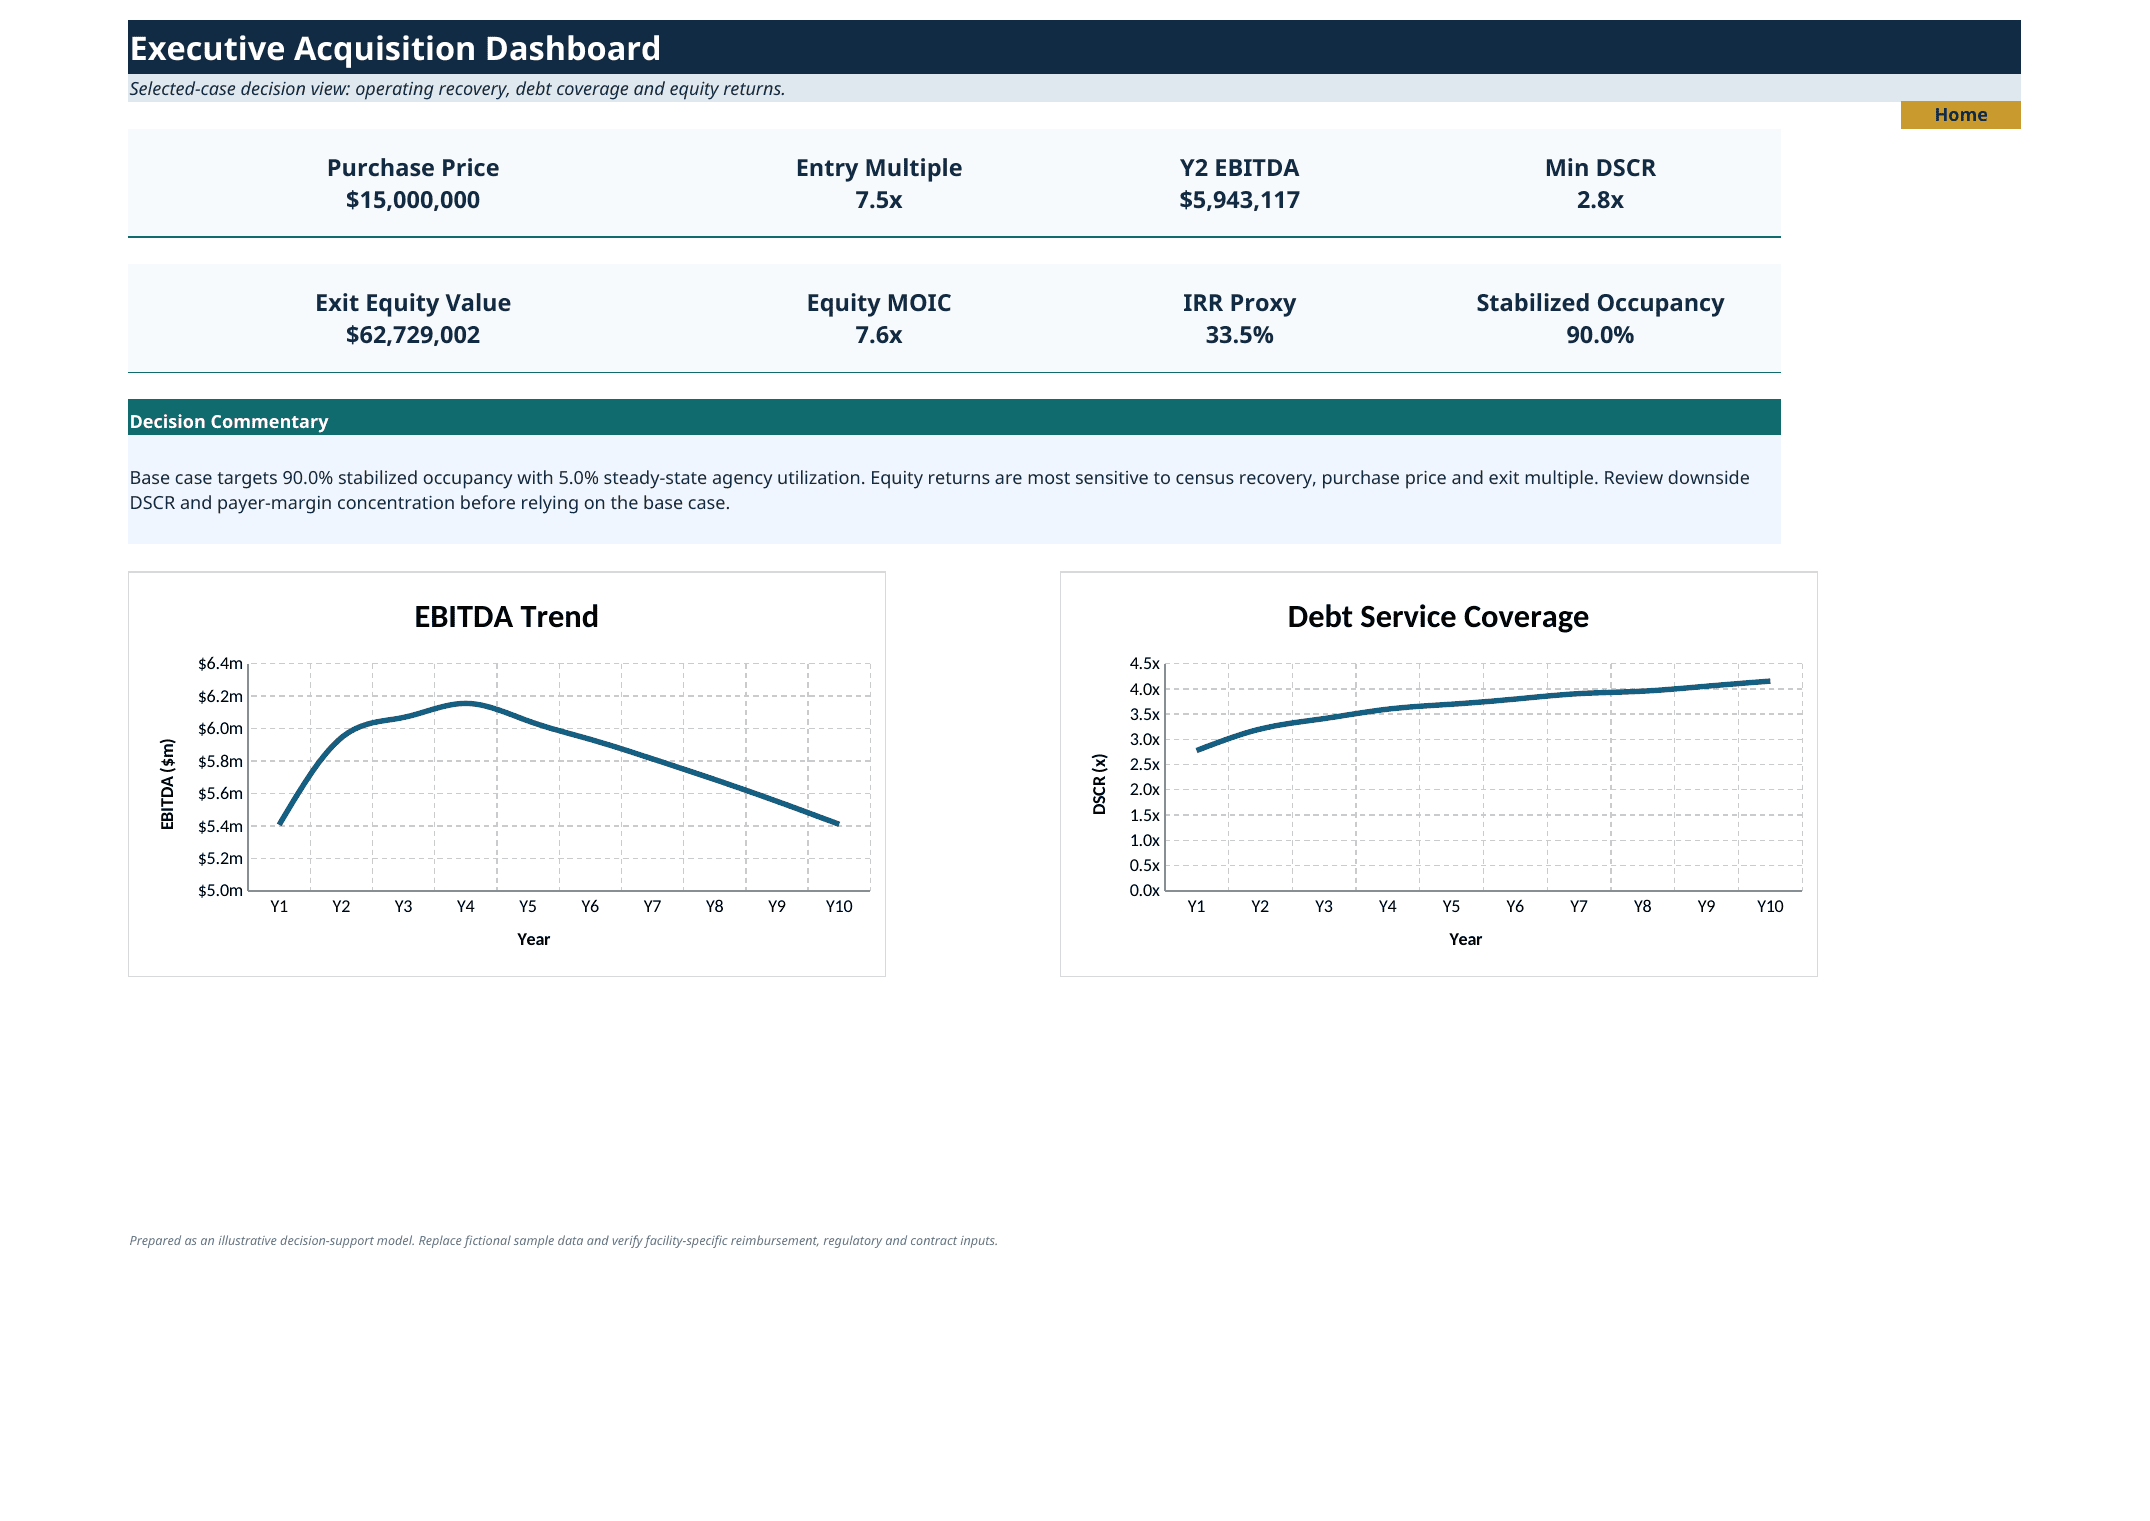
- 01 Executive Dashboard – purchase price, entry multiple, EBITDA, DSCR, exit equity value, MOIC, IRR proxy, stabilized occupancy and decision commentary.
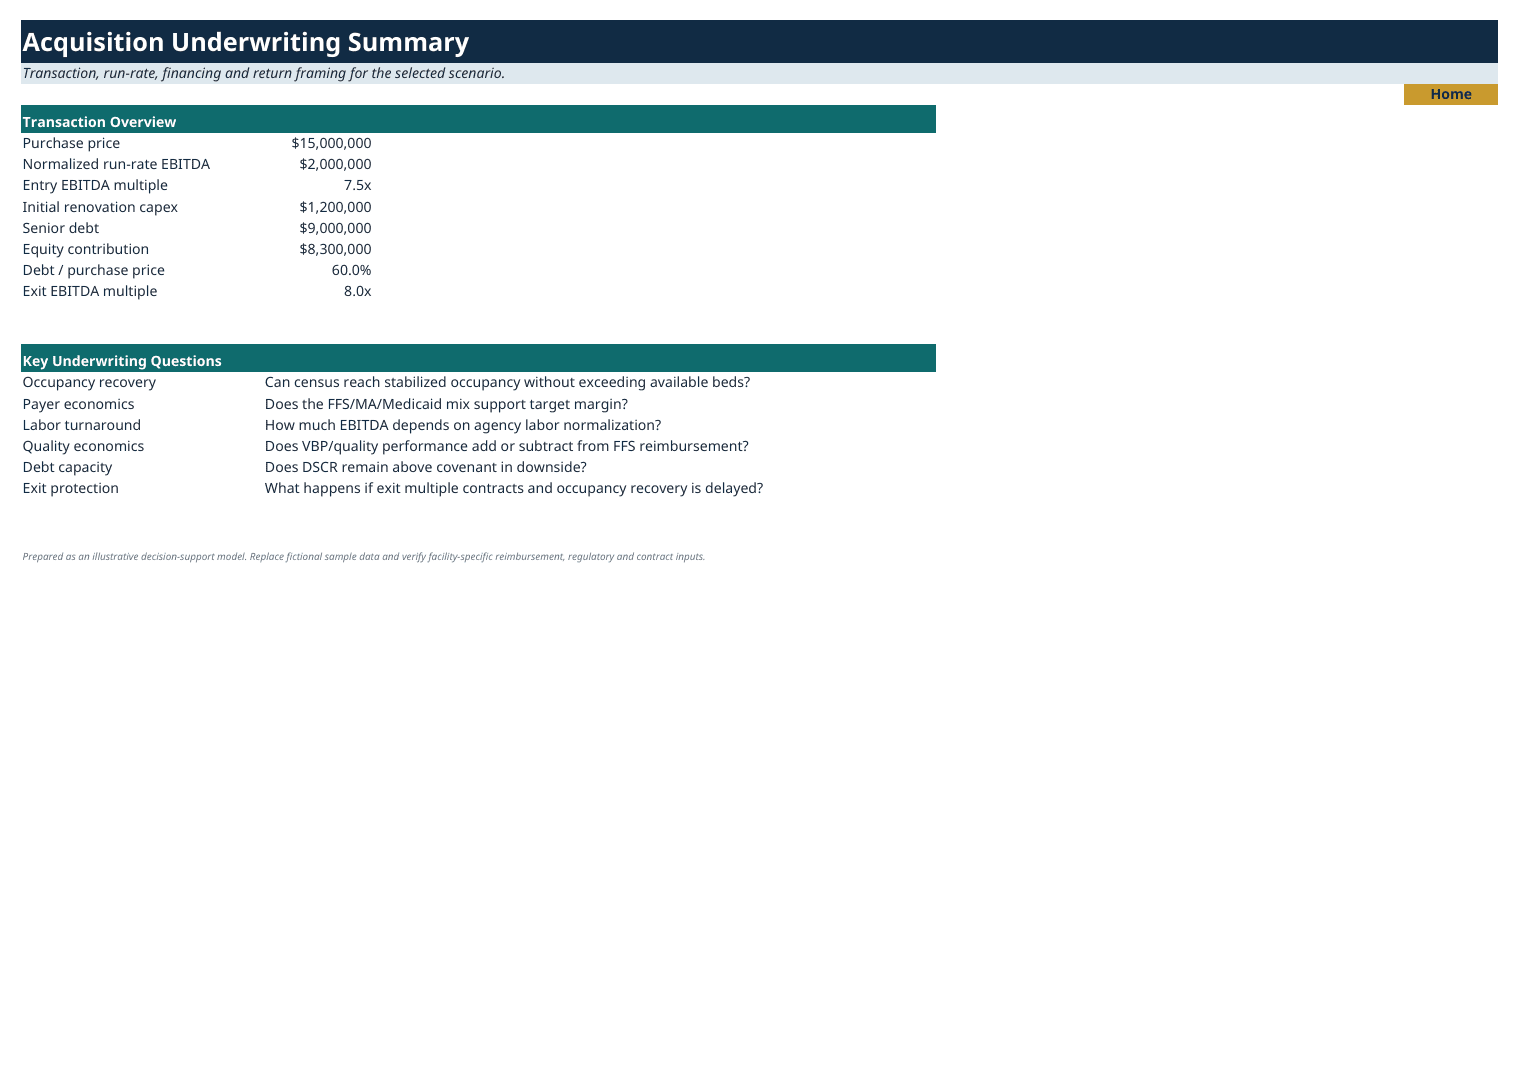
- 02 Acquisition Summary – purchase price, normalized run-rate EBITDA, leverage, renovation capex, entry/exit multiples and key underwriting questions.
- 03 Global Assumptions – centralized Downside / Base / Upside scenario manager and integrity checks.
- 04 Historical Input – historical / run-rate operating inputs and normalized EBITDA bridge.
Census and reimbursement engines
- 05 Census & LOS – 36-month census, occupancy, occupied beds, resident days, admissions and length-of-stay engine followed by Years 4-10.
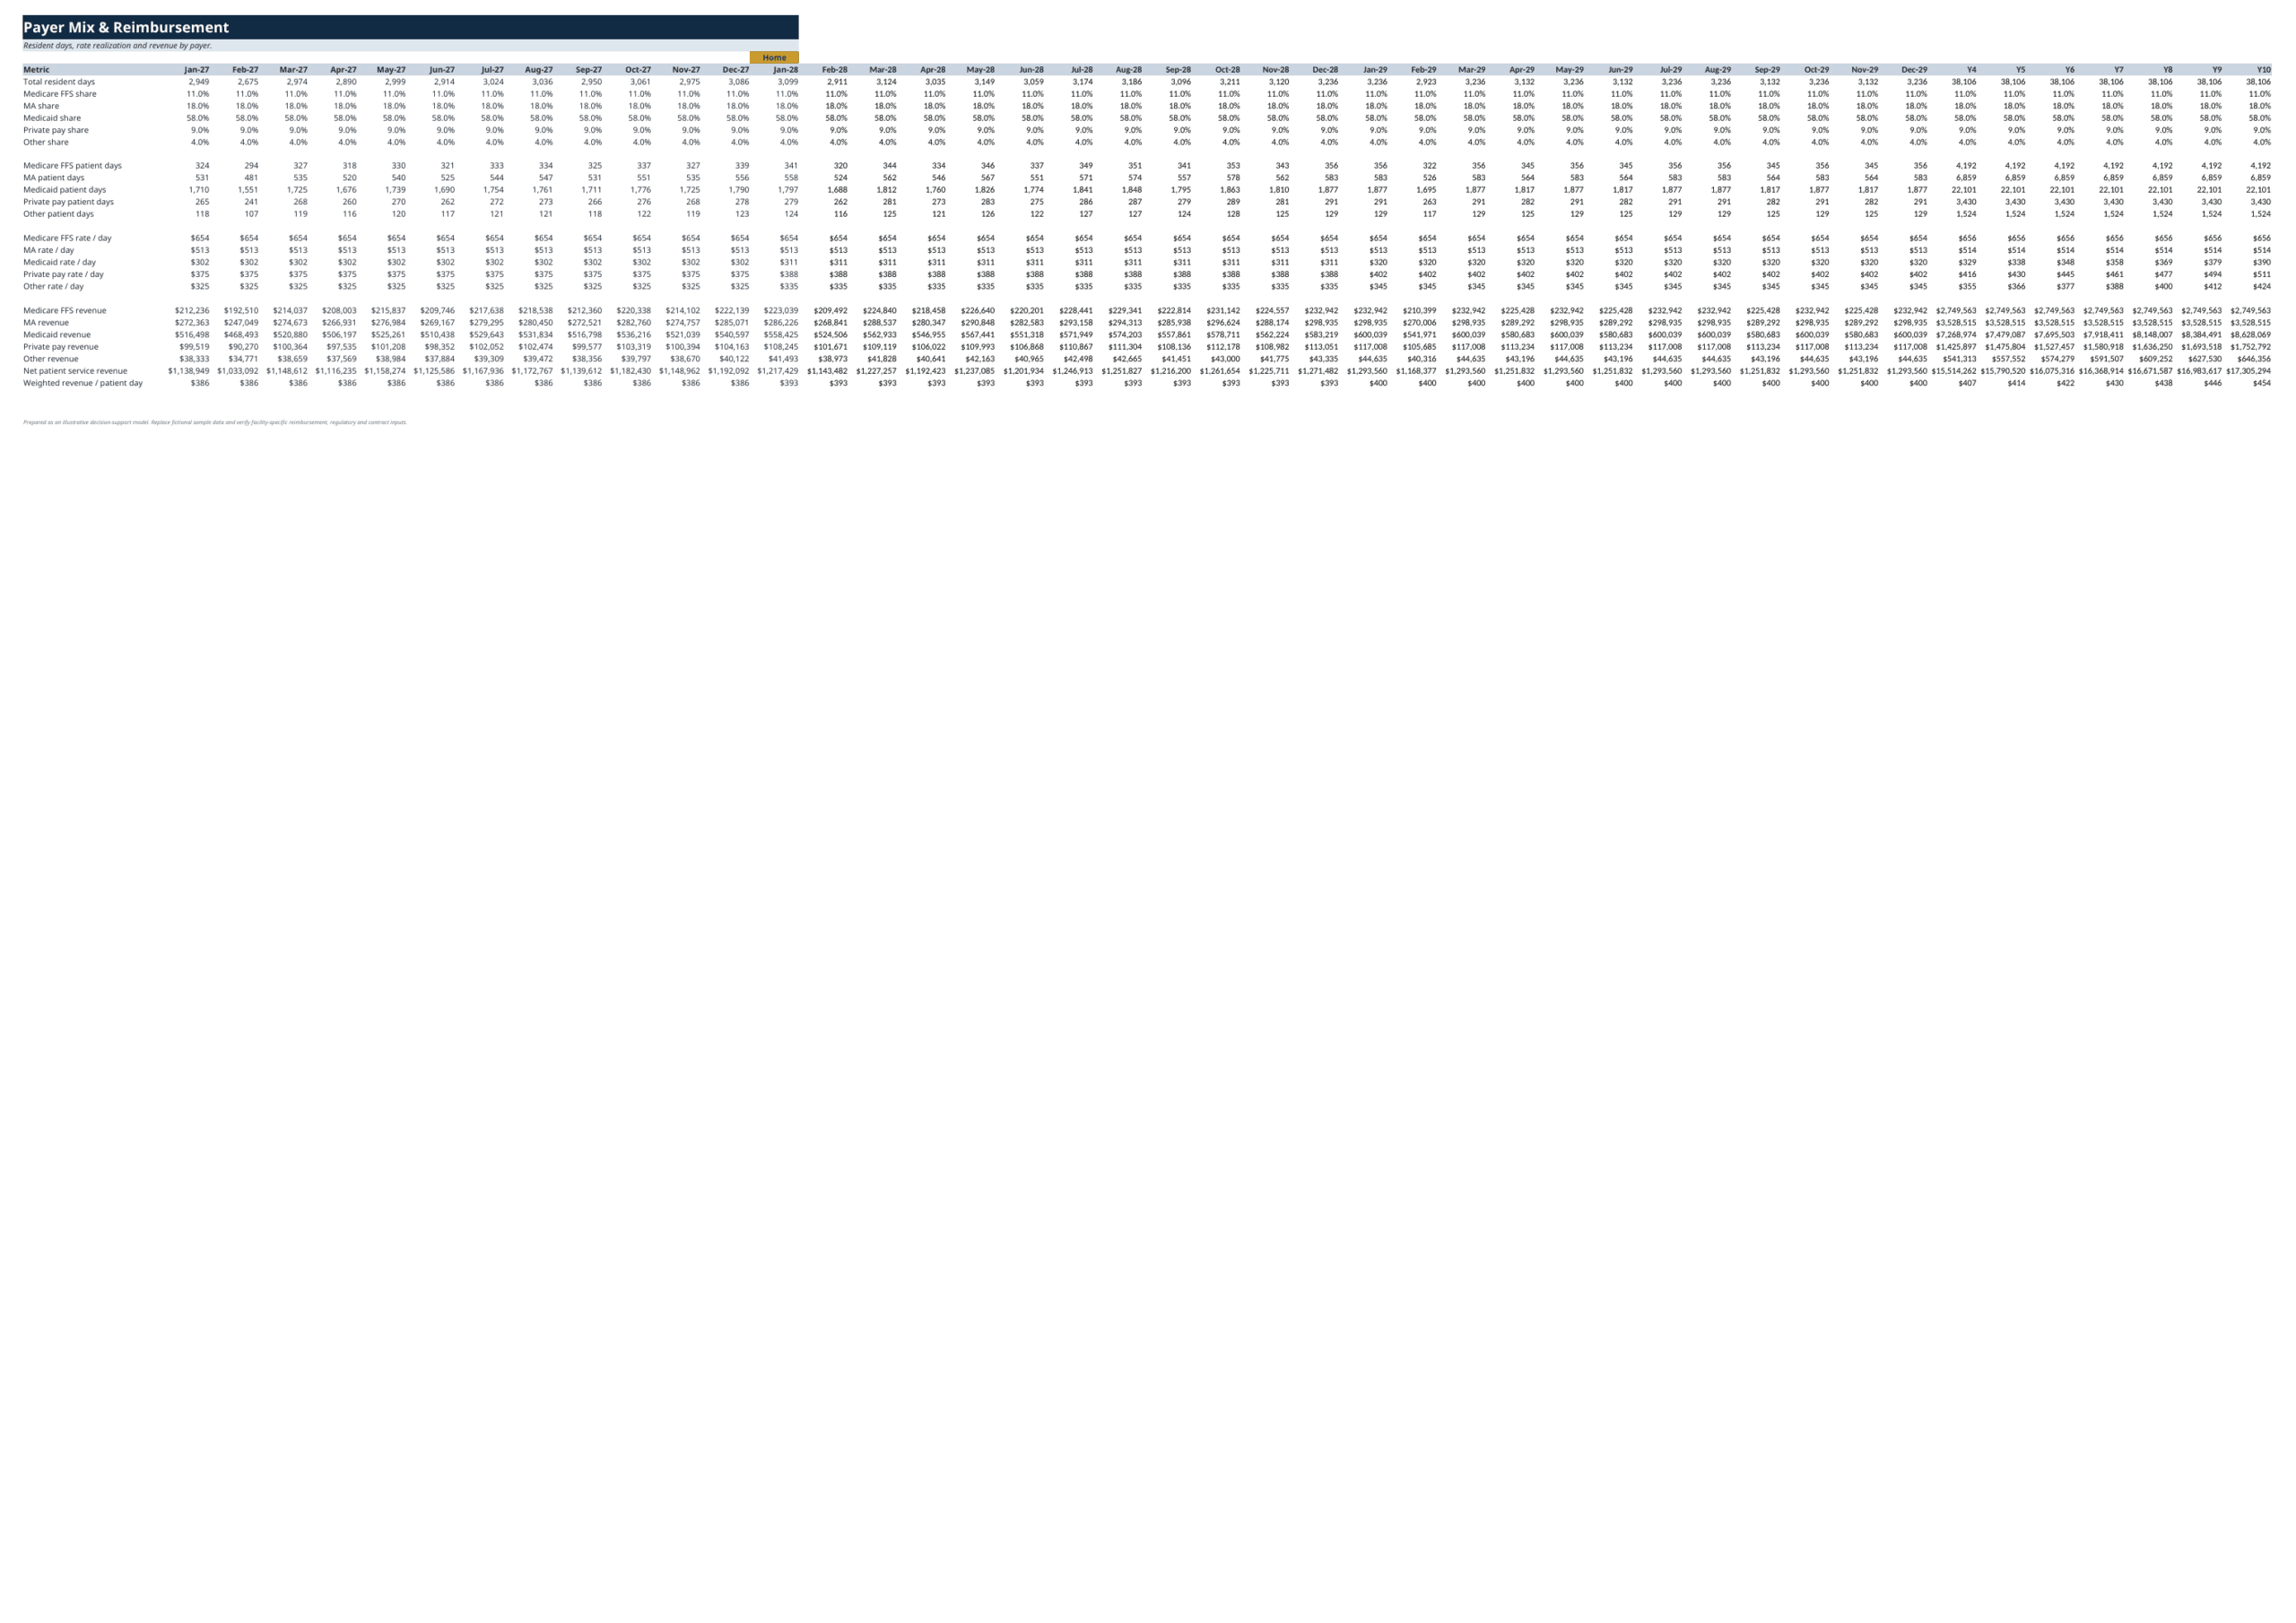
- 06 Payer Mix & Reimb – payer shares, resident days, reimbursement and revenue by Medicare FFS, Medicare Advantage, Medicaid, private pay and other payers.
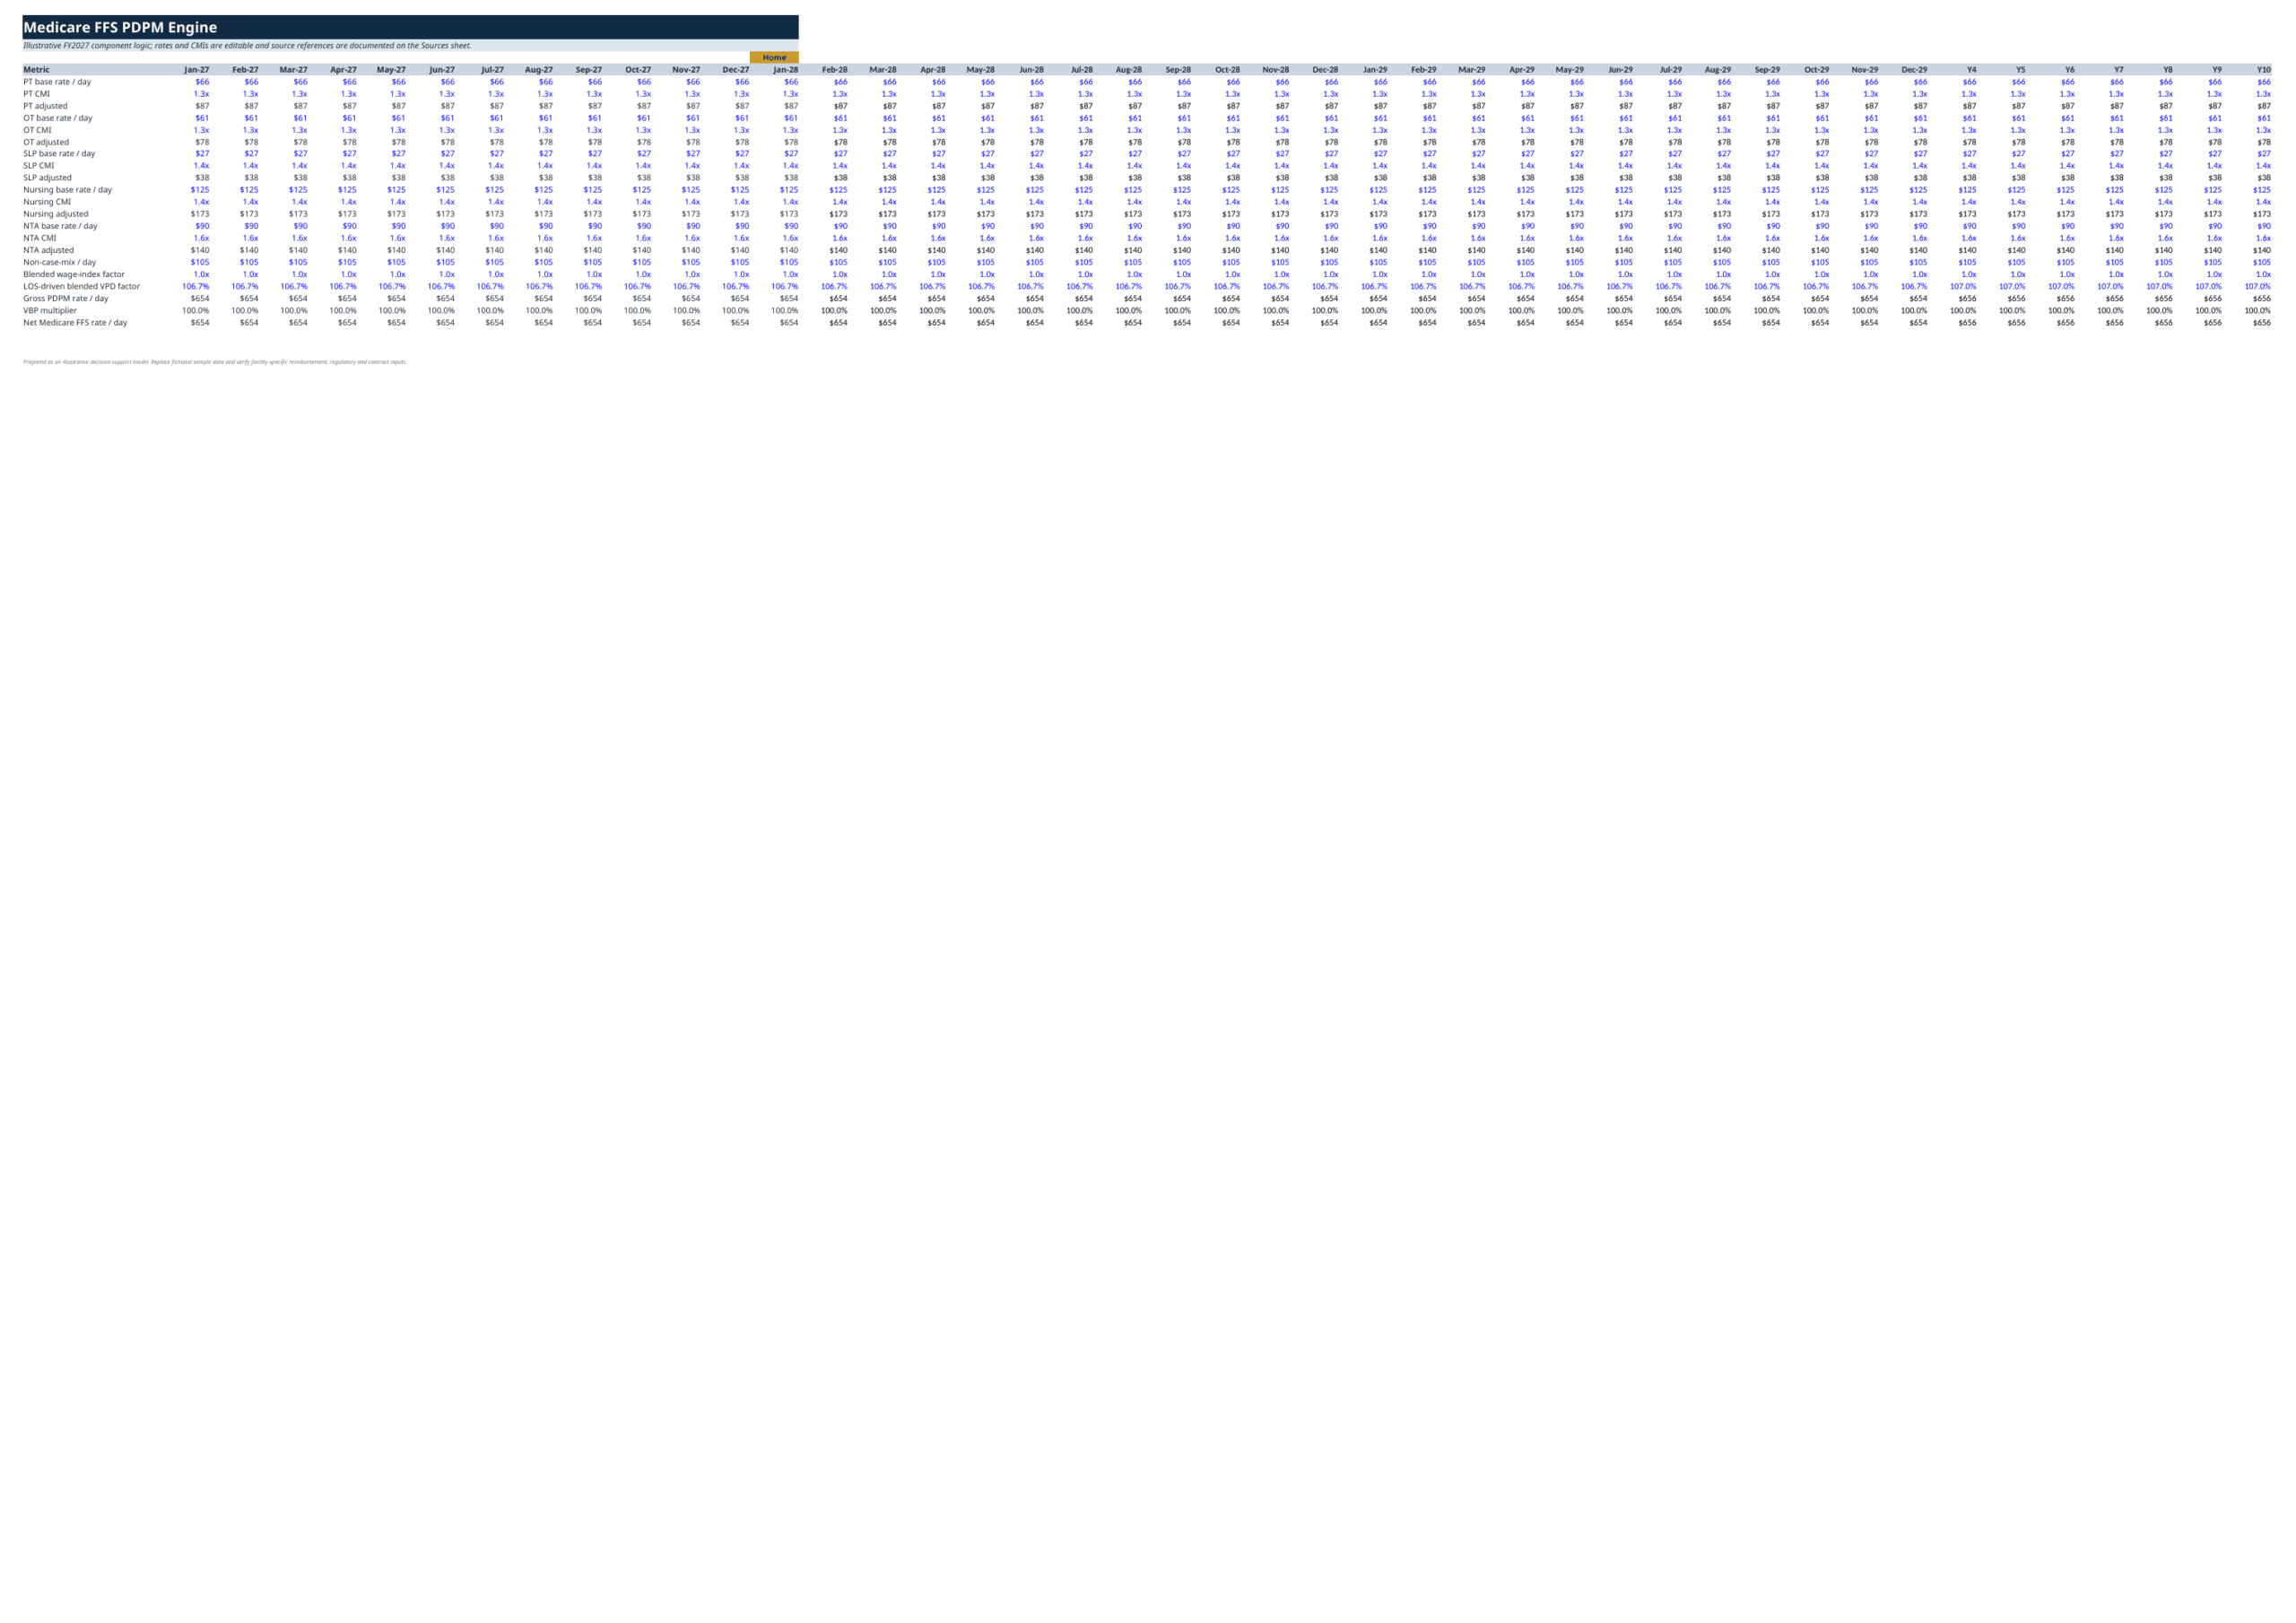
- 07 Medicare FFS PDPM – PT, OT, SLP, Nursing, NTA and non-case-mix component build with case-mix, wage and variable-per-diem logic.
- 08 Medicare Advantage – negotiated MA pricing, contract haircut and contribution economics separate from Medicare FFS.
- 09 Medicaid & Private Pay – Medicaid, private-pay and other-payer rates, escalation and revenue economics.
Labor, quality, cost and working capital
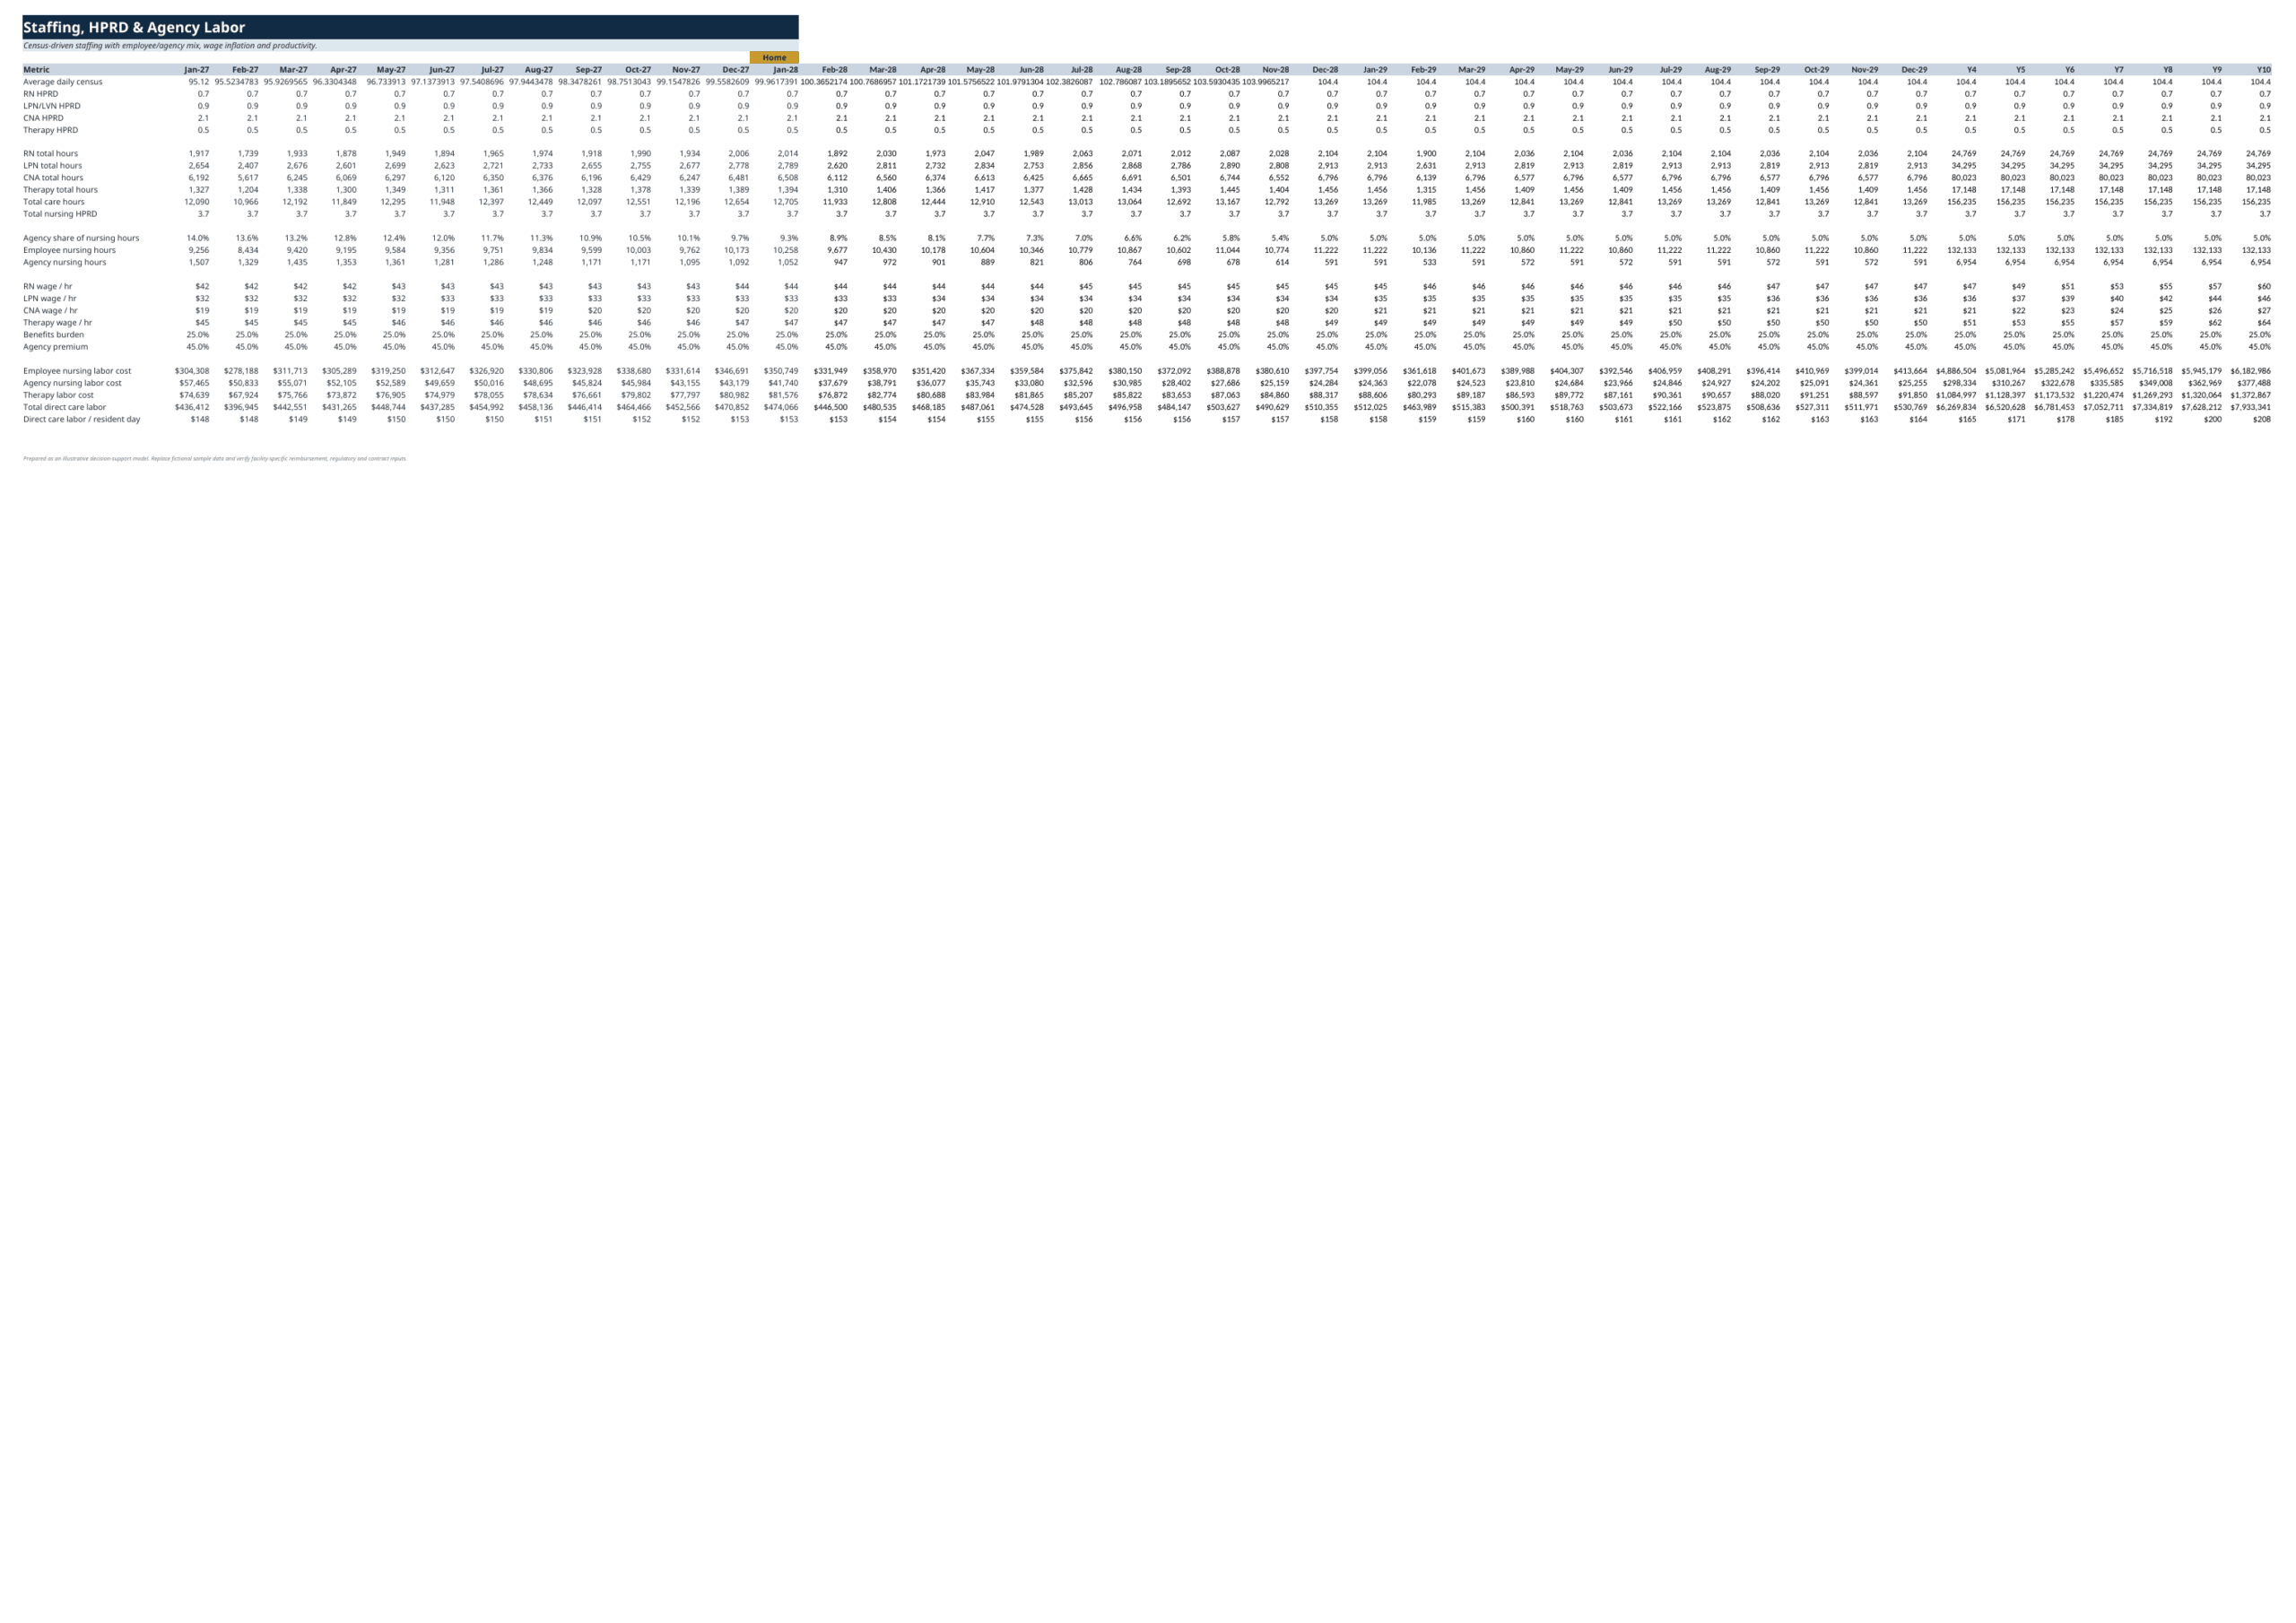
- 10 Staffing HPRD & Agency – RN/LPN/CNA/therapy hours, employee versus agency mix, wage inflation, benefits, agency premium and direct-care labor cost per resident day.
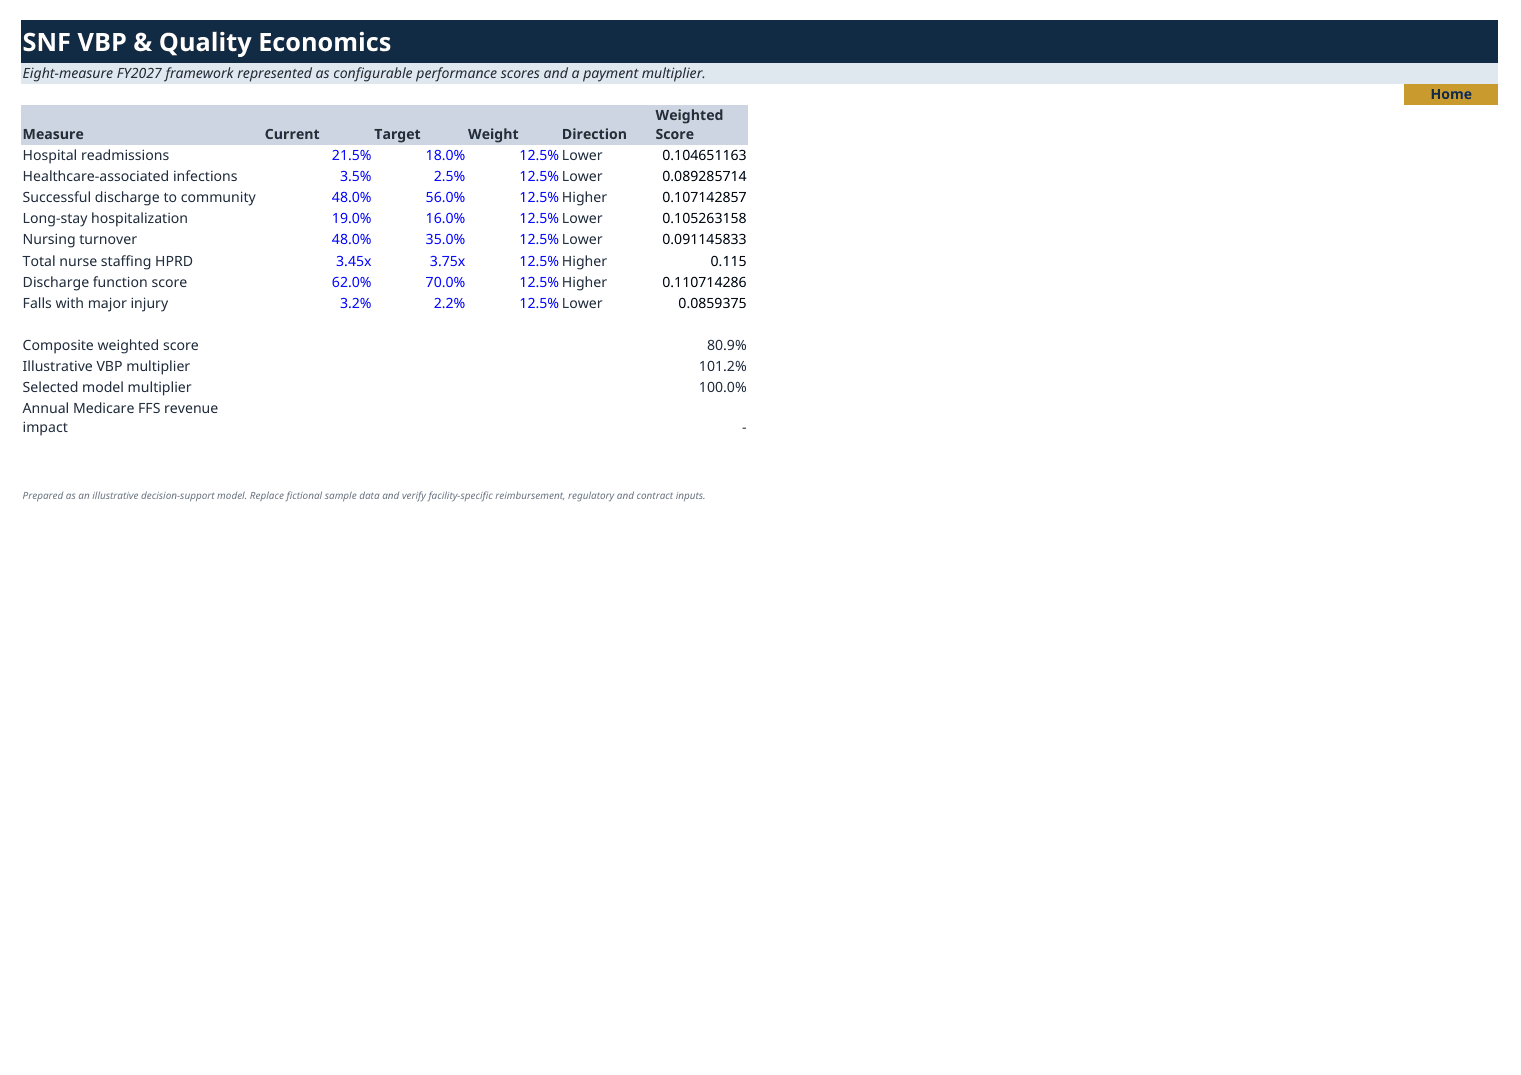
- 11 VBP & Quality – configurable eight-measure quality scoring layer, weighted score, payment multiplier and FFS revenue impact.
- 12 Operating Expenses – departmental and non-labor operating costs with inflation.
- 13 Capex & Maintenance – renovation, maintenance capex, depreciation and fixed-asset logic.
- 14 Working Capital – payer-specific receivables, collection days, other working-capital items and cash implications.
Turnaround, financing and statements
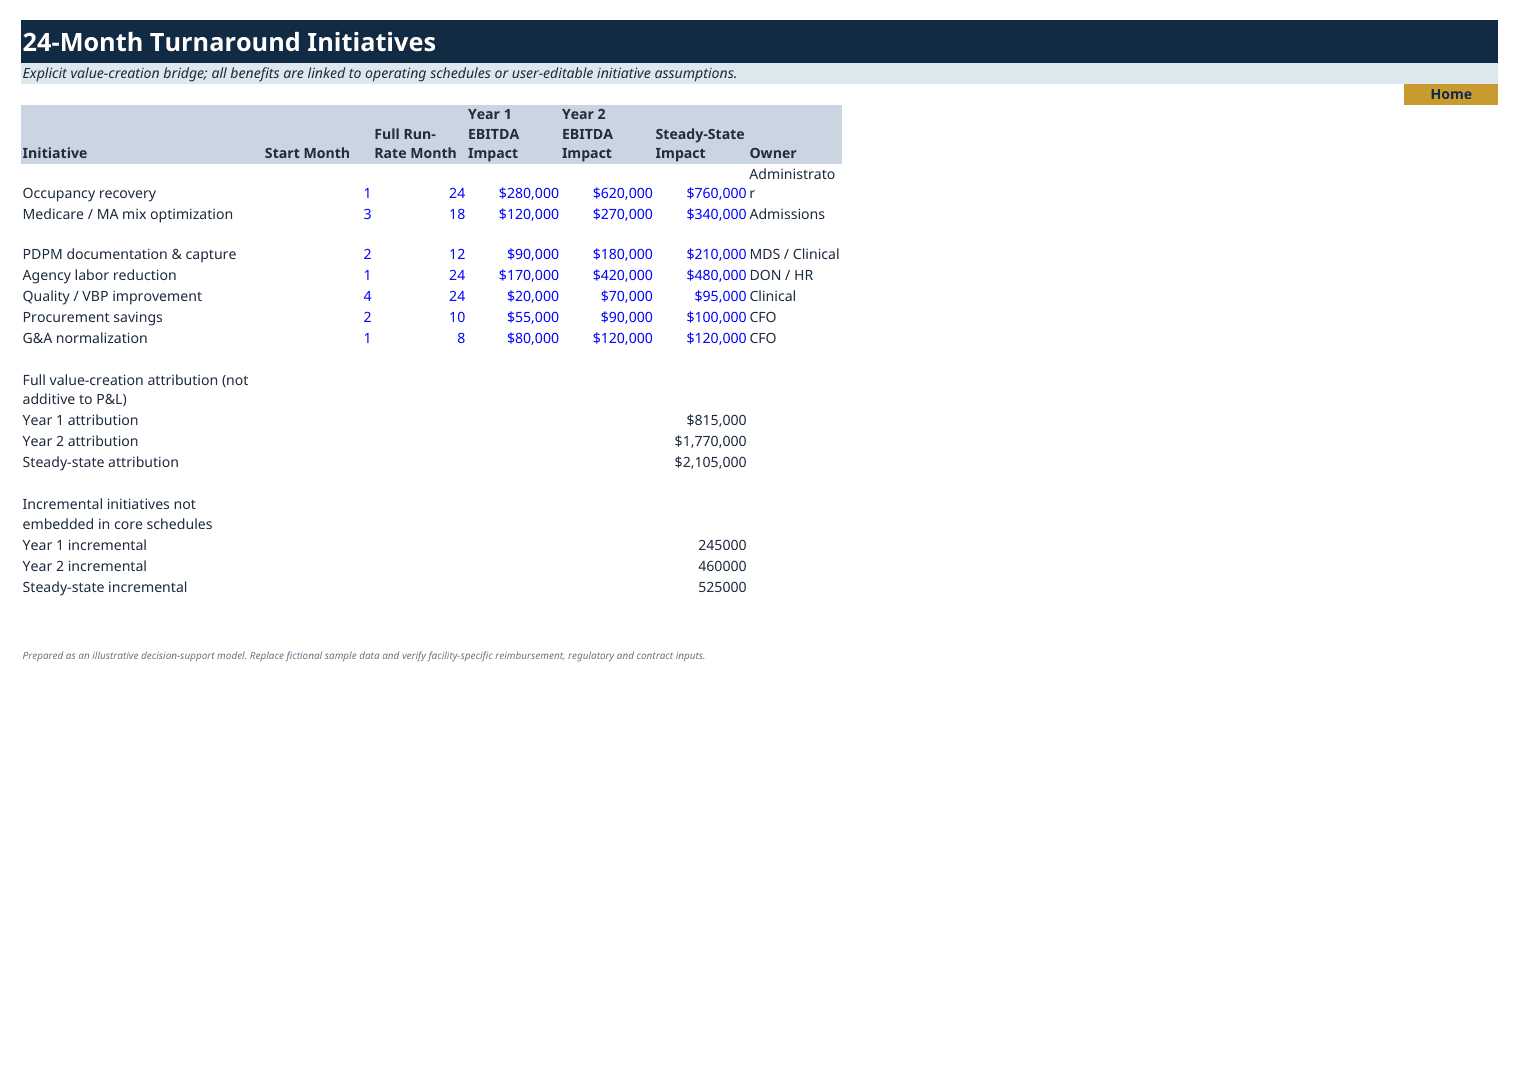
- 15 Turnaround Initiatives – 24-month operational initiatives and EBITDA value-creation bridge.
- 16 Sources & Uses – purchase price, transaction costs, renovation funding, debt and equity funding.
- 17 Debt & DSCR – debt opening balance, interest, principal amortization, ending balance and debt-service coverage.
- 18 Income Statement, 19 Balance Sheet and 20 Cash Flow – integrated 10-year financial statements.
Valuation, risk and decision dashboards
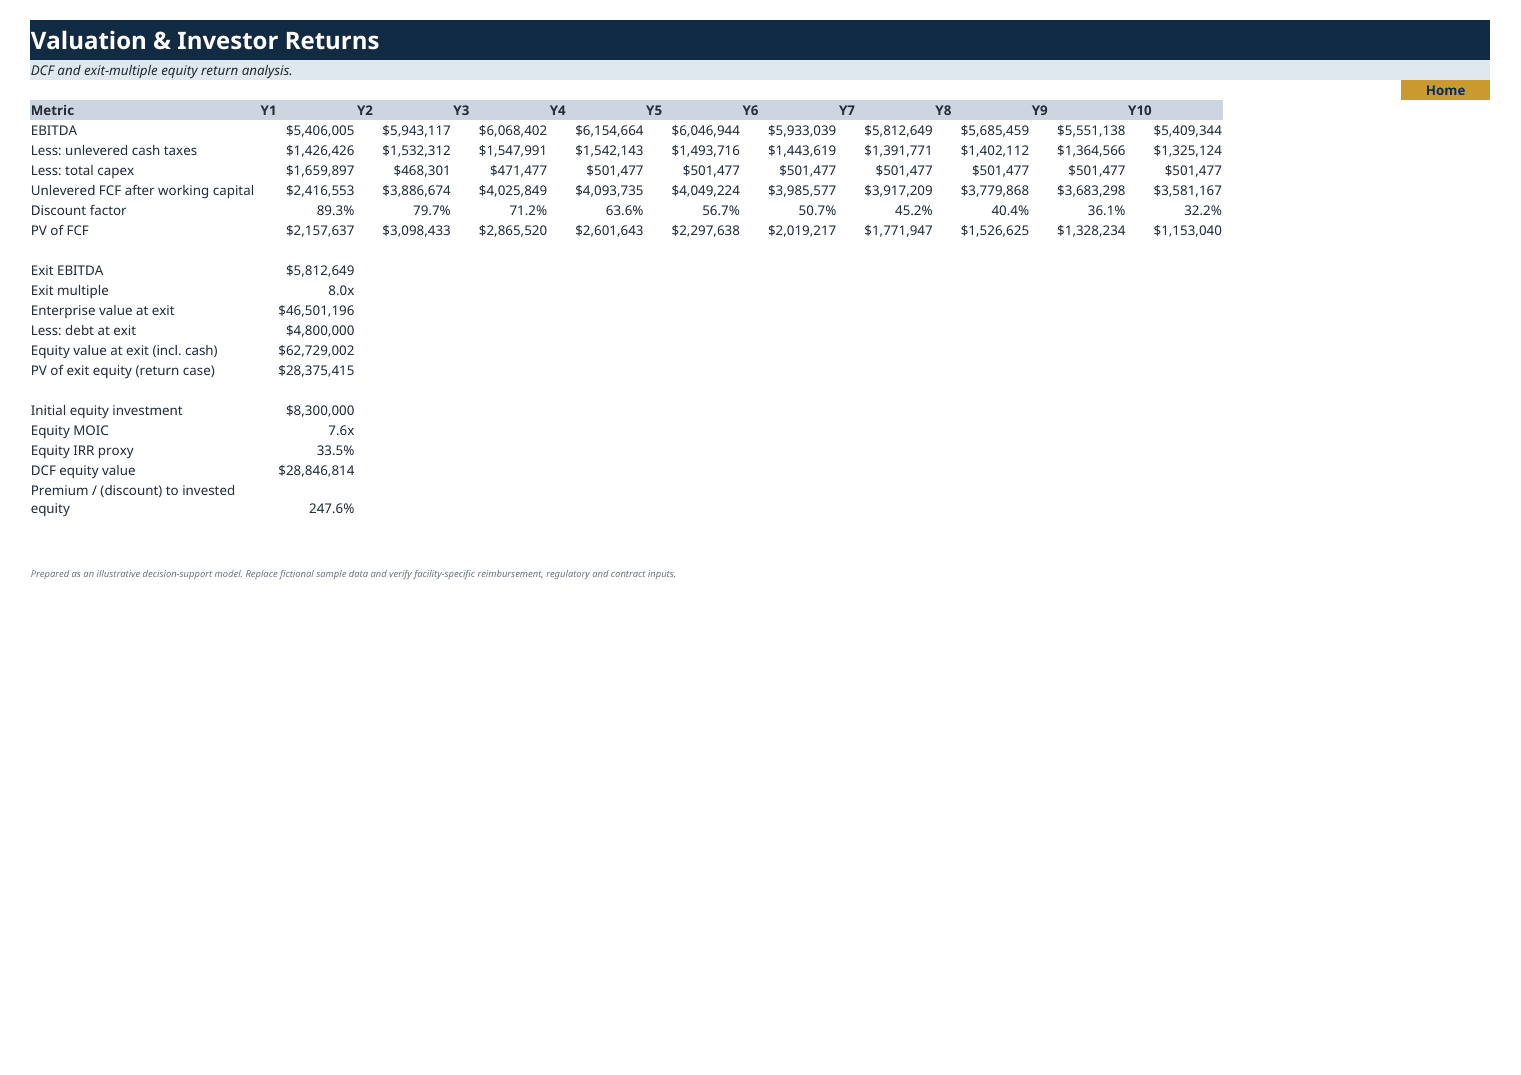
- 21 Valuation & Returns – DCF, exit-multiple value, exit debt/equity, equity MOIC and IRR proxy.
- 22 Sensitivity & Scenarios – scenario comparison plus two-way sensitivity tables covering transaction and operating risk drivers.
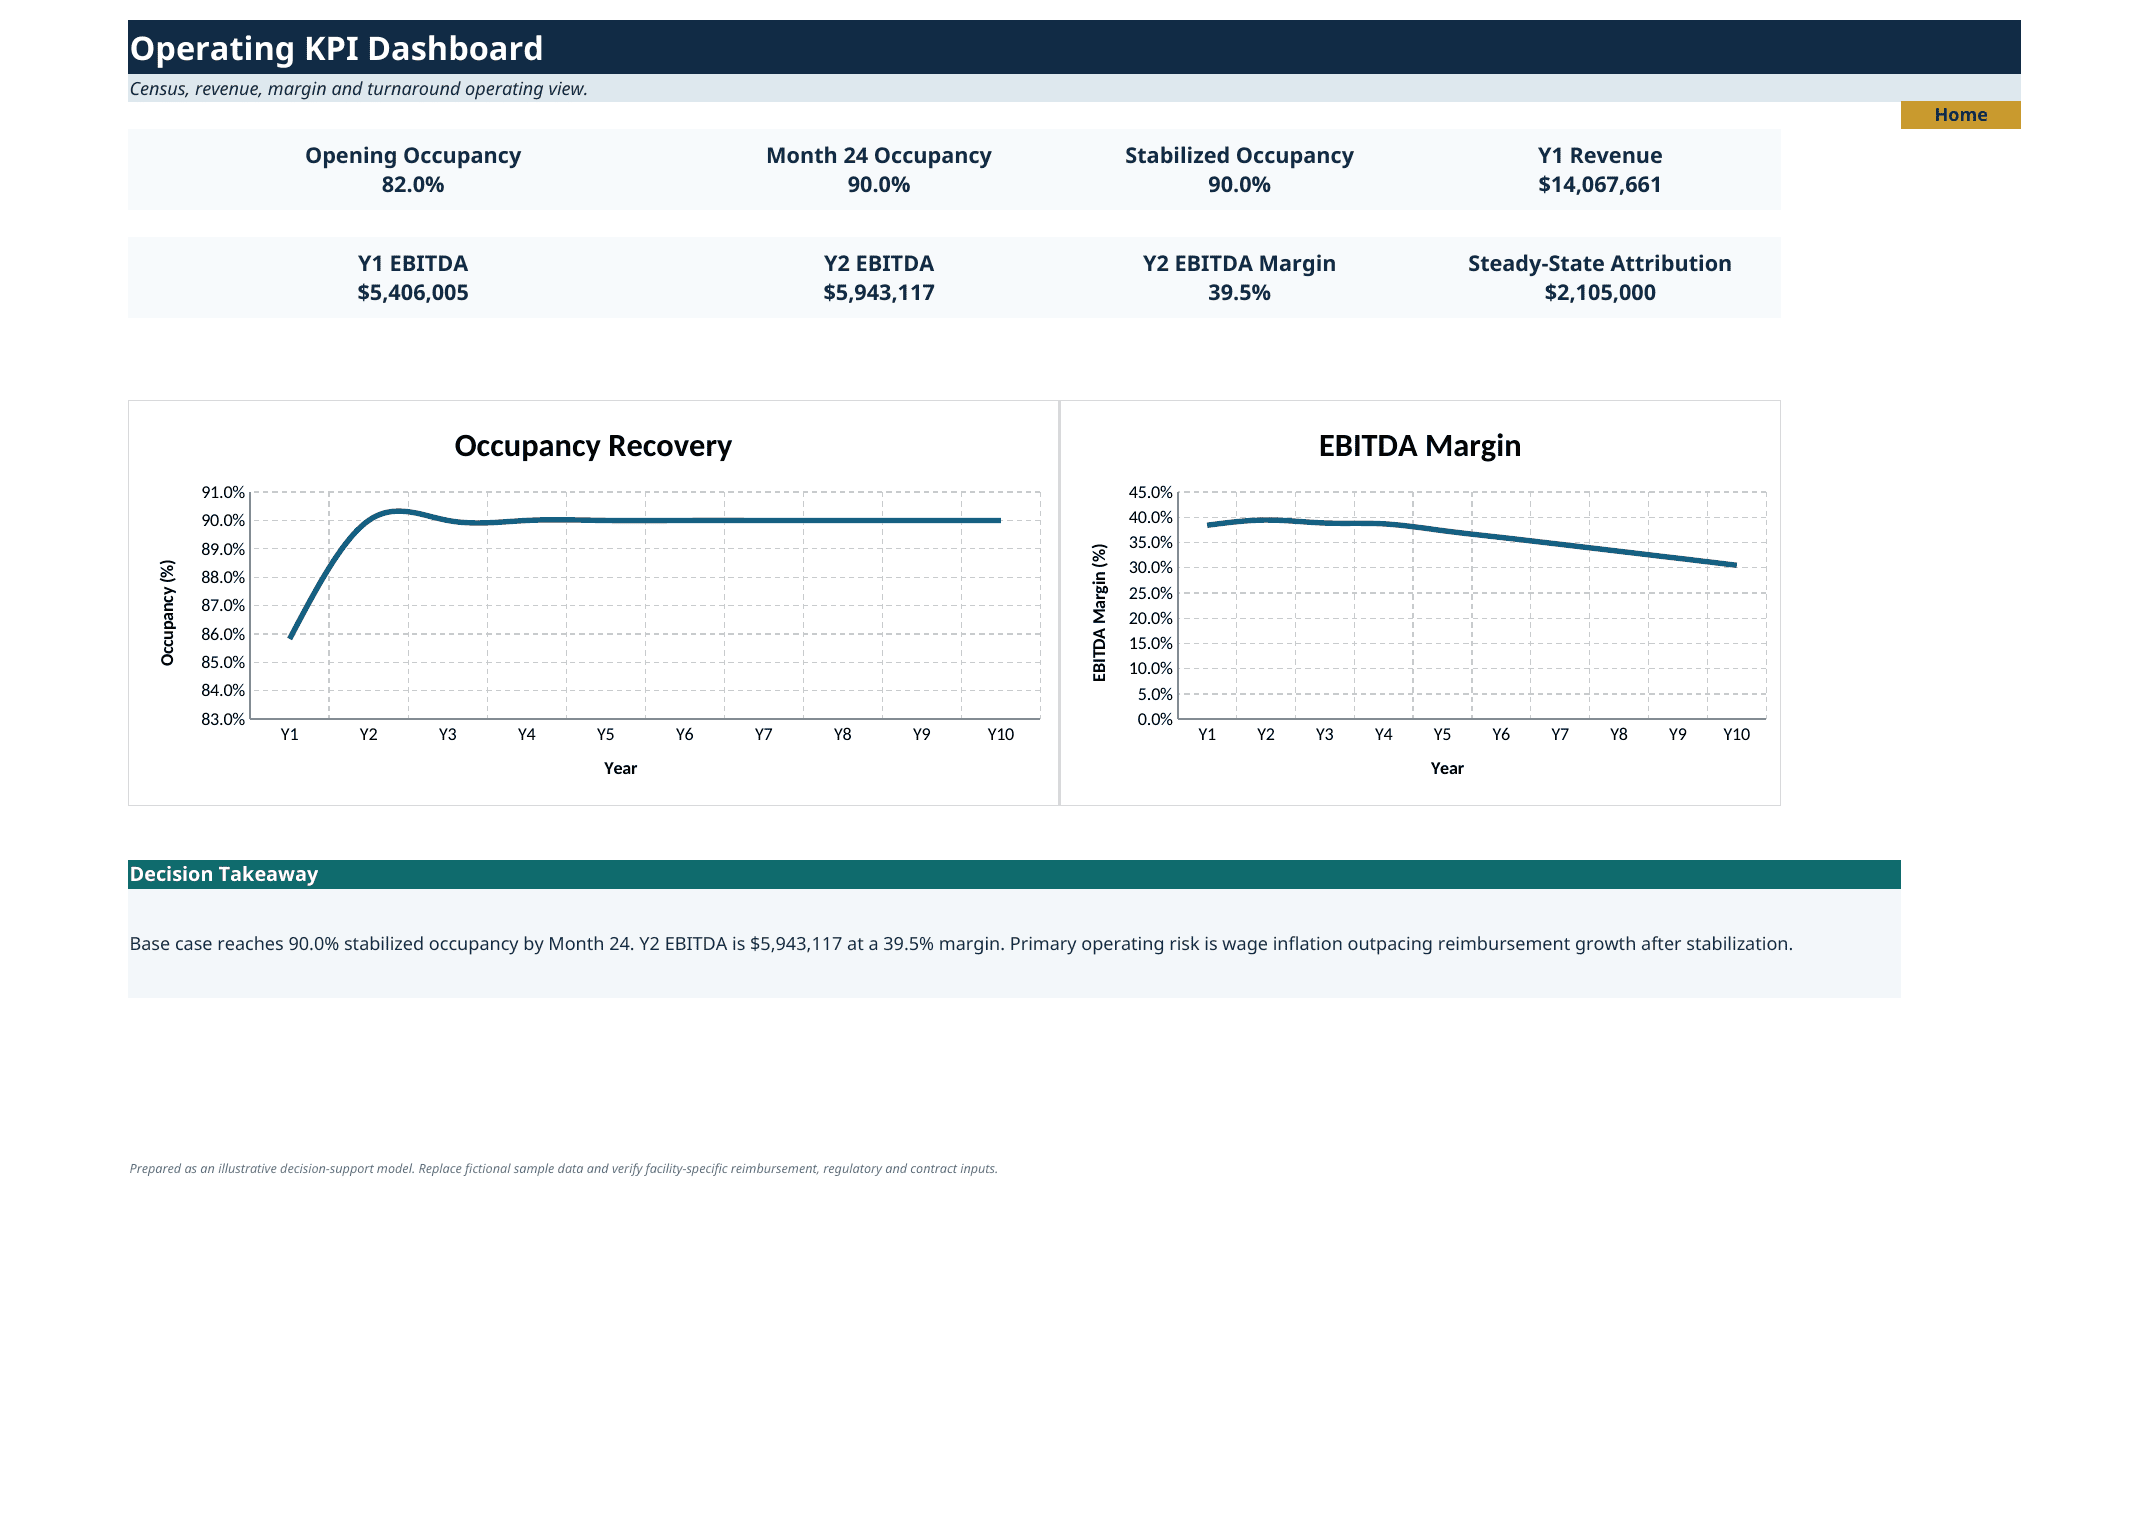
- 23 Operating KPI Dashboard – occupancy recovery, EBITDA margin and headline operating KPIs.
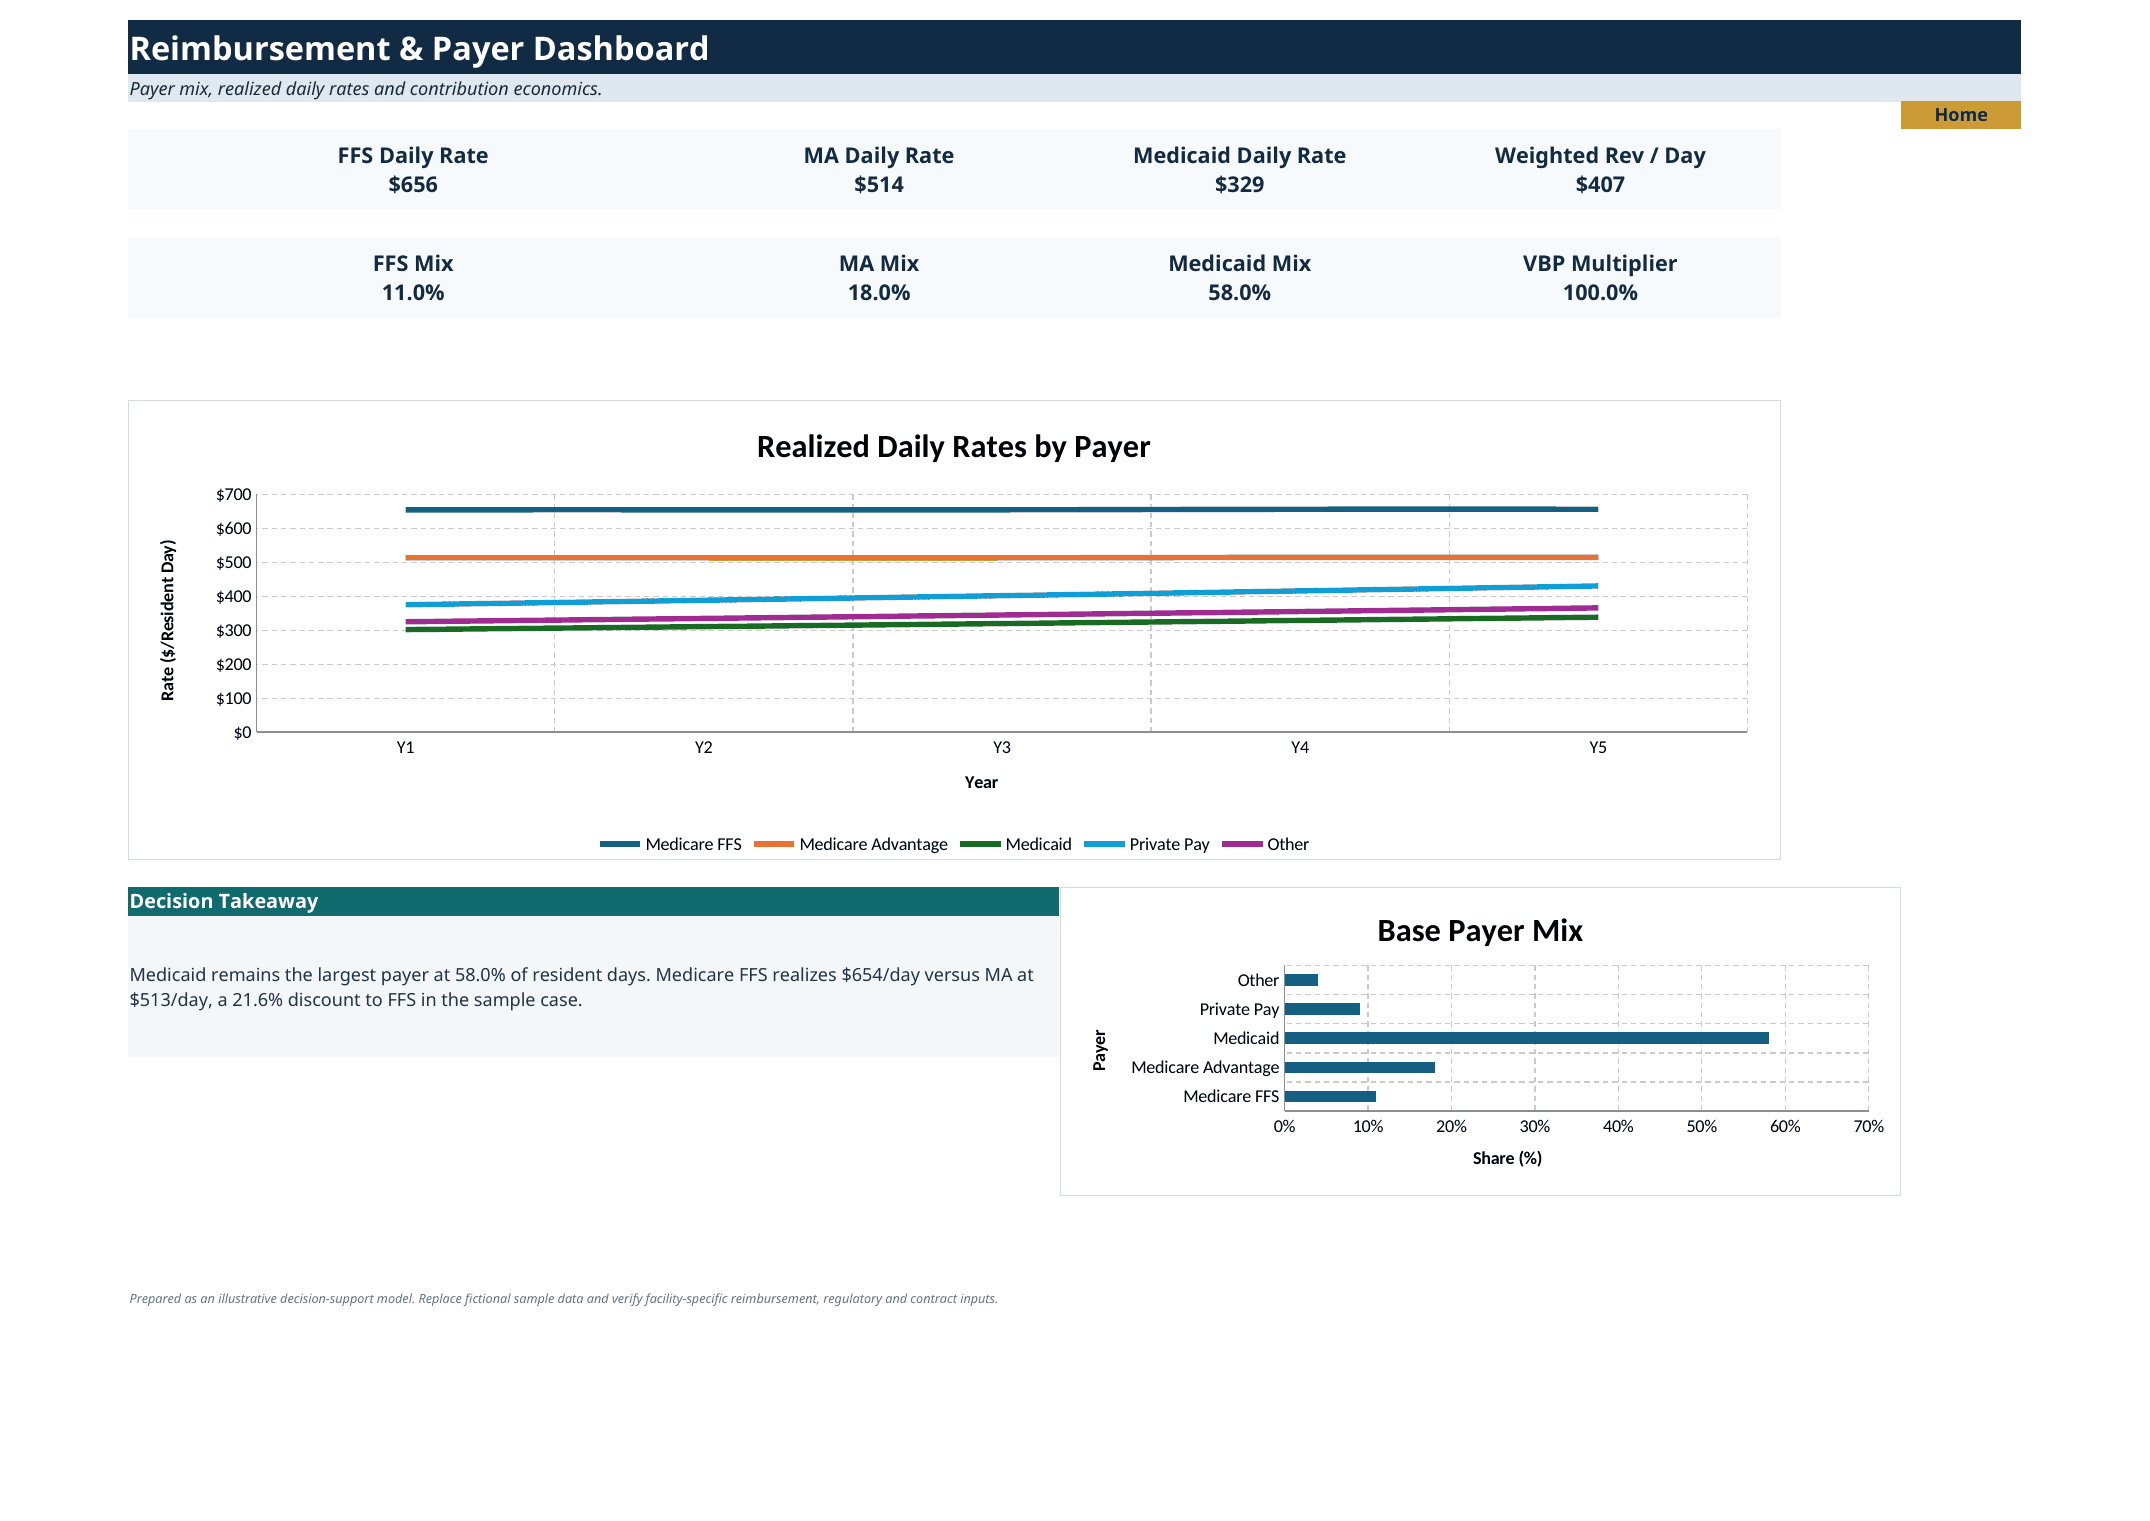
- 24 Reimbursement Dashboard – reimbursement and payer-mix KPIs with payer-rate and payer-mix visuals.
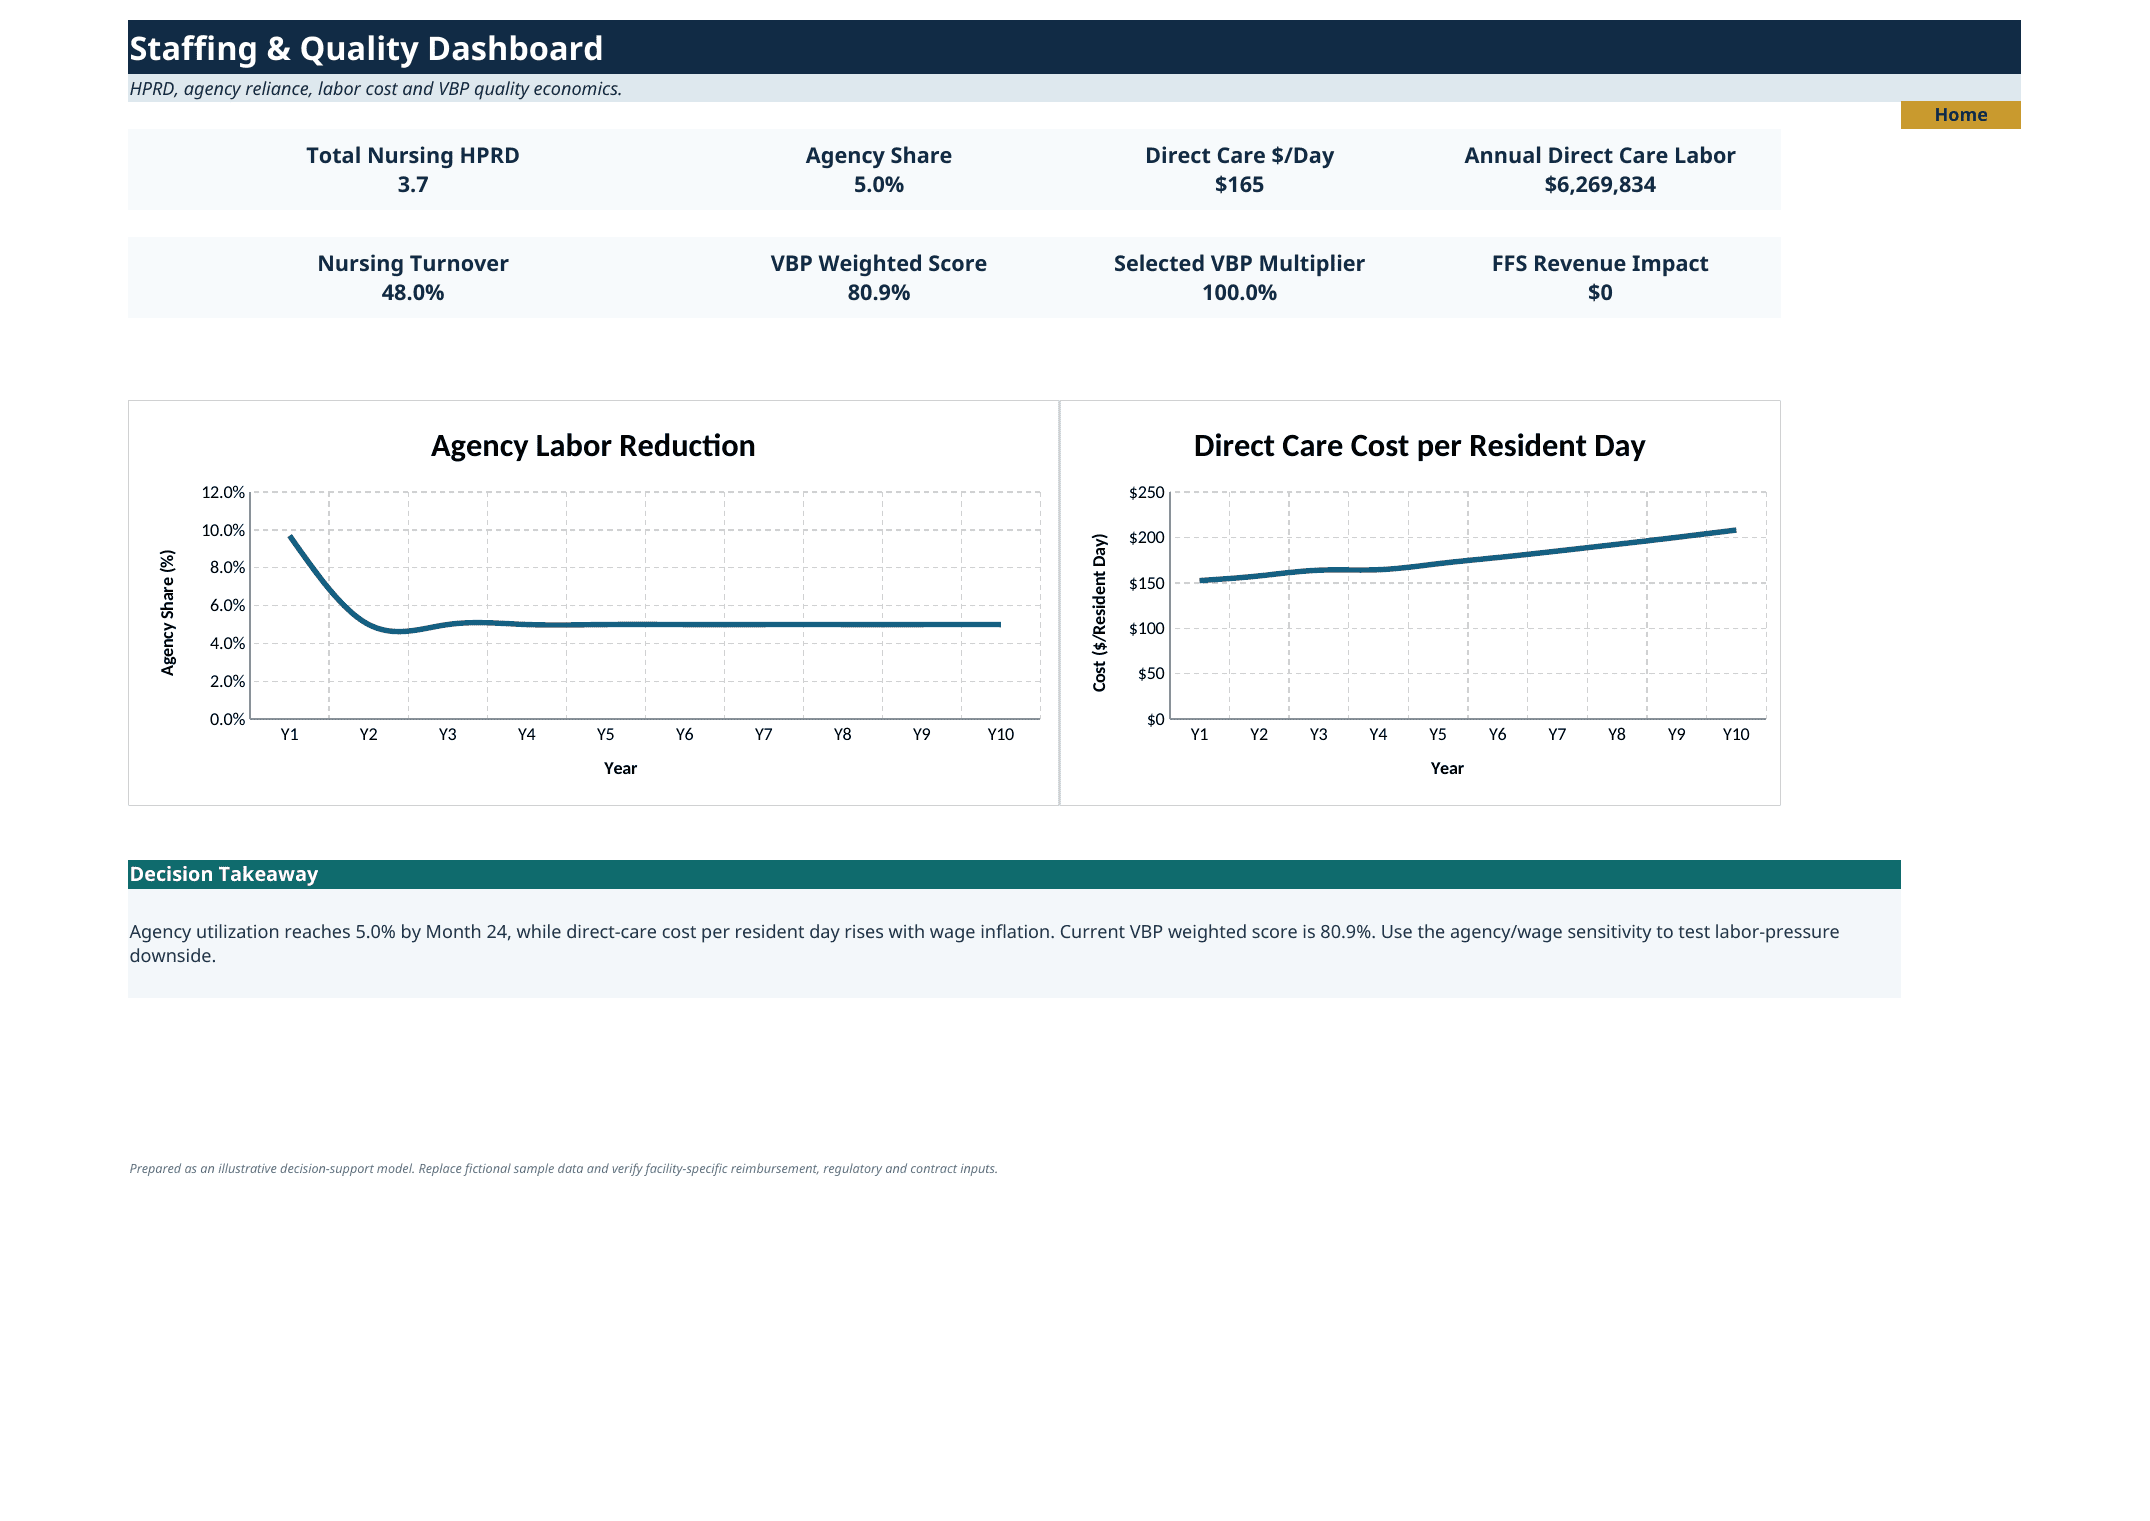
- 25 Staffing Quality Dashboard – HPRD, agency share, direct-care cost, turnover, VBP score and labor-pressure visuals.
- 26 Audit & Integrity – independent checks for payer shares, beds, sources/uses, revenue, labor, balance sheet, DSCR, PDPM, MA rate, staffing cost, PP&E, DCF and scenario consistency.
- 27 Methodology & Sources – calculation methodology, workbook disclosures and public source references.
📊 Scenarios, sensitivities and KPIs
The model includes Downside, Base and Upside scenarios that flow through operations, financing and returns. Decision outputs include occupancy, resident days, payer rates, revenue, direct-care labor cost, EBITDA, EBITDA margin, debt balance, DSCR, cash generation, exit enterprise value, exit equity value, DCF equity value, MOIC and IRR proxy.
Two-way sensitivity analysis tests key transaction and operating risks, including purchase price versus exit multiple, occupancy and reimbursement assumptions, and labor pressure from wage inflation and agency utilization.
💼 Practical use cases
- Acquisition planning and buy / walk-away underwriting
- Long-range financial forecasting and budgeting
- Occupancy, admissions and census recovery planning
- Payer-mix and reimbursement profitability analysis
- Medicare FFS PDPM reimbursement planning
- Medicare Advantage pricing and contract evaluation
- Medicaid and private-pay revenue planning
- Staffing, HPRD and agency-labor optimization
- Departmental operating-cost and margin planning
- Cash-flow, receivables and working-capital forecasting
- Debt sizing, amortization and DSCR covenant analysis
- Downside / Base / Upside scenario planning
- Purchase-price, operating and exit sensitivity analysis
- DCF, exit-multiple and investor-return valuation
- Turnaround initiative prioritization and EBITDA value-creation planning
📦 Delivered files
The primary product is a fully editable Excel XLSX workbook with no macros. A complete 28-page PDF preview is provided for marketplace review, with one clean page per worksheet. The workbook also includes internal navigation, dashboards, methodology, source references and built-in integrity checks so buyers can understand both the decision outputs and the schedules behind them.
Similar ProductsOther customers were also interested in...



 eFinancialModels
Electric Vehicle (EV) Charging Station Financial M...
With this comprehensive 5- or 10-year monthly tool, investors can assess the viability of setting up... Read more

Financial Model for Mobile App | Mobile App Busine...
The Mobile App Financial Plan Template in Excel allows you to develop financial projections when lau... Read more

 HenrySheykin
Food Truck Financial Model Excel Template
The Food Truck Financial Model helps entrepreneurs, founders, business owners, consultants, and anal... Read more

Green Hydrogen Production from Wind Energy Financi...
The Green Hydrogen from Wind Financial Model aims to comprehensively forecast a horizon of 40 years ... Read more

Simple Mutual Non-Disclosure Agreement Template
Protect your business secrets with ease using our Simple Mutual Non-Disclosure Agreement Template. S... Read more

Solar Energy Financial Model
The Solar Energy Financial Model Spreadsheet Template in Excel assists you in preparing a sophistica... Read more

 Peter Graf
The Customer-Centric Financial Model for Restauran...
Starting a restaurant without a financial plan is like driving a car blindfolded. You wouldn´t do i... Read more
You must log in to submit a review.