
0 ITEMS

Resort Financial Model Excel Template
The Resort Financial Model Financial Model Template helps resort developers, hospitality entrepreneurs, business owners, consultants, and analysts turn a resort concept into a structured five-year financial forecast. Instead of building a complex hospitality model from scratch, users can start with a ready-to-use template designed around resort revenue streams, startup investment, operating expenses, payroll, cash flow, profitability, and investor reporting. It gives you a practical framework for evaluating whether a resort project can support its cost structure, reach break-even, and generate attractive returns. This template is especially useful for preparing business plans, investor presentations, loan applications, feasibility studies, internal budgets, and expansion plans. It helps users organize the assumptions that matter most in a resort business, including room rates, occupancy, food and beverage sales, spa and wellness income, event bookings, staffing levels, capital expenditures, and ongoing operating costs. By connecting these assumptions to projected revenue, profit, and cash flow, the model supports better decision-making before major commitments are made. The Resort Financial Model is fully editable and built for use in Microsoft Excel and Google Sheets, making it accessible for both finance professionals and non-financial users. You can adjust assumptions to reflect your location, room mix, pricing strategy, market positioning, guest volume, and development budget. The model includes structured outputs that help you review profit and loss performance, cash flow needs, break-even timing, key performance indicators, return metrics, and scenario results without having to design formulas from the ground up. Whether you are launching a boutique resort, planning a luxury destination property, evaluating a renovation, or preparing a hospitality investment case, this financial model template provides a clear planning foundation. It helps you test revenue assumptions, estimate startup costs, manage operating expenses, assess payroll requirements, review profitability, and understand funding needs. With professional formatting, dynamic outputs, and decision-ready financial analysis, the template helps users communicate their resort strategy with greater confidence to partners, lenders, investors, and internal stakeholders.


Financial Model Overview
The Resort Financial Model Financial Model Template is a ready-to-use planning tool designed for resort developers, hospitality founders, operators, consultants, analysts, and business owners who need a structured way to forecast the financial performance of a resort project. A resort business usually combines multiple revenue streams, significant upfront capital investment, seasonal demand patterns, payroll-heavy operations, and ongoing facility costs, so a simple revenue and expense worksheet is often not enough. This template brings those moving parts into one organized model, helping users estimate room revenue, ancillary income, startup costs, operating expenses, cash flow, profitability, funding needs, and investor returns over a five-year projection period. It is built to support business planning, feasibility analysis, funding preparation, stakeholder presentations, budgeting, and strategic decision-making. Users can edit the assumptions to reflect their own resort concept, room mix, pricing, occupancy expectations, cost structure, staffing plan, and capital requirements, then review the outputs through reports, dashboards, charts, and performance metrics. The result is a practical financial planning framework that helps replace guesswork with a more disciplined view of how the resort may perform under realistic operating conditions.
All-in-One Dashboard
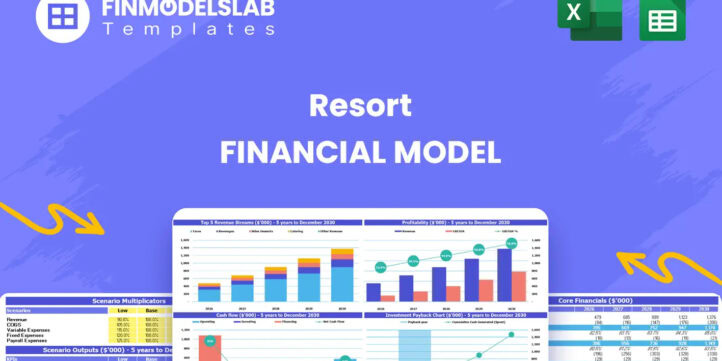
The all-in-one dashboard gives users a centralized view of the most important inputs and outputs in the Resort Financial Model. Rather than moving through separate tabs to understand the full picture, users can review core assumptions, high-level revenue projections, profitability indicators, cash flow trends, and return metrics from one organized area. This component is useful because resort projects involve many interconnected drivers, including occupancy, average daily rate, room mix, food and beverage sales, spa services, event bookings, payroll, utilities, maintenance, and capital expenditures. The dashboard helps translate those inputs into a clear financial summary that can be used for planning discussions, investor reviews, lender conversations, and internal management decisions. It may include key figures such as total revenue, gross profit, EBITDA, net income, cash balance, funding requirements, payback period, and return on equity. By combining the main assumptions and outputs in a single view, the dashboard helps users quickly identify whether the resort plan is financially balanced, where the strongest profit drivers are located, and which areas may require further adjustment before the model is used in a business plan or funding package.
Low, Base, and High Scenario Analysis
The low, base, and high scenario analysis component helps users test how the resort performs under different operating conditions. A resort forecast is highly sensitive to market demand, occupancy levels, pricing, labor costs, energy costs, and guest spending across ancillary services, so it is important to see more than one possible outcome. This section allows users to compare a conservative case, a more realistic base case, and an optimistic upside case using adjustable assumptions such as occupancy rates, average daily rates, food and beverage spend, spa revenue, event volume, payroll growth, cost inflation, and capital requirements. The outputs help show how changes in these assumptions affect revenue, profit margins, cash flow, break-even timing, and investor returns. This is valuable for entrepreneurs and analysts because it reveals the financial resilience of the resort project before launch or expansion. It can also support contingency planning by showing what happens if demand ramps up more slowly than expected, if operating costs rise, or if a stronger marketing strategy improves bookings. For investor and lender discussions, scenario analysis demonstrates that the plan has been stress-tested rather than built around a single fixed forecast.
Professional Charts
The professional charts component converts the model’s financial outputs into visual reports that are easier to interpret and present. Resort financial models can contain many detailed monthly and annual calculations, but stakeholders often need a fast way to understand the overall trend. This component may include charts for revenue growth, profitability, EBITDA margin, cash flow, expense categories, room revenue, ancillary income, occupancy progression, capital investment, and return metrics. By visualizing performance over the forecast period, users can spot patterns that may be harder to identify in raw spreadsheet rows, such as seasonality, margin improvement, cash shortfalls, revenue concentration, or the point at which the resort reaches operating stability. Professional charts are especially useful when preparing investor presentations, bank submissions, board updates, business plans, or internal strategy documents because they help communicate the financial story clearly. A chart showing revenue growth by year, for example, can support the commercial case for the resort, while a cash flow chart can highlight working capital needs. This component helps make the Resort Financial Model more presentation-ready and easier for non-financial stakeholders to understand.
ROE Components and DuPont Analysis
The ROE components and DuPont analysis section helps users understand what is driving return on equity rather than viewing investor return as a single isolated number. In a resort project, return on equity can be influenced by profitability, asset efficiency, leverage, operating margins, financing structure, and the scale of capital investment. This component breaks down the drivers behind ROE so users can evaluate whether returns are coming from strong operating performance, efficient asset utilization, financing assumptions, or a combination of factors. Inputs may include net income, equity investment, total assets, revenue, profit margins, debt levels, and balance sheet values. Outputs may show return on equity, profit margin contribution, asset turnover, and financial leverage effects. This type of analysis is useful for investors, owners, and analysts because it gives a more detailed view of financial performance and risk. If ROE appears attractive but is heavily dependent on leverage, users can evaluate whether the financing structure is appropriate. If ROE is driven by improving margins, management can focus on pricing, labor efficiency, and ancillary revenue. For a resort feasibility study or investment memo, DuPont-style analysis adds depth to the financial narrative and supports more informed decision-making.
Revenue Inputs
The revenue inputs component is where users define the commercial assumptions that drive the Resort Financial Model. For a resort, revenue is usually generated from several connected but distinct sources, including room bookings, food and beverage sales, spa and wellness services, event and conference bookings, memberships, resort fees, activities, packages, and other guest services. This section allows users to enter or adjust the assumptions behind those revenue streams, such as the number of rooms, room categories, weekday and weekend average daily rates, occupancy rates, seasonal demand patterns, guest spending, event frequency, pricing, and annual growth rates. These inputs then feed into the model’s revenue forecast, profitability calculations, cash flow projections, and performance dashboards. The value of this component is that it makes the revenue forecast transparent and flexible. Users can model a boutique resort, luxury property, destination resort, wellness retreat, or mixed-use hospitality project by tailoring assumptions to the actual business concept. It also helps users evaluate whether the pricing strategy, occupancy target, and ancillary revenue assumptions are realistic enough to support payroll, operating expenses, debt obligations, and investor return expectations.
Bank-Ready Reports
The bank-ready reports component provides structured financial outputs that can support lender reviews, funding applications, and professional stakeholder discussions. Resorts often require significant upfront investment for acquisition, renovation, furnishings, amenities, equipment, staffing, marketing, and working capital, so lenders and investors typically want to see a clear financial forecast before providing capital. This component helps organize the model’s outputs into reports that may include an income statement, cash flow statement, balance sheet, startup cost summary, loan and funding requirements, profitability forecast, and key financial metrics. The goal is to present the resort plan in a format that is easier for banks, credit committees, investors, and partners to review. These reports can help show whether the resort can generate enough revenue to cover operating expenses, maintain cash reserves, service debt, and reach profitability. They also create a more credible link between the assumptions entered in the model and the financial results being presented. For users preparing a resort business plan, loan package, or investment proposal, bank-ready reports save time and provide a more organized foundation for discussing funding needs and repayment capacity.
Revenue Breakdown
The revenue breakdown component gives users a detailed view of how total revenue is built across the resort’s different income streams. This is important because a resort’s financial performance rarely depends on rooms alone. Room revenue may be the largest driver, but food and beverage, spa treatments, wellness services, event bookings, conferences, leisure activities, resort fees, and premium guest services can meaningfully affect margins and cash flow. This section helps separate and analyze these streams so users can understand which areas contribute most to total income and which areas may require more attention. Inputs may include room types, average daily rates, occupancy, covers or guest spend for food and beverage, spa utilization, event volume, average booking value, seasonal uplift, and growth assumptions. Outputs may show revenue by category, percentage contribution, monthly trends, annual totals, and changes across the forecast period. This component is useful for strategic planning because it helps users evaluate business mix, pricing opportunities, and dependency risk. For example, if the model shows high reliance on room revenue, the user may decide to strengthen spa, events, or food and beverage offerings to diversify income and improve profitability.
KPI Dashboard
The KPI dashboard component tracks the performance metrics that matter most for a resort business. While financial statements show revenue, expenses, profit, and cash flow, key performance indicators help explain why those results are happening. This section may include metrics such as occupancy rate, average daily rate, revenue per available room, total revenue per available room, EBITDA margin, gross margin, net profit margin, payroll as a percentage of revenue, cash balance, payback period, break-even timing, return on equity, and internal rate of return. Users can review these indicators to assess operating efficiency, pricing strength, profitability, liquidity, and investment performance. The KPI dashboard is useful for benchmarking the resort against internal targets, market expectations, and industry standards. It also helps management identify where action may be needed, such as increasing occupancy, adjusting rates, improving ancillary sales, controlling payroll, reducing variable costs, or preserving cash. For investors and lenders, KPIs provide a concise way to evaluate whether the resort is financially healthy and operationally realistic. For operators, they provide an ongoing monitoring tool that can be updated as actual results become available.
Startup Costs and Capital Expenditure Planning
The startup costs and capital expenditure planning component helps users estimate the upfront investment required to launch, acquire, renovate, or reposition a resort. Resort projects often require substantial spending before meaningful revenue begins, including property renovation, guest room furnishings, kitchen equipment, spa buildout, landscaping, outdoor amenities, pool areas, technology systems, security systems, licenses, professional fees, pre-opening payroll, initial marketing, deposits, and working capital reserves. This section organizes those costs into a clear planning structure so users can understand how much capital may be needed before operations stabilize. Inputs may include individual cost categories, timing of spending, vendor estimates, contingency allowances, and any phased investment assumptions. Outputs may include total startup costs, capital expenditure summaries, funding gaps, and the timing of cash outflows. This component is valuable because underestimating pre-opening costs is one of the biggest risks in hospitality development. By separating initial investment from ongoing operating expenses, the Resort Financial Model helps users plan funding more accurately, support investor or lender requests, and avoid unexpected cash pressure during launch. It also gives owners and analysts a clearer view of how much capital must be recovered through future operating profit.
Break-Even Analysis
The break-even analysis component helps users identify when the resort is expected to cover its fixed and variable costs and begin generating sustainable profit. This is a critical planning metric because resort operations typically include significant fixed costs such as management salaries, property maintenance, insurance, utilities, leases or debt service, marketing commitments, and administrative overhead, along with variable costs tied to occupancy, food and beverage service, housekeeping, amenities, and guest activity levels. This section uses revenue assumptions, cost of goods sold, payroll, operating expenses, and margin calculations to estimate the point at which income is sufficient to cover the cost structure. Outputs may include break-even timing, required revenue, required occupancy, contribution margin, and the relationship between sales volume and profitability. This component is useful for decision-making because it shows how much demand the resort needs before the business becomes financially viable. It can also help users test whether pricing, occupancy, and ancillary sales assumptions are strong enough to support the operating model. For funding preparation, break-even analysis gives investors and lenders a clearer understanding of risk, ramp-up timing, and the financial milestone at which the resort begins moving from startup mode toward stable profitability.
File types:
Excel – Single-User: .xlsx
Excel – Multi-User: .xlsx
Similar ProductsOther customers were also interested in...

 HenrySheykin
Ski Resort Hotel Financial Model Excel Template
The Ski Lodge Financial Model Template helps entrepreneurs, hospitality founders, consultants, analy... Read more
Hotel Financial Model Excel Template
The Hotel Financial Model helps users build a structured financial forecast for a hotel business usi... Read more
Boutique Hotel Financial Model Excel Template
The Boutique Hotel Financial Model Financial Model Template helps entrepreneurs, hotel owners, consu... Read more
Hostel Financial Model Excel Template
The Hostel Financial Model helps entrepreneurs, founders, operators, consultants, and analysts turn ... Read more
Motel Financial Model Excel Template
The Motel Financial Model helps entrepreneurs, motel owners, hospitality consultants, analysts, and ... Read more
Bed And Breakfast Financial Model Excel Template
The Bed and Breakfast Financial Model is a ready-to-use financial model template built to help entre... Read more
Hotel Development REIT Financial Model Excel Templ...
The Hotel Development Financial Model helps users evaluate a hotel construction or expansion project... Read more
Hospitality Financial Model Template Bundle
Planning to start a business in the hospitality industry? Do you want to try starting a Hotel busine... Read more
Casino Hotel Financial Model Excel Template
The Casino Hotel Financial Model helps users build a structured five-year forecast for an integrated... Read more
Eco Hotel Financial Model Excel Template
The Eco-Friendly Hotel Financial Model helps turn a sustainable hospitality concept into a structure... Read more
Reviews
 director
Thank you!
Thank you for your feedback.
1523 of 3088 people found this review helpful.
You must log in to submit a review.