Quantity Demand Model
A general model that uses your historical data and a growth/decline % to summarize future demand and compare that demand to actuals.

| Distribution, Financial Model, General Excel Financial Models |
| Budgeting, Demand, Excel, Financial Planning, Forecasting, Inventory |
Video Tutorial:
The data inputs have been designed to work with nearly any business’s data. All you need is the date, amount, and product id. Based on that, you can get a nice weekly schedule of the amount of quantity you expect to be demanded and compare that to your actual figures.
The value here is in the structure and logic. The model can easily be modified for much more product id’s or none at all.
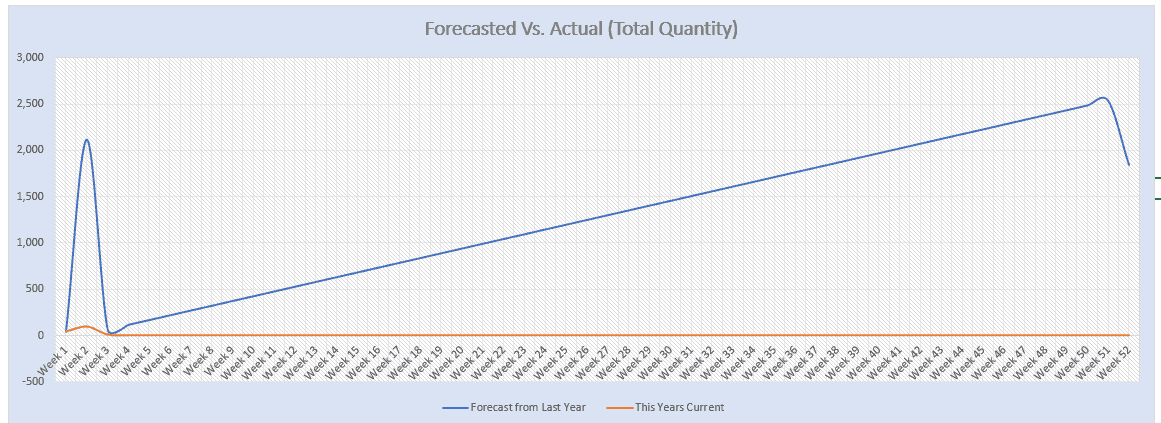
A visual will show you by week how much your demand was projected for against the total actual demand (quantity of items sold).
The bread and butter is the variance, which shows by item and by week as well as weekly total what your current numbers look like against the forecast.
A control tab was added to easily enter the years your data represents and the % of growth decline you expect to achieve from your historical performance.
Instructions are included, and a video walk-through is available.
Similar Products
Other customers were also interested in...
Product Dealer Startup – The Customer Centri...
With this financial model, you can create a financial plan for the startup of your product dealershi... Read more
All My Financial Models, Spreadsheets, Templates, ...
Lifetime access to all future templates as well! Here is a set of spreadsheets that have some of the... Read more
Joint Venture and Fund Cash Flow Waterfall Templat...
Here are all the spreadsheets I've built that involve cash flow distributions between GP/LP. Include... Read more
Small Business Playbook (Financial / Tracking Temp...
About the Template Bundle: https://youtu.be/FPj9x-Ahajs These templates were built with the ... Read more
Top 16 Google Sheet Templates
This is a bundle of all the most useful and efficient google sheet templates I have built over the y... Read more
Inventory Valuation Using FIFO – Automatical...
Any accountant that needs to comply with IFRS will have to use the FIFO valuation method for calcula... Read more
Franchisor Licensing: Financial Model with Cap Tab...
Build up to a 10 year financial forecast with assumptions directly related to the startup and operat... Read more
Preferred Equity Cash Distribution Model – 2...
A 10-year joint venture model to plan out various scenarios for the way cash is shared between a GP ... Read more
Cost Segregation Study: Estimated Benefit Summary ...
This calculator has inputs for many different asset categories and their resulting recovery periods.... Read more
Jewelry Shop / Store 5 Year Startup Business Model
A bottom-up financial model that is designed specifically for a jewelry store, but could easily be u... Read more
You must log in to submit a review.


