
0 ITEMS

Private School Financial Model Excel | 10-Year Enrollment, Capacity, 3 Statements & DCF
Plan a private school with 19 Excel worksheets, 15 grade cohorts, classroom capacity, tuition, scholarships, staffing, 3 financial statements, 4 scenarios, 8 native charts, DCF and a 25-page PDF guide.



PRIVATE SCHOOL & EDUCATION FINANCIAL MODEL | 10-YEAR LUXURY EDITION
Connect Enrollment, School Capacity, Financial Performance & Long-Term Investment Planning
Plan an independent school with an editable Excel financial model that links grade-level admissions, student retention, classroom capacity, tuition and scholarships with teacher requirements, campus investment, debt financing, cash flow and ten-year financial statements.
Designed for private school founders, owners, operators, finance directors, educational consultants and financial analysts, this model helps evaluate how educational capacity and financial assumptions interact.
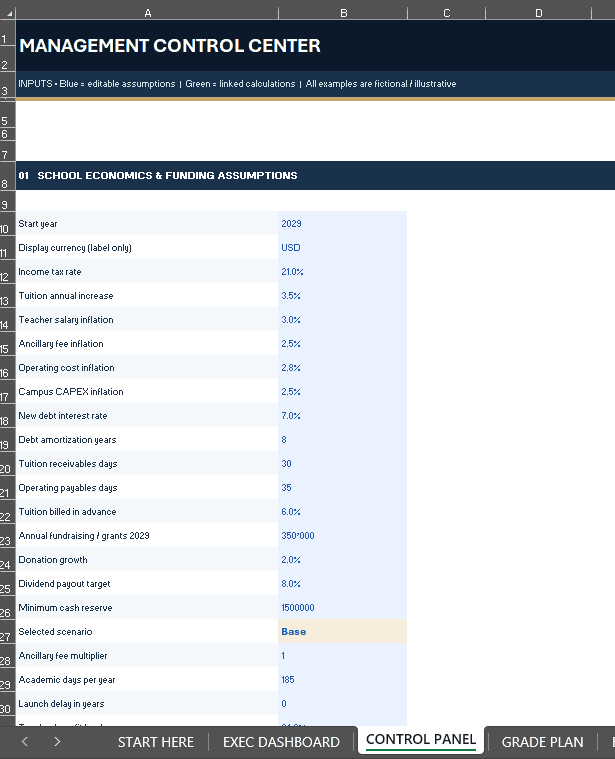
The illustrative forecast spans 2029–2038, with an editable start year. All example data and outputs are fictional and should be replaced with school-specific assumptions.
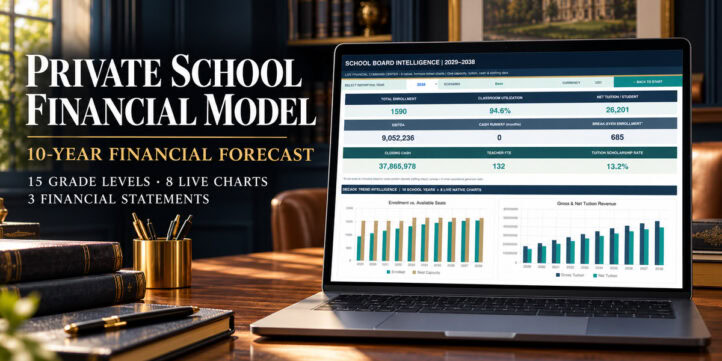
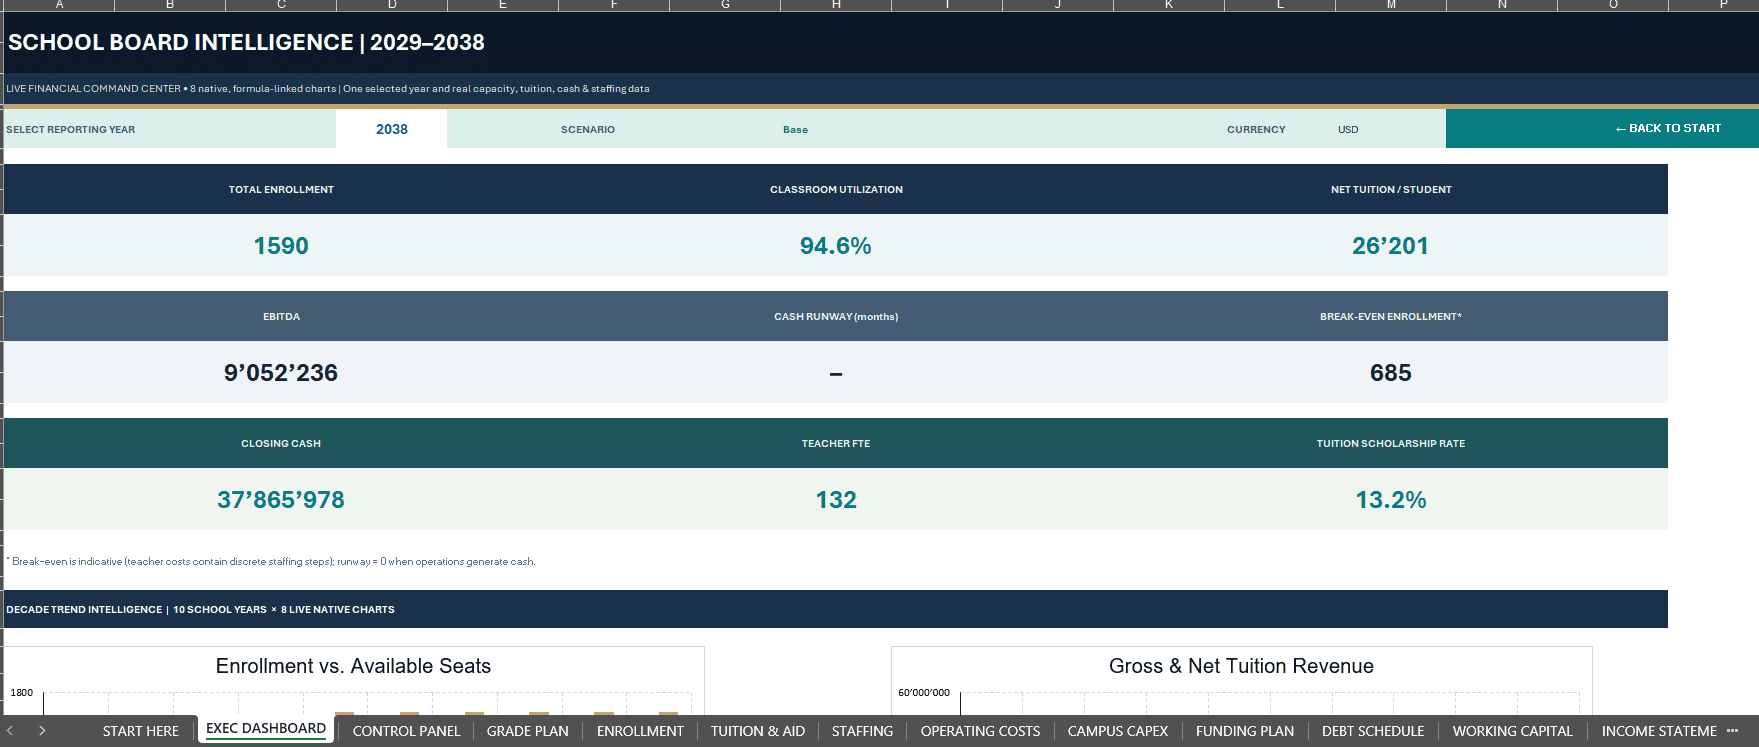
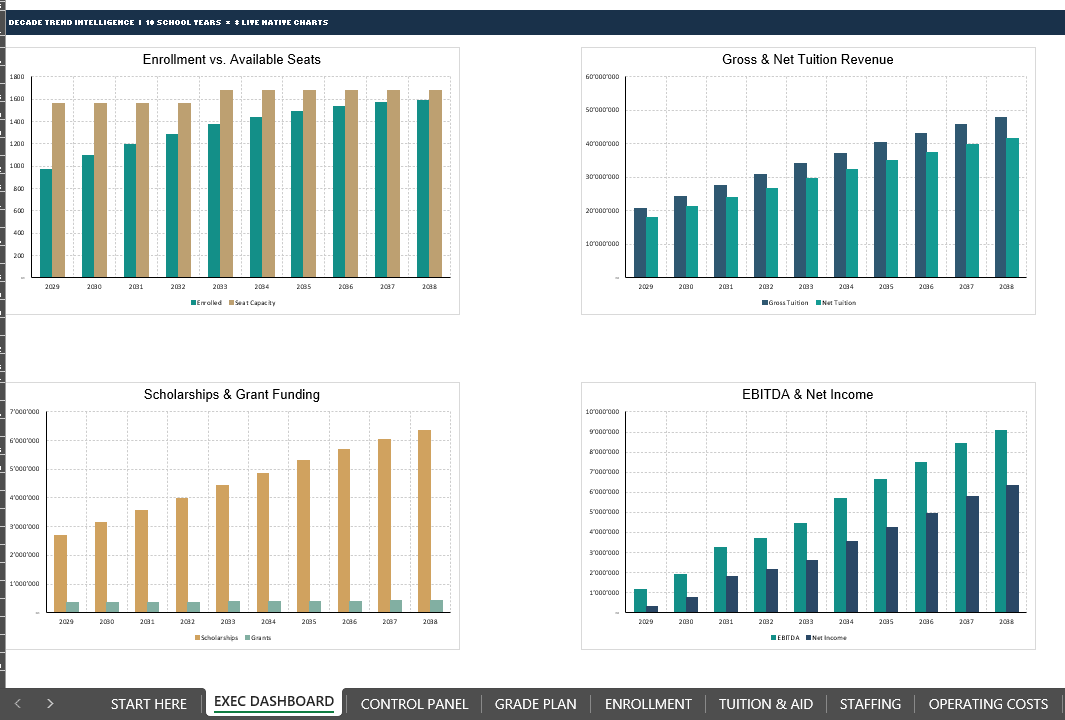
📊 EXECUTIVE DASHBOARD & EIGHT NATIVE CHARTS
Review nine reporting-year indicators:
Total Enrollment, Classroom Utilization, Net Tuition per Student, EBITDA, Cash Runway, Break-Even Enrollment, Closing Cash, Teacher FTE and Tuition Scholarship Rate.
Eight native, formula-linked charts visualize student enrollment versus available seats, gross and net tuition, scholarships and grant income, EBITDA and net earnings, cash versus debt, faculty versus non-teaching staff, classroom utilization versus tuition discounts, and campus CAPEX versus funding.
Choose the reporting year to inspect school performance without changing the underlying forecast.
🎓 ENROLLMENT, RETENTION & CLASSROOM CAPACITY
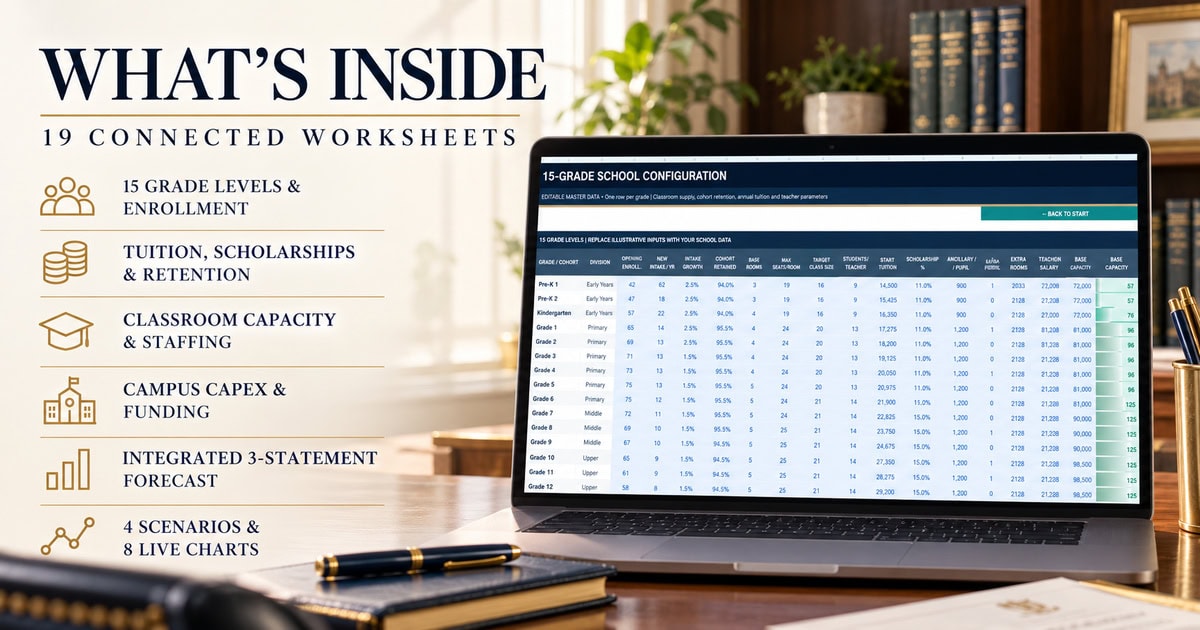
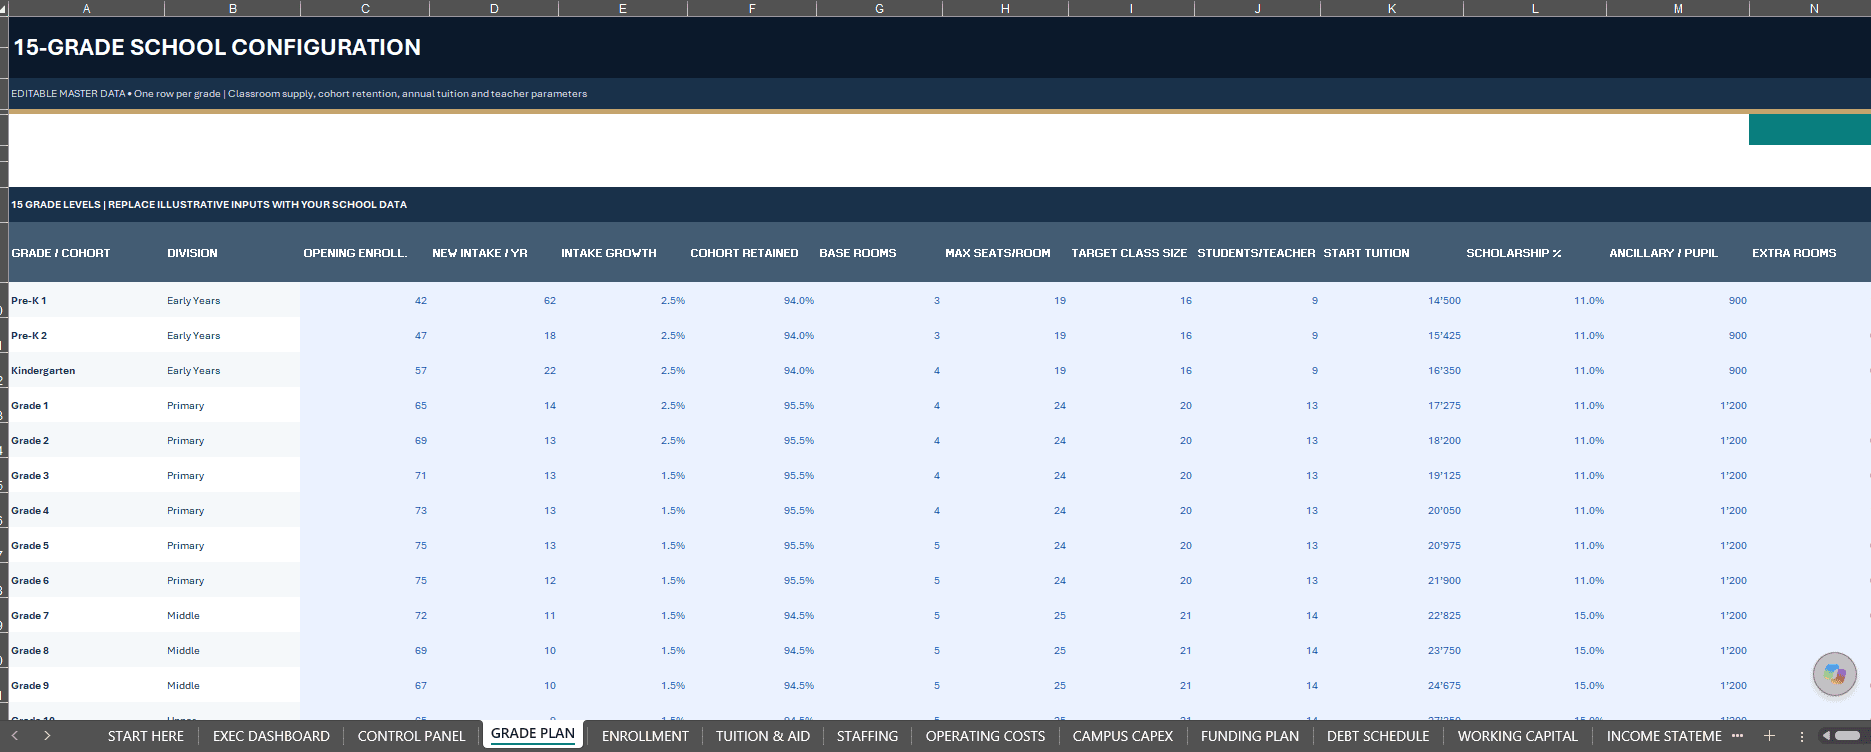
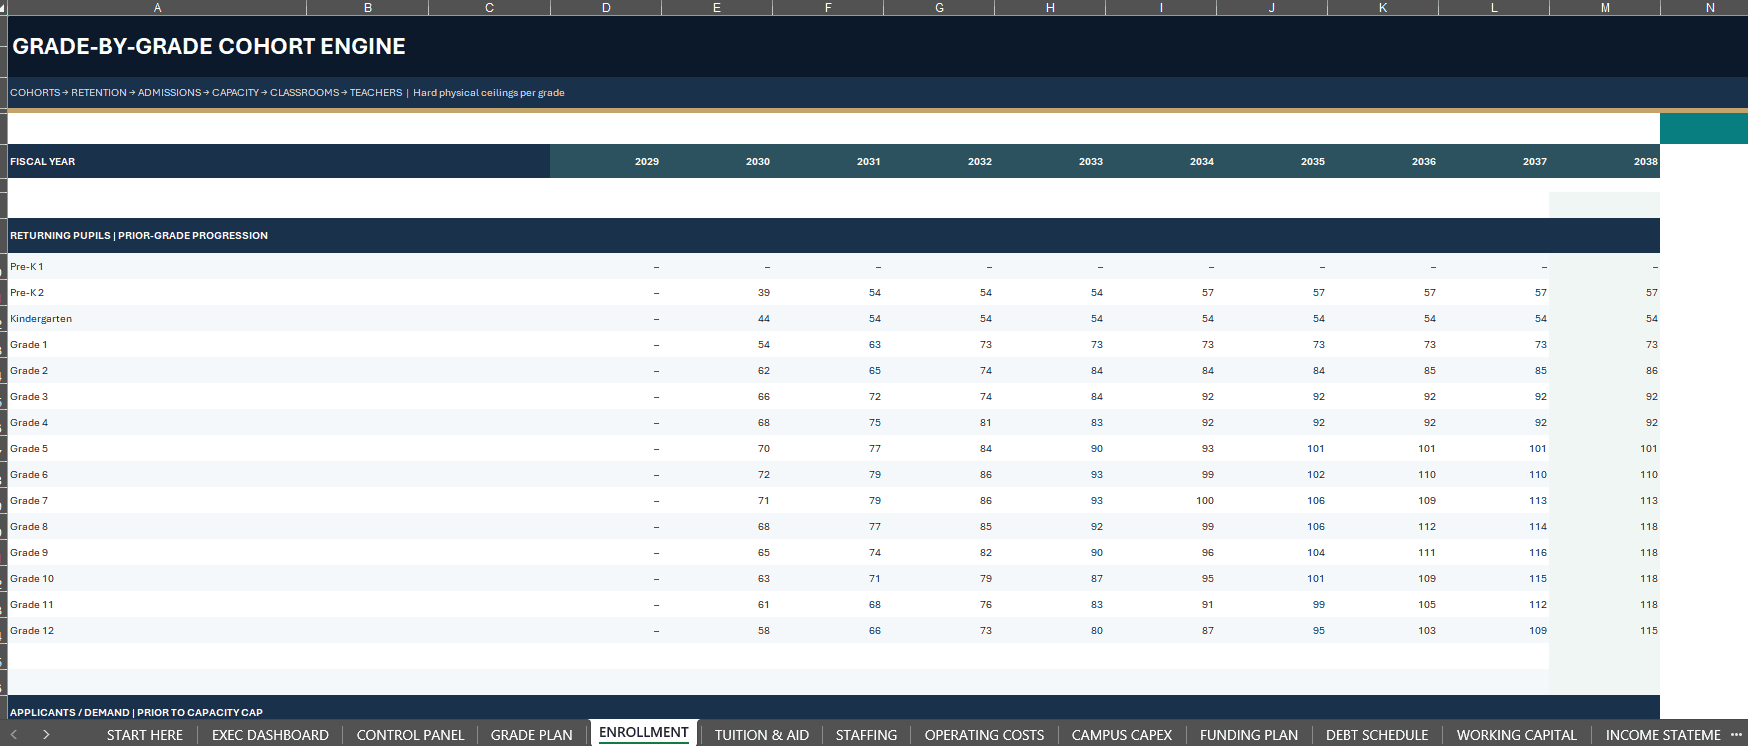
Model 15 distinct grade levels, from Pre-K 1 and Pre-K 2 through Kindergarten and Grade 12.
Customize opening enrollment, new intake, annual admissions growth, student retention, classrooms, physical seats, target class sizes, teaching ratios and phased classroom expansion.
Students progress between grade levels according to the cohort and retention assumptions.
Available seats constrain accepted admissions. Demand exceeding school capacity appears as potential waitlist demand rather than fictional enrollment or tuition revenue.
◈ TUITION, SCHOLARSHIPS & SCHOOL REVENUE
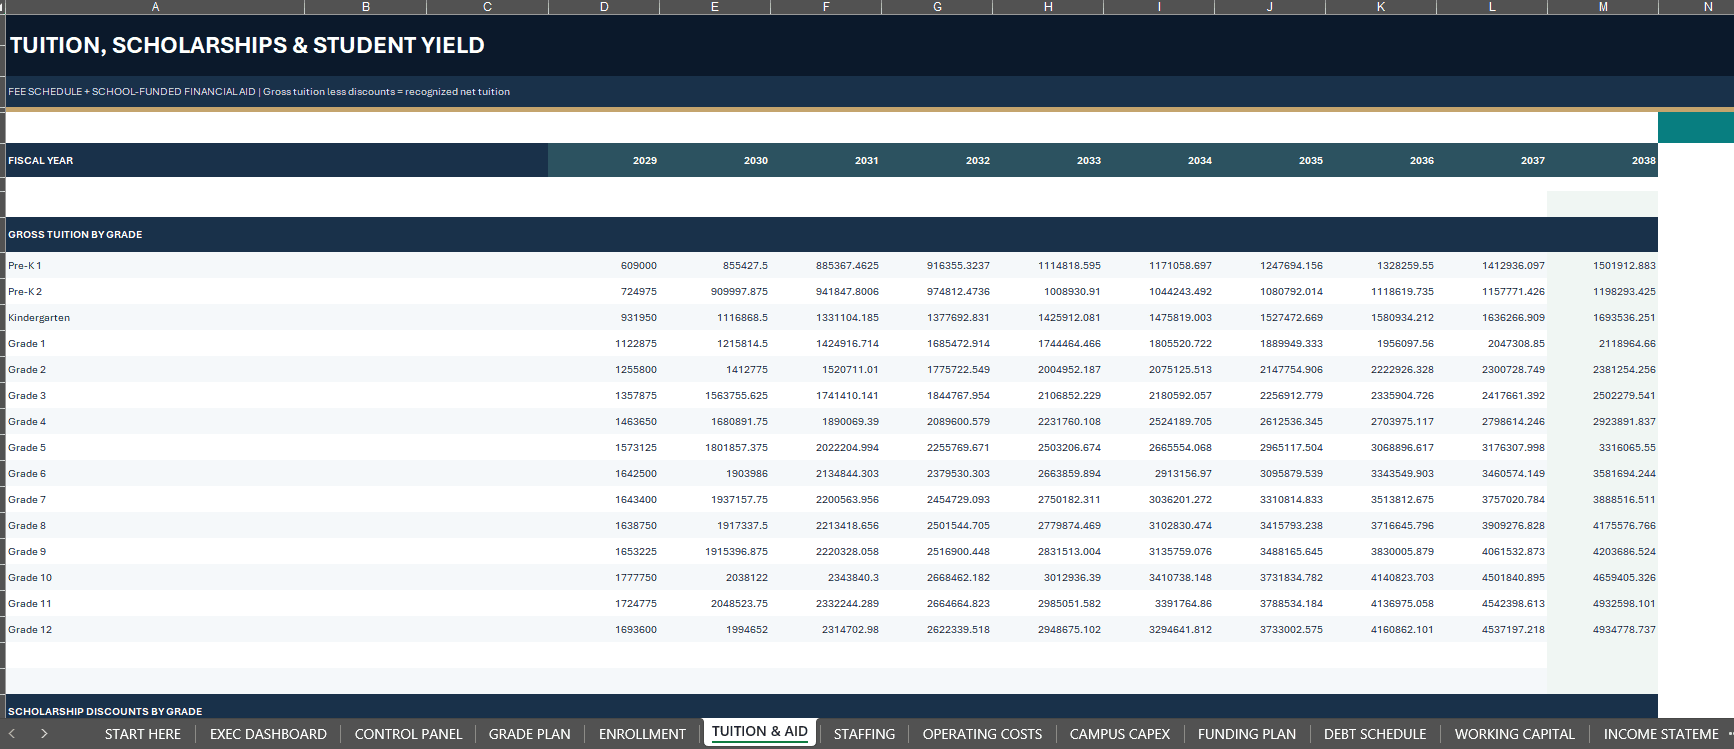
Connect actual enrollment with grade-specific tuition assumptions and annual fee escalation.
Review gross tuition, financial aid deductions, recognized net tuition, ancillary student-service income and operating grant revenue.
School-funded scholarships reduce tuition revenue rather than appearing as a second cash operating expense.
Revenue-per-student indicators help evaluate pricing, affordability and financial-aid policy.
👥 TEACHER REQUIREMENTS & OPERATING COSTS
Calculate faculty FTE using active classroom coverage and target student-to-teacher ratios.
The model incorporates staffing thresholds: an additional classroom or a change in student volume can require another teacher rather than merely increasing payroll proportionally.
Fifteen editable administrative and support-role profiles cover school leadership, admissions, finance, learning support, campus services and other operational functions.
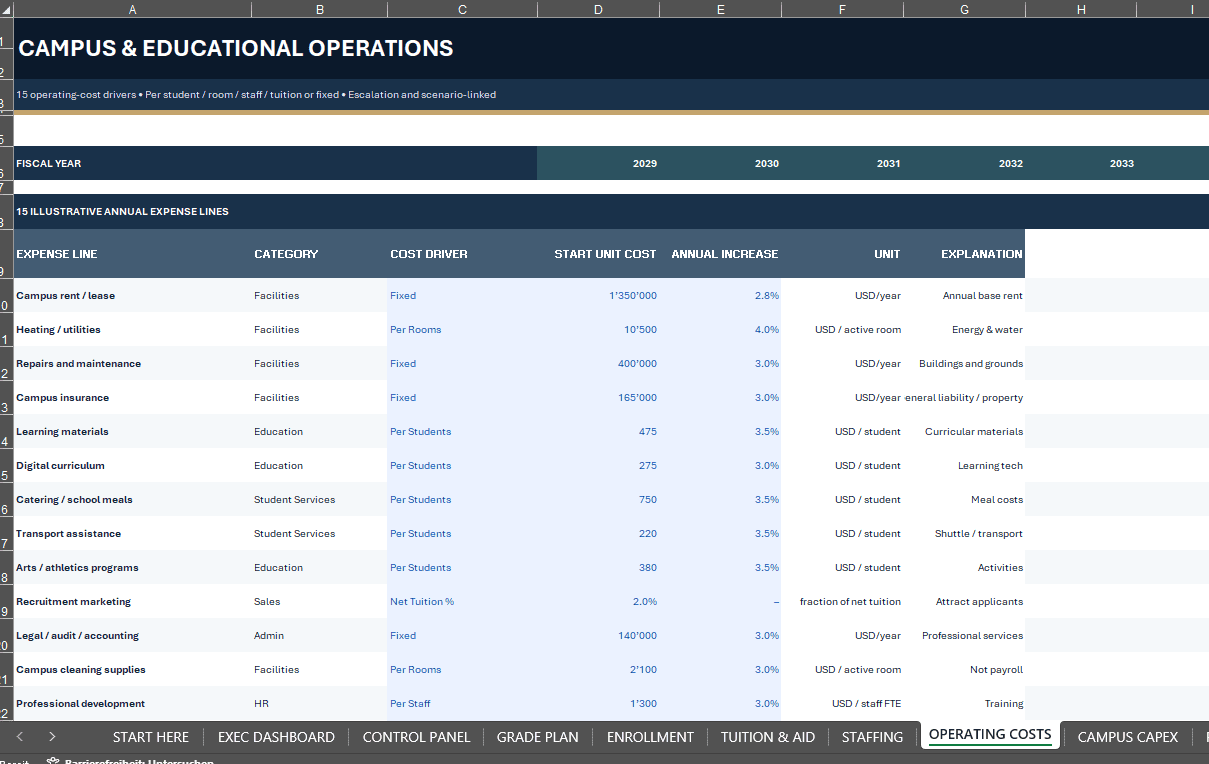
Fifteen operating-cost categories support fixed, per-pupil, per-classroom, per-staff and tuition-linked expense planning.
🏫 CAMPUS INVESTMENT, DEBT & FUNDING
Plan capital investment using 15 illustrative campus CAPEX programs, including classrooms, facilities, educational infrastructure and equipment.
Capital expenditure links to annual depreciation, cash flows and the balance sheet.
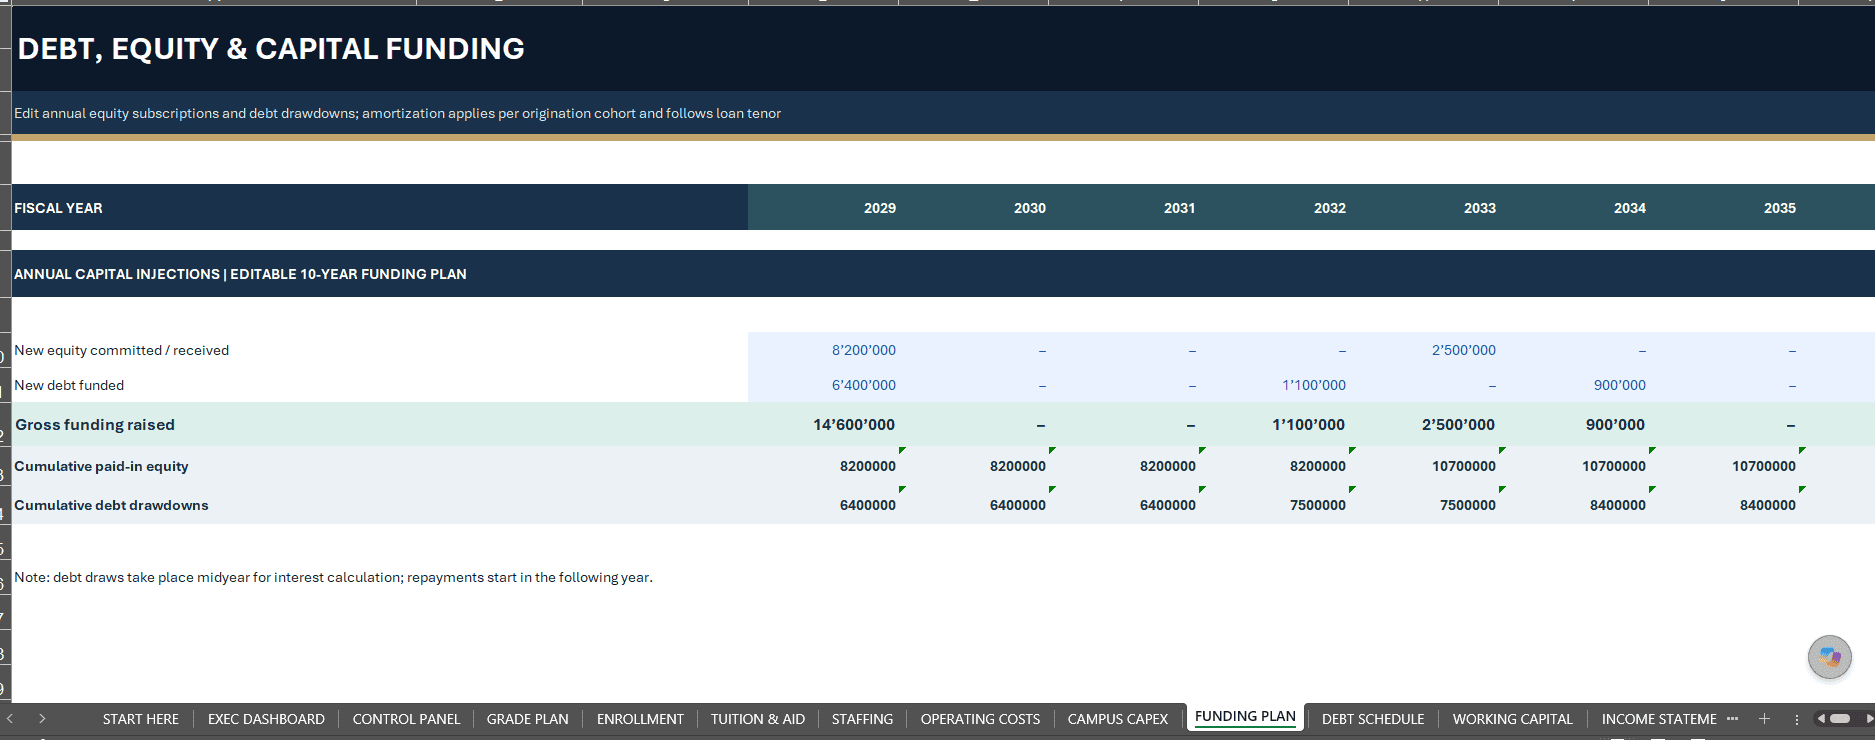
The model supports annual equity contributions, loan drawdowns, borrowing vintages, scheduled principal repayment and interest calculations.
Classroom additions must also be configured within the grade plan to increase physical capacity. Capital spending alone does not automatically create additional available seats.
📑 THREE CONNECTED FINANCIAL STATEMENTS
Follow ten annual periods of:
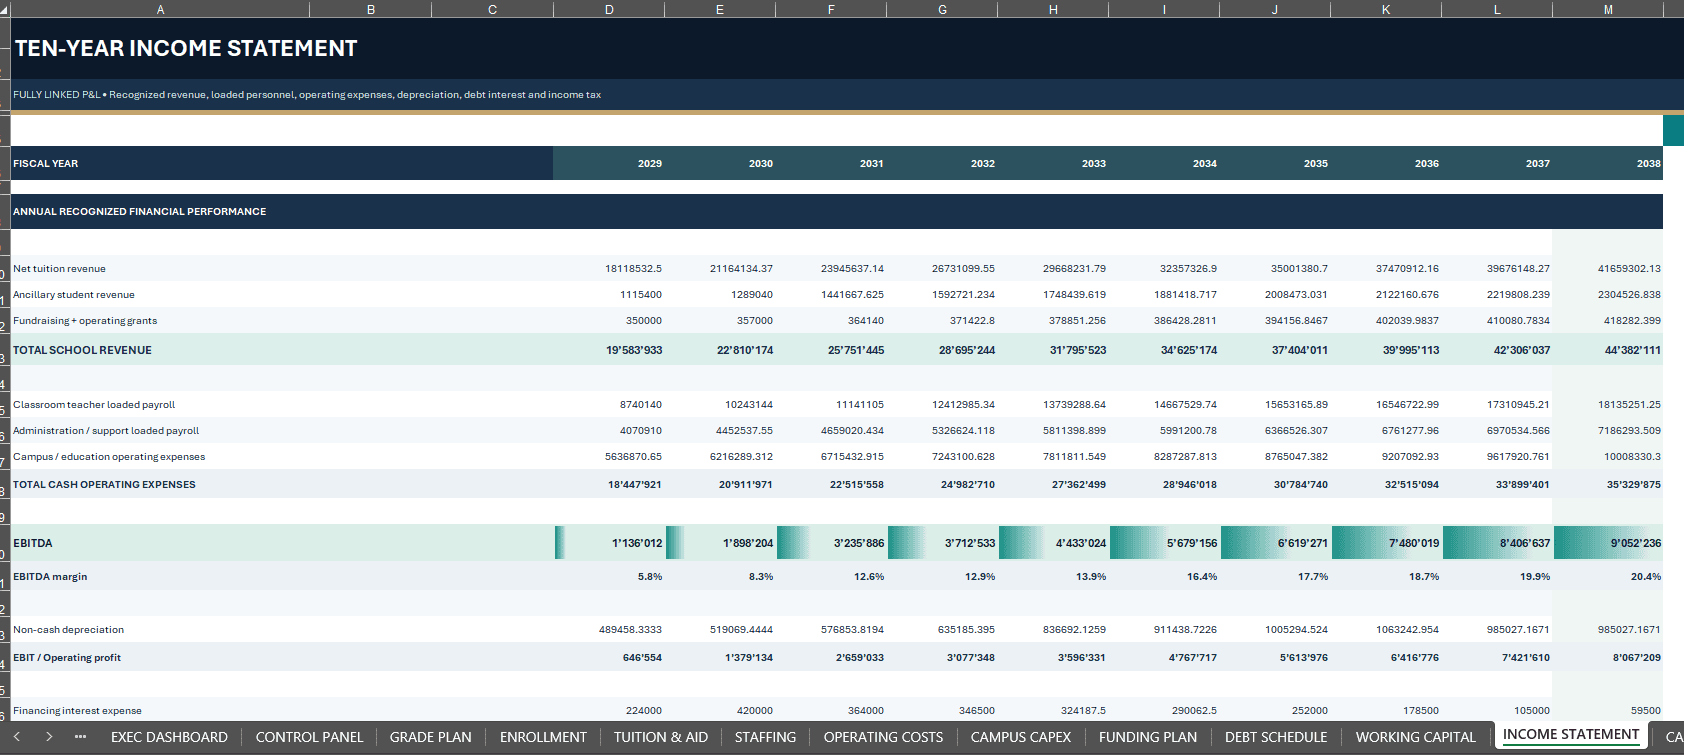
Income Statement — recognized school revenue, personnel costs, operating expenses, EBITDA, depreciation, interest, taxes and net income.
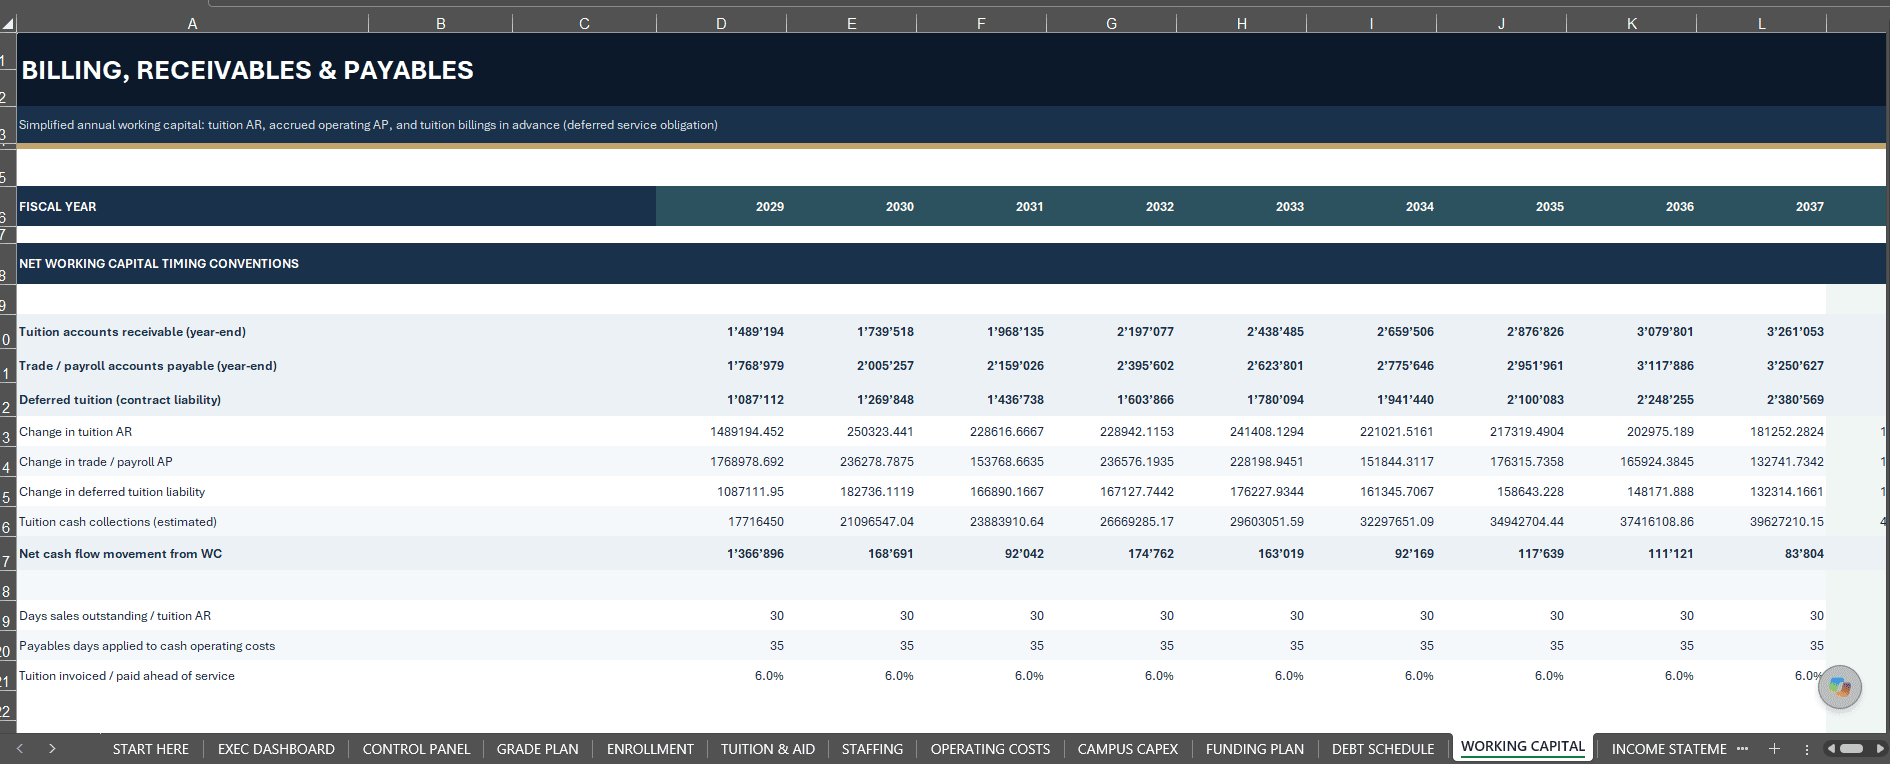
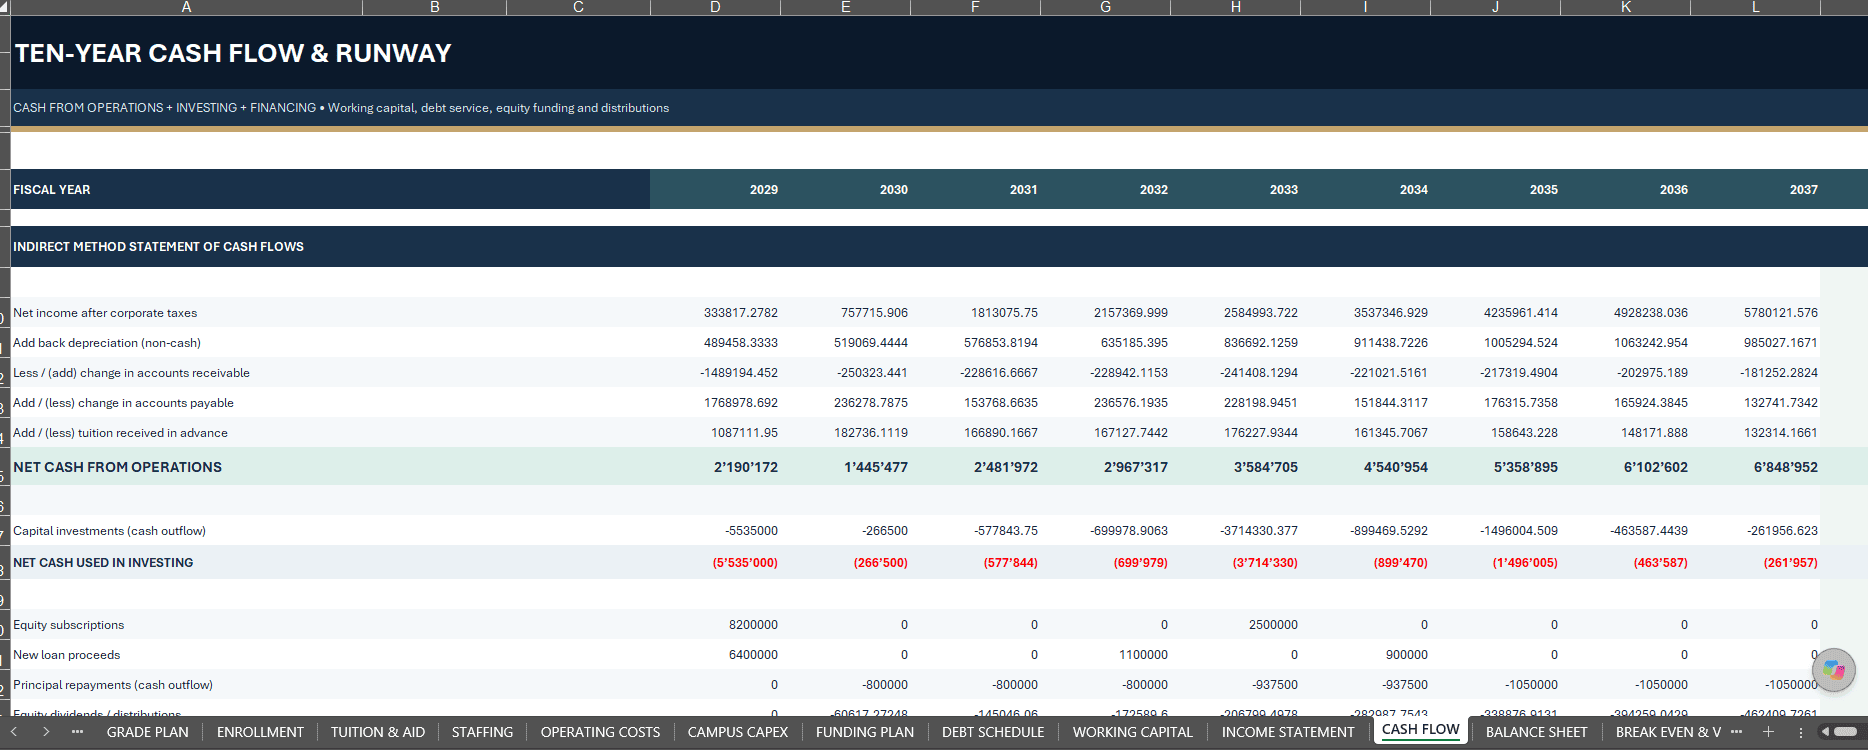
Cash Flow Statement — operating cash generation, working-capital movements, campus investment, equity funding, borrowing, debt repayment and closing cash.
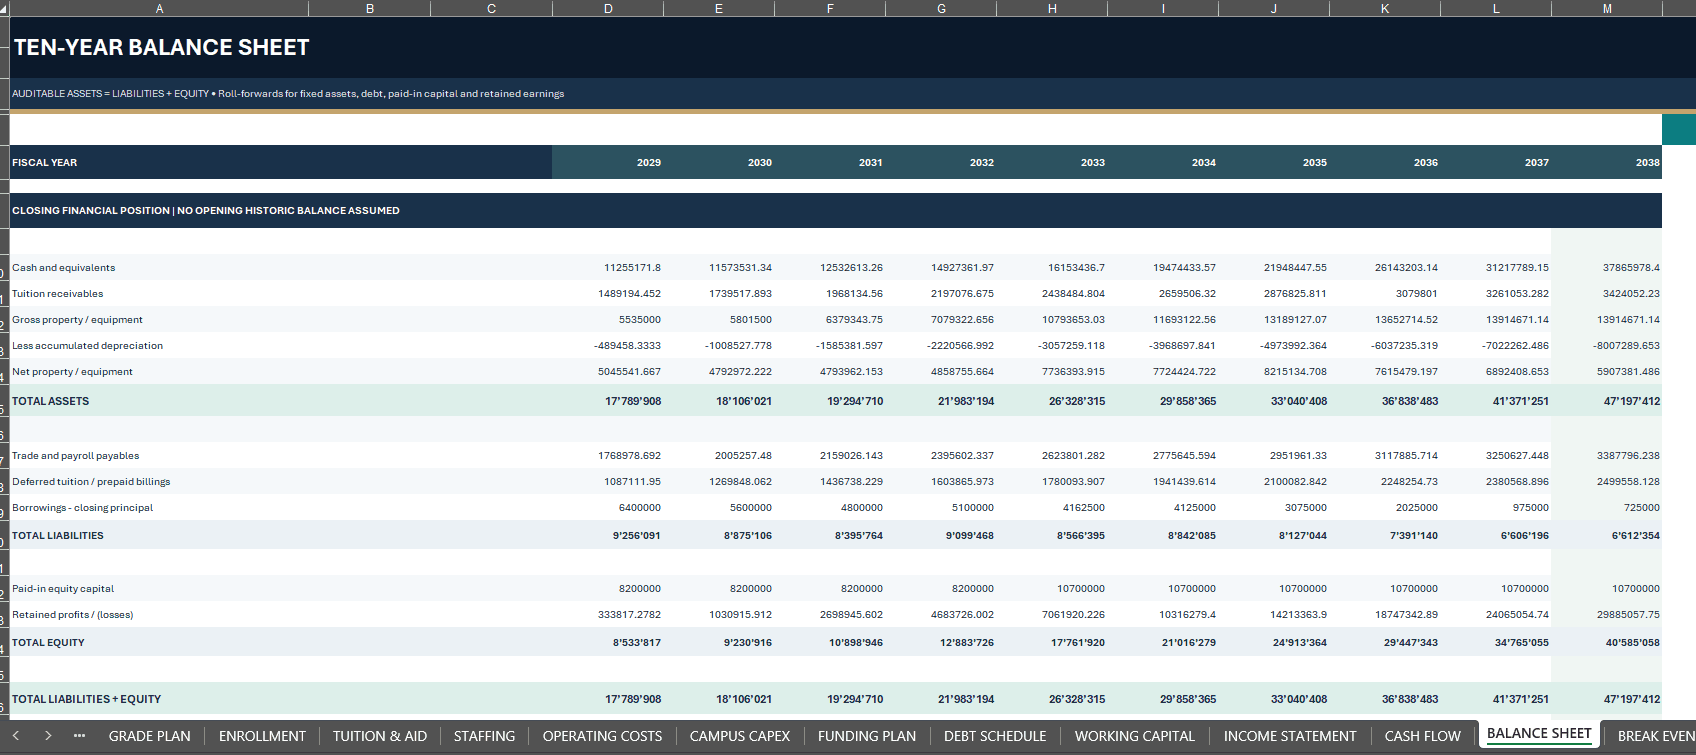
Balance Sheet — cash, tuition receivables, net fixed assets, payables, deferred tuition, borrowing and shareholder equity.
A simplified debt-service coverage indicator supports illustrative financing analysis. It is not a substitute for lender-defined covenant calculations.
🔀 FOUR LINKED SCENARIOS
Select Base, Upside, Downside or Stress.
Scenario inputs modify student demand, tuition pricing, scholarship levels, retention, staffing costs, campus operating expenses and investment assumptions.
The active scenario flows through the ten-year financial model. One scenario is calculated at a time; the workbook does not maintain four independent financial statements side by side.
The supplied fictional Downside scenario generates six years of negative cash. Stress generates nine, together with significant operating losses and a break-even enrollment requirement above modeled school capacity.
These risks are deliberately visible and are not automatically financed or corrected.
📈 BREAK-EVEN, DCF & INVESTOR RETURNS
Review indicative break-even enrollment, unlevered free cash flow, discounted cash flow enterprise value, terminal value and estimated investor equity IRR.
Break-even uses simplified student contribution economics. Because staffing requirements increase in discrete steps, the calculated threshold must be interpreted alongside actual classrooms and teacher requirements.
DCF and equity-return results depend on entered assumptions, discount rates, financing and exit conventions. They are not independently certified appraisals or guaranteed investment outcomes.
✅ MODEL CHECKS & TRANSPARENT INPUTS
Built-in annual controls cover accounting reconciliation, cash movements, CAPEX and debt schedules, classroom constraints, required faculty, tuition recognition, funding and working capital.
Separate warnings highlight negative liquidity, operating losses, waitlist constraints and break-even capacity problems.
An internal PASS indicates that implemented reconciliation relationships are satisfied. It does not verify future admissions, investment viability or compliance with educational regulations.
📦 WHAT YOU RECEIVE
1 Editable Excel Financial Model (.xlsx) with 19 worksheets:
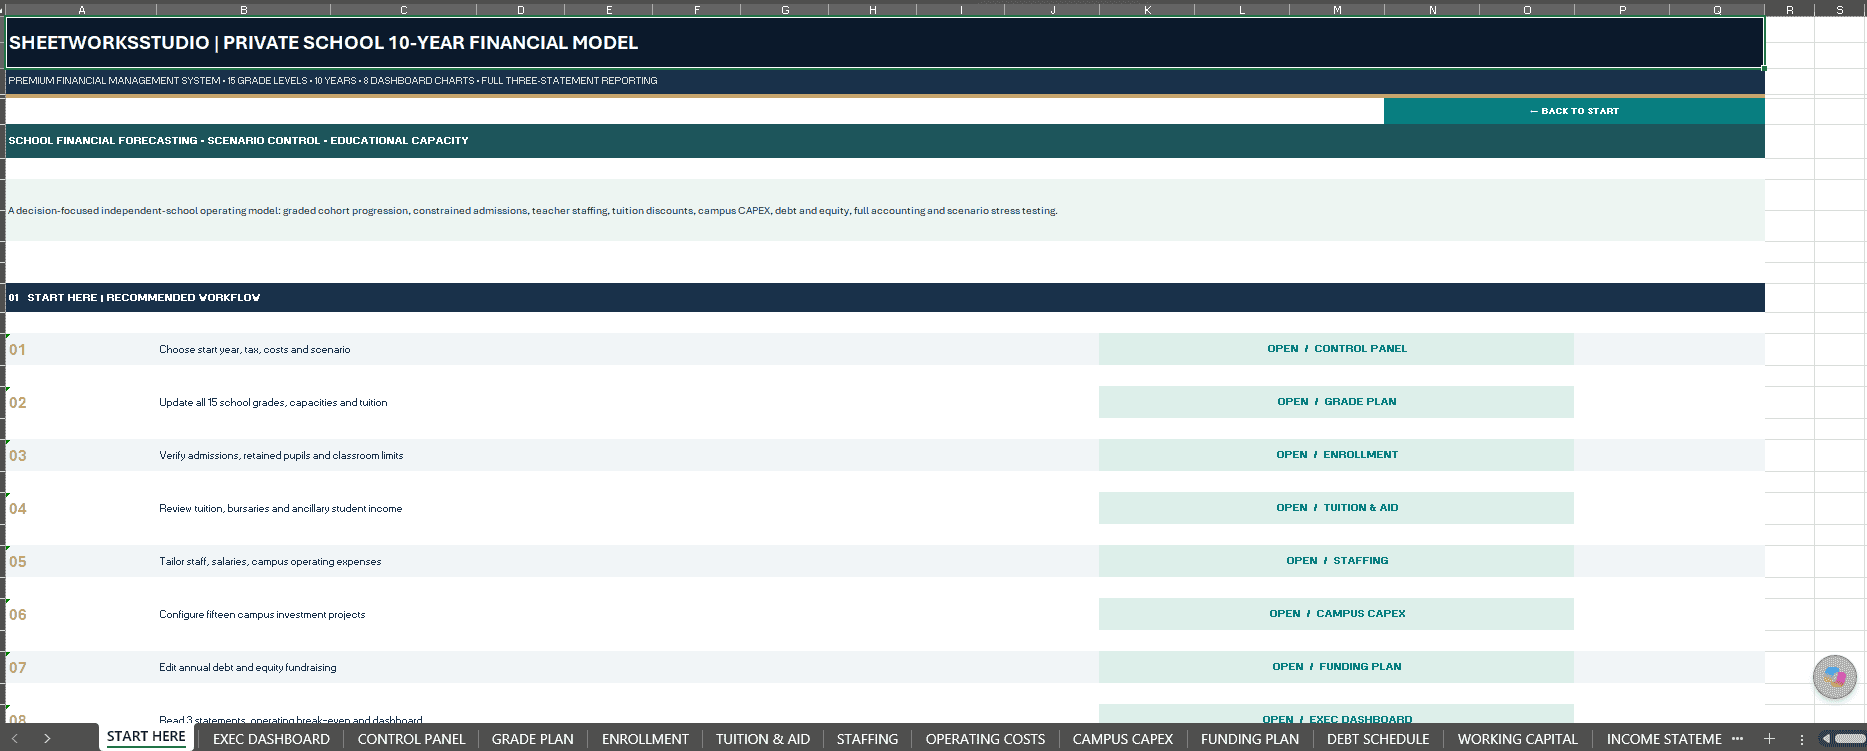
START HERE; EXEC DASHBOARD; CONTROL PANEL; GRADE PLAN; ENROLLMENT; TUITION & AID; STAFFING; OPERATING COSTS; CAMPUS CAPEX; FUNDING PLAN; DEBT SCHEDULE; WORKING CAPITAL; INCOME STATEMENT; CASH FLOW; BALANCE SHEET; BREAK EVEN & VALUE; SCENARIO LENS; MODEL CHECKS; USER GUIDE.
1 Professional 25-Page English How-to-Use PDF Guide
Detailed instructions covering model setup, grade and cohort planning, school revenue, staffing, financial statements, debt financing, dashboard charts, valuation conventions, model checks, troubleshooting, financial glossary and limitations.
The PDF guide is also available separately as a complimentary reference download. The free guide does not contain the editable Excel workbook.
🧭 GETTING STARTED
Save a project copy and open START HERE.
Set the forecast year, scenario and economic assumptions in CONTROL PANEL.
Replace sample school inputs in GRADE PLAN, customize staffing and expenses, and update the campus investment and funding schedules.
Review ENROLLMENT, TUITION & AID and all three financial statements before interpreting the dashboard and break-even or valuation outputs.
Run MODEL CHECKS after material changes.
⚙️ TECHNICAL SCOPE & COMPATIBILITY
Ten annual forecast periods, default 2029–2038.
Editable Microsoft Excel XLSX without VBA macros or live external data connections.
Microsoft Excel Desktop is recommended. A real Excel Desktop opening, recalculation and saving test and Google Sheets import have not been independently verified for this package.
The currency setting controls the display label, not automatic foreign-exchange conversion.
The model does not include detailed monthly tuition collection calendars, a student CRM, a certified classroom-safety assessment, full restricted-fund accounting, a comprehensive historical opening balance sheet or jurisdiction-specific tax schedules.
🛡️ IMPORTANT INDEPENDENT TEMPLATE DISCLAIMER
This is an independently developed, unofficial financial-planning template by SheetworksStudio.
It is not an audited, certified, regulator-approved, bank-approved or independently appraised financial model.
All sample students, tuition fees, salaries, investment costs, financing assumptions and projected outcomes are fictional.
The model does not provide individualized financial, investment, accounting, educational regulatory, tax or legal advice.
Users are responsible for independently validating their school-specific assumptions and consulting qualified professionals before making real business, financing or investment decisions.
Bring enrollment, school capacity, tuition economics and long-term financial planning into one connected ten-year Excel model.
Digital product only. No physical item is included.
Similar ProductsOther customers were also interested in...



 eFinancialModels
Electric Vehicle (EV) Charging Station Financial M...
With this comprehensive 5- or 10-year monthly tool, investors can assess the viability of setting up... Read more

Financial Model for Mobile App | Mobile App Busine...
The Mobile App Financial Plan Template in Excel allows you to develop financial projections when lau... Read more

 HenrySheykin
Food Truck Financial Model Excel Template
The Food Truck Financial Model helps entrepreneurs, founders, business owners, consultants, and anal... Read more

Green Hydrogen Production from Wind Energy Financi...
The Green Hydrogen from Wind Financial Model aims to comprehensively forecast a horizon of 40 years ... Read more

Simple Mutual Non-Disclosure Agreement Template
Protect your business secrets with ease using our Simple Mutual Non-Disclosure Agreement Template. S... Read more

Solar Energy Financial Model
The Solar Energy Financial Model Spreadsheet Template in Excel assists you in preparing a sophistica... Read more

 Peter Graf
The Customer-Centric Financial Model for Restauran...
Starting a restaurant without a financial plan is like driving a car blindfolded. You wouldn´t do i... Read more
You must log in to submit a review.