Investment Metrics to Compare Multiple Stocks / Cryptocurrencies
A general set of models that come with explainers on how you derive various financial ratios from a given asset that changes in price over time.

| Cryptocurrency, Financial Model, Financial Services, General Excel Financial Models, Stock Market |
| Excel, Net Yield, Private Equity, Return on Investment (ROI) |
This acts as a logic explainer of the most commonly accepted and used financial ratios. You can use this template to build your own investment analysis. The ratios / values you drive are going to be useful when trying to quantitatively analyze multiple stocks / cryptocurrencies against each other.
Much of the ratios are based on some benchmark measured against a given asset. There could be multiple assets measured all at once and that gives you a unique filter when looking for an investment. The primary driver of data is time-series data points over various lengths of time.
Tabs include:
Buy and Hold Return %
Returns %
Alpha
Beta
Sharpe
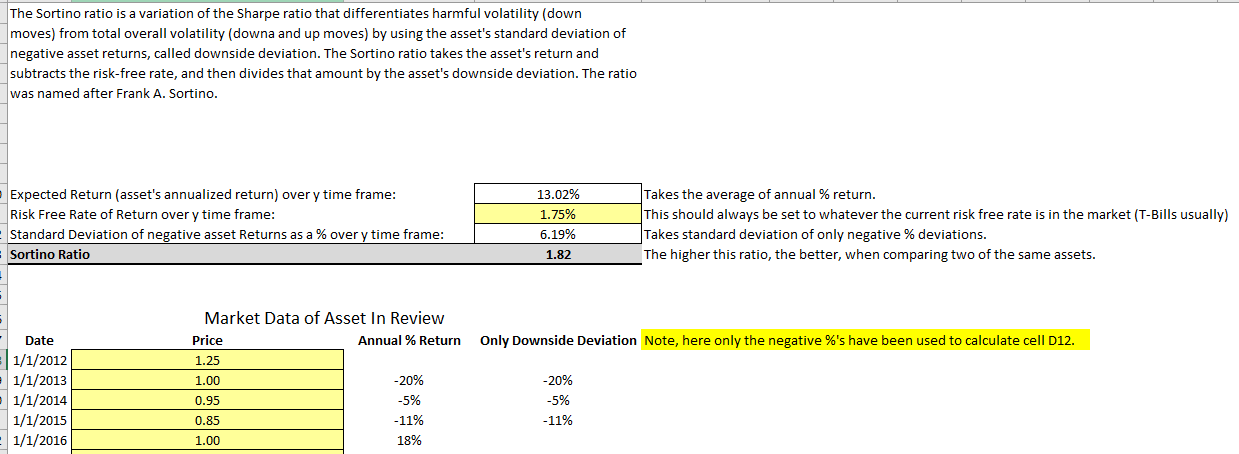
Sortino
Benchmark Returns
Drawdown
Volatility
Max Drawdown
Note this is not investment advice. Use at your own risk.

Similar Products
Other customers were also interested in...
Multi-Member Investment Fund Portfolio and Distrib...
A fund management tool to track many positions over time as well as distributions to up to 20 member... Read more
Fintech Financial Models Bundle
Financial technology (better known as fintech) is used to describe new technology that seeks to impr... Read more
Hedge Fund Soft Fee Model
A model that calculates hedge fund fees based on performance of the account over time. Includes a hi... Read more
Investment Fund Preferred Return Tracker: Up to 30...
Track preferred returns for investors in a fund with this template. Premium joint venture tracking t... Read more
Private Equity Fund Model (Investor Cashflows)
Private Equity Financial Model to analyze fund cashflows and returns available to Limited Partners (... Read more
Asset Management Company – Closed End Fund M...
Financial Model presenting a scenario of a Closed-End Fund managed by an Asset Management Compan... Read more
Alternative Investment Company Valuation Template
Alternative Investment Company Valuation: All-In-One Model for Private Equity, Asset Management, and... Read more
The Bitcoin Farm Model – Economics
The primary purpose of this model is to assess the feasibility of a Bitcoin farm by taking into acco... Read more
Crypto Trading Platform – 5 Year Financial Model
Financial Model presenting an advanced 5-year financial plan of a Crypto Trading Platform allowing c... Read more
You must log in to submit a review.


