Inventory Analysis and Management
In this publication, I discuss how to analyze inventory: balance movements, days inventory outstanding, turnover, seasonality, aging, planning orders.
This set of tools explains how to analyze inventory, communicate findings of your analysis and make practical use of them. The main areas covered by the analysis are:
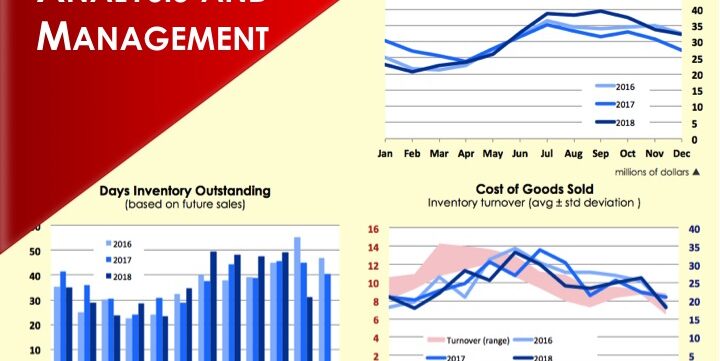
1. Understand what drives your inventory balances. This includes analyzing the movements of inventory by product and seeing which products affected the change to the largest extent. This analysis includes a horizontal waterfall showing the changes graphically. Inventory balances are reduced by Sales and increased by Purchases. There is another visual tool, also based on a horizontal waterfall chart, showing the effect of these two factors and giving an idea of how total inventory flows compare to inventory balances.
2. Days Inventory Outstanding. Unlike many other calculations that take inventory balance at some date and COGS (or revenues) in that period, I am using a formula taking the actual COGS in prior (or subsequent) periods and returning the actual number of days covered by the inventory balance. Writing this formula is clearly an Excel challenge that is solved in a smart way using the OFFSET, MMULT, and other functions. I am giving two alternative calculations here: based on past and future sales.
3. Inventory seasonality – many businesses are prone to seasonal changes in sales which affects inventory balances, turnover, and cost of sales.
4. Aging of inventory – this part explains how to calculate inventory reserve and demonstrates inventory balances by products and by age groups in a professionally designed chart.
5. Planning orders taking into account inventory requirements and delivery time.
Many of the methods used in this publication can be applied to other types of financial analysis (e.g. making aging of accounts receivable, planning cash receipts based on sales payment terms).
As a bonus tip, the publication explains in detail how to create a horizontal waterfall chart. This is a smart and efficient type of chart visualizing variances between the numbers. It will surely make your presentations look professional and your reports – impress your clients, managers, and colleagues. This chart is compatible with all versions of Excel.
You will get:
– 1 Full Excel Model Template (.xlsx)
– 1 Instruction/Documentation file (.pdf)
Similar Products
Other customers were also interested in...
Product Dealer Startup – The Customer Centri...
With this financial model, you can create a financial plan for the startup of your product dealershi... Read more
Bundle – Business Financial Forecasting Mode...
The purpose of this Bundle of Business Forecasting and Financial Models is to assist Business Owners... Read more
Complete Three-Statement Monthly Budget with Scena...
This is a comprehensive set of templates that will help you build your budget. The templates are bui... Read more
Complete Three-Statement Quarterly Budget with Sce...
This is a comprehensive set of templates that will help you build your budget. The templates are bui... Read more
Complete Three-Statement Quarterly Budget
This is a comprehensive set of templates that will help you build your budget. The templates are bui... Read more
Complete Three-Statement Monthly Budget
This is a comprehensive set of templates that will help you build your budget. The templates are bui... Read more
Complete Private Equity (LBO) Financial Model
This is a professional financial model which performs a thorough assessment of a private equity proj... Read more
Private Equity Fund Model (Investor Cashflows)
Private Equity Financial Model to analyze fund cashflows and returns available to Limited Partners (... Read more
All My Financial Models, Spreadsheets, Templates, ...
Lifetime access to all future templates as well! Here is a set of spreadsheets that have some of the... Read more
Startup Company Financial Model – 5 Year Fin...
Highly-sophisticated and user-friendly financial model for Startup Companies providing a 5-Year adva... Read more
You must log in to submit a review.


