
0 ITEMS

Goat Farming Financial Model Excel Template
The Goat Farming Financial Model helps entrepreneurs, farm owners, consultants, analysts, and business plan writers turn a goat farming concept into a structured financial forecast. Instead of estimating herd growth, milk production, meat sales, cheese revenue, labor costs, feed expenses, capital investments, and cash flow separately, this template brings the major planning assumptions into one organized model. It is designed to support practical financial planning for a goat farming startup, expansion project, agribusiness proposal, or funding presentation. This financial model template is especially useful for users who need to understand how a goat farm may perform before committing capital. It helps estimate revenue assumptions across multiple product lines, plan startup costs such as shelter construction, fencing, equipment, vehicles, and working capital, and forecast operating expenses including feed, land lease, wages, animal care, utilities, and other recurring costs. By connecting operational drivers with financial outputs, the model supports more informed decision-making and reduces reliance on guesswork. The template also helps users evaluate payroll requirements, profitability, cash flow, and long-term growth potential. Goat farming can involve significant upfront investment and ongoing working capital needs, so having a structured view of monthly and annual performance is important for budgeting and funding preparation. The model is built to help users test assumptions, compare scenarios, review financial statements, and identify when the business may reach break-even under different conditions. Built for planning, lending discussions, investor reviews, and internal management, the Goat Farming Financial Model provides a ready-to-use framework that can be edited for a specific farm size, location, pricing strategy, herd plan, and product mix. Users can customize assumptions in Excel or Google Sheets, review charts and dashboards, and prepare clear outputs for stakeholders. Whether you are launching a new goat farm, expanding an existing livestock operation, or preparing a professional goat farming business plan, this template provides a practical financial foundation for analysis, budgeting, and strategic decision-making.
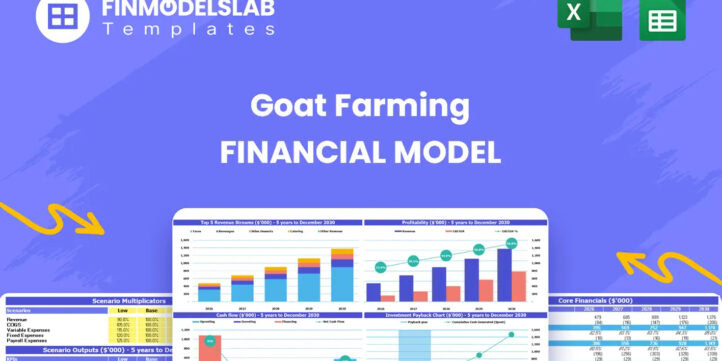


Financial Model Overview
The Goat Farming Financial Model is a ready-to-use financial model template designed to help entrepreneurs, farm owners, consultants, analysts, and business plan writers evaluate the financial potential of a goat farming business. Goat farming requires careful planning because revenue depends on herd size, annual production yield, product mix, pricing, livestock health, capacity, and market demand, while costs may include shelters, fencing, feed, labor, land lease, veterinary support, transportation, and working capital. This template brings these assumptions into a structured forecasting model so users can estimate revenue, operating expenses, capital investment, cash flow, profitability, and funding needs in one place. It is useful for startup planning, farm expansion, lender discussions, investor presentations, internal budgeting, and long-term agribusiness strategy. The model is editable, compatible with Excel and Google Sheets, and built to support decision-making with practical outputs rather than disconnected estimates.
All-in-One Dashboard
The all-in-one dashboard gives users a central view of the most important inputs and outputs in the Goat Farming Financial Model. This component is designed to simplify financial planning by connecting core assumptions such as herd size, production yield, product mix, pricing, startup investment, operating expenses, and staffing with key outputs such as revenue, gross profit, EBITDA, net income, cash flow, and funding needs. Instead of searching through multiple sheets to understand the overall business case, users can review the farm’s projected performance from a single summary area. This is especially useful for founders and farm operators who need to make quick decisions about whether the proposed herd scale, production plan, and cost structure are financially realistic. The dashboard can also support stakeholder conversations by presenting the model’s logic in a clear format, helping users explain how operational assumptions translate into financial results and long-term feasibility.
Low, Base, and High Scenario Analysis
The low, base, and high scenario analysis component allows users to compare how the goat farming business may perform under different operating and market conditions. Goat farming projections can change significantly if milk prices fluctuate, meat demand shifts, production yield improves, feed costs rise, herd expansion is delayed, or labor requirements increase. This section gives users a structured way to test conservative, expected, and optimistic cases without rebuilding the entire model from scratch. Inputs may include variations in active herd count, annual production per head, product pricing, growth rates, cost percentages, and staffing levels, while outputs may include changes in revenue, profitability, payback timing, cash flow, and capital requirements. Scenario analysis is valuable for funding preparation because investors and lenders often want to know how resilient the business is if results come in below plan. It also helps operators identify which assumptions have the greatest impact on profitability and where contingency planning may be needed.
Professional Charts
The professional charts component converts the financial forecast into visual reports that are easier to understand and present. A goat farming financial plan may include many moving parts, including multiple revenue streams, herd growth assumptions, production yield, cost categories, payroll expansion, capital expenditures, and profitability trends. Charts help users see these patterns more clearly by displaying revenue growth, expense composition, cash flow movement, margin trends, and other key performance indicators over time. This component is useful for business plans, pitch decks, bank meetings, internal reviews, and management updates because it turns detailed spreadsheet outputs into presentation-ready visuals. Users can use the charts to show how the farm scales from its initial herd size to a larger operation, how revenue streams evolve across milk, meat, cheese, yogurt, and fiber, and how operating efficiency affects profitability. Clear visuals help stakeholders absorb the financial story faster and can make the business case more credible.
ROE Components and DuPont Analysis
The ROE components section uses DuPont analysis to help users understand the drivers behind return on equity in the goat farming business. Rather than looking only at final profit, this component breaks financial performance into the underlying factors that influence shareholder or owner returns, such as profitability, asset efficiency, and financial leverage. Inputs may include net income, revenue, assets, equity, debt levels, and other balance sheet assumptions, while outputs help show whether returns are being driven by strong margins, efficient use of farm assets, or the way the business is financed. For a capital-intensive agribusiness, this analysis can be useful because goat farming often requires investment in land access, shelters, fencing, equipment, vehicles, and working capital before revenue fully scales. DuPont analysis helps business owners and analysts evaluate whether the farm is generating adequate returns from the capital invested and whether expansion plans are improving or weakening overall financial efficiency.
Revenue Inputs
The revenue inputs component gives users a structured place to define the commercial assumptions that drive the goat farm’s income forecast. Goat farming revenue may come from several products, including fresh goat milk, chevon meat, artisanal goat cheese, goat yogurt, and goat fiber, and each stream can have different pricing, volume, and production assumptions. This section may use inputs such as active heads, annual production per head, expected yield, product mix percentages, selling prices, growth rates, and ramp-up timing. By organizing these assumptions clearly, the model helps users create a revenue forecast that reflects how the farm actually operates rather than relying on a single generic sales estimate. It is useful for testing whether a planned herd size can support enough product volume, whether premium products such as cheese or yogurt improve margins, and how changes in pricing affect total revenue. Strong revenue inputs are essential for creating a reliable goat farming business plan and for explaining the basis of projected sales to investors, lenders, or partners.
Bank-Ready Reports
The bank-ready reports component provides structured financial outputs that can support lender discussions, funding applications, and professional stakeholder reviews. Goat farming businesses may require financing for startup capital, infrastructure, livestock acquisition, equipment, vehicles, feed reserves, and early working capital, so lenders typically want to review clear financial statements and repayment capacity. This component helps organize outputs such as projected profit and loss, cash flow, balance sheet, funding needs, profitability metrics, and key assumptions in a format that is easier for banks and financing partners to evaluate. It is useful because it connects the farm’s operating plan with the financial evidence needed to support a loan request or investment proposal. Rather than presenting informal estimates, users can show how revenue grows, how operating costs are managed, when cash shortages may occur, and whether the business generates enough cash to support debt obligations. Clear reports also help improve credibility when presenting the goat farming plan to advisors, grant programs, and potential investors.
Revenue Breakdown
The revenue breakdown component gives users a detailed view of how each revenue stream contributes to total farm income. In a goat farming business, income may not come from one source only, and different products can carry different levels of demand, margin, production effort, and seasonality. This section helps separate revenue from fresh goat milk, chevon meat, artisanal goat cheese, goat yogurt, goat fiber, or other customized product lines so users can see which activities drive the business model. Inputs may include product mix percentages, units sold, selling prices, production yields, herd growth, and annual pricing changes, while outputs may show revenue by category, total sales, revenue share, and growth contribution over time. This is useful for deciding whether the business should focus on high-volume milk production, value-added dairy products, meat sales, or a diversified mix. It also helps users explain their commercial strategy in a business plan and make better decisions about processing capacity, marketing priorities, distribution channels, and investment allocation.
KPI Dashboard and Performance Benchmarks
The KPI dashboard and performance benchmarks component helps users monitor the financial and operational metrics that matter most for goat farming performance. This section may include indicators related to revenue growth, gross margin, EBITDA margin, net profit margin, cash balance, payback timing, return metrics, cost ratios, production efficiency, and performance against agribusiness benchmarks. Inputs come from the model’s revenue, cost, payroll, capital expenditure, and financial statement sections, while outputs are summarized into a performance view that can be reviewed quickly by owners, managers, analysts, and stakeholders. For goat farming, benchmarking is valuable because it helps users assess whether assumptions are reasonable and whether the operation is becoming more efficient as the herd expands. If feed costs, labor costs, or overhead consume too much revenue, the KPI dashboard can highlight pressure points early. This component supports ongoing management after launch as well as pre-launch planning, making it easier to track progress against targets and communicate performance in a clear, data-driven way.
Startup and Operating Cost Planning
The startup and operating cost planning component helps users estimate the investment required to launch and run the goat farming business. Startup costs may include barn and shelter construction, fencing and pasture infrastructure, livestock acquisition, milking equipment, storage systems, transportation vehicles, processing equipment, licenses, deposits, insurance, initial feed inventory, and cash reserves. Operating costs may include feed and supplements, veterinary services, land lease, employee wages, utilities, maintenance, transportation, packaging, marketing, and administrative expenses. This section is useful because goat farming can require meaningful upfront capital before the business reaches stable production, and recurring expenses can create cash pressure if they are underestimated. By organizing costs into clear categories, the model helps users budget realistically, calculate funding needs, and identify where spending can be phased or optimized. It also allows users to adjust costs for their specific farm size, geography, production approach, and growth plan, making the template more relevant for both small farms and larger commercial operations.
Break-Even Analysis
The break-even analysis component helps users understand when the goat farming business may generate enough revenue to cover its costs and begin producing sustainable profit. This section connects revenue assumptions, gross margins, direct costs, payroll, overhead, and capital structure to determine the level of sales or time period needed to reach break-even. Inputs may include selling prices, production volumes, product mix, variable costs, fixed monthly expenses, labor costs, and startup investment, while outputs may include the break-even date, required revenue level, margin of safety, and payback indicators. Break-even analysis is especially important for entrepreneurs and lenders because it shows whether the farm can realistically move from launch phase to stable operations. It also helps users evaluate the impact of slower herd growth, lower yields, weaker pricing, or higher feed costs. By understanding break-even requirements, business owners can set revenue targets, manage expenses more carefully, plan cash reserves, and make better decisions about pricing, production strategy, and funding.
Cash Flow and Funding Requirements
The cash flow and funding requirements component helps users evaluate liquidity, working capital needs, and financing gaps throughout the forecast period. A goat farm may appear profitable on paper while still facing cash shortages due to upfront capital expenditures, inventory purchases, feed costs, payroll timing, debt payments, seasonality, or delayed customer collections. This section may use inputs such as startup costs, operating expenses, revenue timing, loan proceeds, repayment schedules, owner investment, taxes, and minimum cash balance assumptions. Outputs can include monthly and annual cash flow, ending cash balance, funding required, surplus cash, and periods where additional capital may be needed. This component is valuable for planning because it helps users avoid undercapitalization and understand how much money must be available before and after launch. It also supports conversations with lenders and investors by showing how funds will be used, when the business may become self-sustaining, and whether the farm can maintain enough liquidity to operate confidently during growth.
File types:
Excel – Single-User: .xlsx
Excel – Multi-User: .xlsx
Similar ProductsOther customers were also interested in...


 HenrySheykin
Cattle Farming Financial Model Excel Template
The Cattle Farming Financial Model helps users turn a cattle farm concept, expansion plan, or fundin... Read more
Hydroponics Financial Model Excel Template
The Hydroponic Farming Financial Model helps entrepreneurs, growers, consultants, analysts, and busi... Read more
Hemp Farming Financial Model Excel Template
The Hemp Farming Financial Model Template helps entrepreneurs, farm owners, consultants, analysts, a... Read more
Dairy Farming Financial Model Excel Template
Purchase Dairy Farming Financial Projection. Sources & Uses, Profit & Loss, Cash Flow statem... Read more
Aquaponics Financial Model Excel Template
The Commercial Aquaponics Financial Model helps users turn a capital-intensive aquaponics concept in... Read more
Sheep Farming Financial Model Excel Template
The Sheep Farming Financial Model helps entrepreneurs, farm owners, consultants, analysts, and busin... Read more
Garden Nursery Financial Model Excel Template
The Garden Nursery Financial Model helps entrepreneurs, nursery owners, consultants, analysts, and b... Read more
Horse Boarding Financial Model Excel Template
The Horse Boarding Financial Model helps turn a stable, equestrian center, or horse boarding concept... Read more
Garlic Farming Financial Model Excel Template
The Garlic Farming Financial Model helps entrepreneurs, growers, consultants, analysts, and business... Read more
Plant Nursery Financial Model Template
The Plant Nursery Financial Model helps entrepreneurs, nursery owners, consultants, analysts, and bu... Read more
You must log in to submit a review.