
0 ITEMS

Food Delivery Financial Model Excel Template
The Food Delivery Service Financial Model helps founders, entrepreneurs, business owners, consultants, and analysts turn a delivery platform concept into a structured financial forecast. Instead of estimating orders, commissions, delivery costs, payroll, marketing spend, and cash flow separately, the template connects the major assumptions in one editable model. It is built to support financial planning for a food delivery startup, local delivery marketplace, restaurant delivery platform, or expansion of an existing delivery operation. This financial model template helps users plan revenue assumptions around order volume, average order value, commission rates, fixed transaction fees, subscriptions, seller promotions, and other income streams. It also supports practical cost planning by organizing startup costs, operating expenses, platform development, payroll, driver-related costs, marketing budgets, overhead, and ongoing technology expenses. By linking these inputs to projected profit and loss, cash flow, and performance outputs, the model gives users a clearer view of what it may take to launch, scale, and sustain the business. The template is useful for preparing business plans, investor materials, lender discussions, internal budgets, and strategic decision-making. Users can test assumptions, review profitability, evaluate cash requirements, and understand how growth in buyers, restaurants, sellers, and order frequency affects the overall financial picture. It also helps highlight critical issues for delivery businesses, including customer acquisition costs, contribution margins, cash burn, funding gaps, and the point at which the company may reach break-even. Designed to be editable and ready to use, the Food Delivery Service Financial Model saves time compared with building a forecast from scratch. It gives non-financial users a practical structure while still offering the outputs investors, lenders, and stakeholders expect to see. Whether you are validating a new concept, refining a pitch, planning startup costs, estimating operating expenses, reviewing payroll needs, forecasting cash flow, or assessing profitability, this model provides a disciplined framework for making better financial decisions before and after launch.
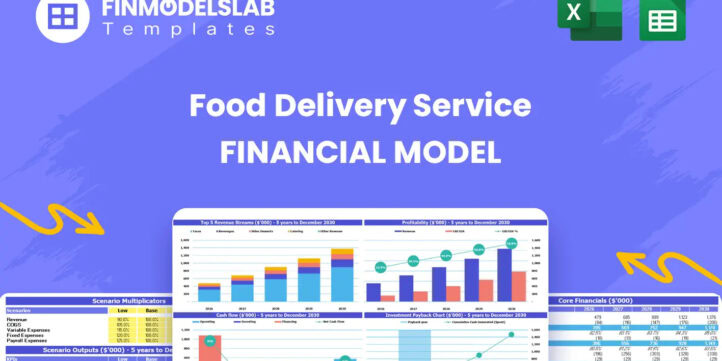


Financial Model Overview
The Food Delivery Service Financial Model is a ready-to-use financial model template designed to help entrepreneurs, founders, consultants, analysts, and business owners evaluate the economics of a food delivery platform before launch, fundraising, or expansion. A delivery business depends on several connected drivers, including customer acquisition, restaurant participation, order frequency, average order value, commission rates, transaction fees, driver payouts, marketing spend, technology costs, payroll, and cash reserves. This template brings those assumptions together in a structured forecast so users can move beyond rough estimates and build a more defensible financial plan. It supports planning for revenue, expenses, startup investment, cash flow, profitability, funding needs, and business performance over a multi-year period. The model is fully editable, so users can adjust assumptions for their own market, pricing strategy, growth plan, operating model, and funding scenario. It is especially useful for business plans, investor presentations, lender discussions, budgeting, and internal decision-making, giving users a practical way to understand whether the food delivery service can scale profitably and what financial milestones need to be managed along the way.
All-in-One Dashboard
The all-in-one dashboard gives users a central view of the most important inputs and outputs in the Food Delivery Service Financial Model. Rather than searching across separate worksheets to understand performance, users can review the core assumptions, forecast results, cash position, revenue outlook, profitability indicators, and other key financial metrics in one place. This component is useful because food delivery businesses involve many moving parts, from order volume and customer activity to driver costs, platform expenses, marketing spend, and subscription revenue. The dashboard helps connect these drivers to the overall financial outcome, making it easier to see how changes in assumptions affect projected sales, costs, margins, cash flow, and long-term performance. It also supports faster decision-making because founders and stakeholders can quickly identify whether the business is on track, where the most important risks may be, and which assumptions deserve closer review. For investor or lender conversations, the dashboard provides a clean summary that communicates the business model clearly without requiring the audience to work through every detailed calculation in the file.
Low, Base, and High Scenario Analysis
The low, base, and high scenario analysis component allows users to compare different possible outcomes for the food delivery service under conservative, expected, and optimistic assumptions. This is particularly valuable for a delivery platform because results can change significantly based on customer adoption, restaurant onboarding, average order value, commission rates, marketing efficiency, and driver cost structure. In a low case, users can model slower order growth, higher acquisition costs, or weaker margins to understand downside risk and funding pressure. In a base case, users can present the most realistic plan based on current research and operating expectations. In a high case, users can test what happens if market adoption improves, order frequency rises, or higher-margin revenue streams grow faster than expected. The output helps users compare revenue, EBITDA, cash flow, funding requirements, and profitability across scenarios. This makes the model more useful for strategic planning because it does not rely on a single forecast. Instead, it helps founders and analysts understand a range of possible outcomes and prepare for different levels of growth, investment need, and operational execution.
Professional Charts
The professional charts component turns the financial forecast into visual outputs that are easier to understand, present, and discuss. Food delivery financial models can include detailed calculations across revenue streams, expenses, cash flow, payroll, and investment assumptions, but decision-makers often need a clear visual summary of the story behind the numbers. The charting section helps users communicate revenue growth, cost behavior, profitability trends, cash balance movement, margin development, customer growth, and other major performance indicators in a presentation-ready format. These visuals are useful for investor decks, lender meetings, internal reviews, board updates, and business planning documents. They can also help users identify trends that may not be obvious when looking only at rows of numbers, such as a period of heavy cash burn, a delay in margin improvement, or a sharp increase in operating expenses caused by staffing or marketing. Because the charts are connected to the model’s assumptions and forecast outputs, they can update as users revise the plan. This saves time and helps keep the financial story consistent across the model, business plan, and stakeholder materials.
ROE Components and DuPont Analysis
The ROE components and DuPont analysis section helps users understand the drivers behind return on equity rather than viewing it as a single isolated percentage. For a food delivery service, profitability and investor returns depend on how efficiently the business converts revenue into profit, how well it uses assets, and how the capital structure supports growth. This component breaks return on equity into more detailed drivers so users can see the relationship between profit margin, asset turnover, and financial leverage. Inputs may include net income, revenue, assets, equity, debt assumptions, and forecast balance sheet values, while outputs help explain whether projected returns are driven by healthy operating margins, efficient use of capital, or reliance on financing. This is useful for investors, founders, and analysts because it provides a more disciplined view of financial performance and sustainability. If ROE improves over time, users can examine whether that improvement comes from stronger unit economics, higher order volume, better cost control, or changes in funding structure. The analysis adds depth to the model and supports more informed conversations about value creation, growth quality, and long-term financial viability.
Revenue Inputs
The revenue inputs component is where users define the key commercial assumptions that drive the food delivery service forecast. These assumptions may include customer growth, active buyer counts, order frequency, average order value, take rate, fixed order fees, buyer subscriptions, seller subscriptions, advertising fees, promotion fees, and other platform revenue sources. For a delivery marketplace, revenue is not simply a flat sales estimate; it is built from user behavior, restaurant participation, transaction volume, and monetization strategy. This section helps users structure those assumptions clearly and test how each revenue driver contributes to the overall forecast. For example, users can see how a change in commission rate affects revenue, how increased order frequency improves gross merchandise value, or how seller subscriptions add more predictable income. The outputs generated from these inputs flow into the revenue forecast, profit and loss statement, cash flow forecast, dashboard, charts, and valuation-related metrics. This makes the section central to financial planning because it connects market strategy with measurable financial results. It also helps users create a more credible forecast by documenting the logic behind revenue growth instead of relying on unexplained top-line projections.
Bank-Ready Reports
The bank-ready reports component organizes the financial outputs into a format suitable for lenders, investors, advisors, and other external stakeholders. A food delivery service may need funding for platform development, app creation, marketing, working capital, payroll, operations, and early-stage losses before the business reaches sustainable profitability. Lenders and funding partners typically want to see structured financial statements, clear assumptions, realistic cash flow projections, and evidence that the business understands its repayment or funding requirements. This reporting section helps present the forecast in a professional way, including outputs such as projected profit and loss, cash flow statements, balance sheet summaries, financing requirements, and performance metrics. The reports help users explain how much capital is needed, when it is needed, how it will be used, and how the business expects to generate enough cash to support operations. They are also useful for internal planning because they bring financial discipline to the launch and growth process. Instead of presenting scattered assumptions, users can provide a lender-friendly view of the business that supports more productive funding discussions and helps stakeholders assess risk, liquidity, and profitability.
Revenue Breakdown
The revenue breakdown component gives users a detailed view of how each income stream contributes to total revenue. Food delivery services often generate income from multiple sources, such as variable commissions on order value, fixed fees charged per transaction, subscription fees from buyers, subscription fees from restaurants or sellers, advertising placements, promoted listings, and optional service fees. This section helps users understand the mix of revenue rather than only reviewing the total amount. It can show which streams are expected to drive early sales, which become more important as the platform scales, and which offer higher-margin opportunities over time. Inputs may include the number of active customers, restaurants, orders, fee rates, subscription prices, adoption levels, and promotional product usage. Outputs may include revenue by category, percentage contribution by stream, monthly and annual revenue totals, and comparisons across forecast years. This is useful for pricing strategy and decision-making because it helps users evaluate whether the business is too dependent on commissions, whether subscription revenue can improve stability, or whether advertising and seller services can support margin expansion. It also gives investors a clearer view of how the delivery service intends to monetize both sides of the marketplace.
KPI Dashboard
The KPI dashboard component tracks the performance metrics that matter most for a food delivery platform. In this type of business, traditional revenue and profit figures are important, but they do not tell the full story. Users also need to monitor operational and financial indicators such as customer acquisition cost, lifetime value, payback period, order frequency, average order value, take rate, gross merchandise value, contribution margin, active buyers, active sellers, churn assumptions, cash burn, internal rate of return, return on equity, and months to payback. The KPI dashboard consolidates these metrics into an accessible view so users can measure whether the business model is becoming stronger over time. Inputs come from the model’s revenue assumptions, marketing budget, customer growth forecast, cost structure, and financial statements, while outputs help users evaluate scalability, efficiency, and investor attractiveness. This component is especially useful for decision-making because it highlights the relationship between growth and profitability. For example, a company may generate more orders but still face weak economics if acquisition costs are too high or delivery margins are too low. The KPI dashboard helps users identify those issues early and make better decisions about pricing, marketing, operations, and funding.
Startup Cost Breakdown
The startup cost breakdown component helps users estimate the initial investment required to prepare the food delivery service for launch and early operations. A delivery platform can require significant upfront spending before meaningful revenue is generated, including platform development, mobile app development, website setup, server infrastructure, payment system integration, legal setup, licensing, branding, launch marketing, office setup, equipment, recruiting, and working capital. This section organizes those costs so users can see how much funding may be needed, when costs are expected to occur, and which categories make up the largest share of the startup budget. Inputs may include one-time setup expenses, development costs, deposits, pre-opening payroll, technology infrastructure, marketing launch campaigns, and contingency reserves. Outputs can feed into funding requirements, cash flow projections, balance sheet assumptions, and investor-ready summaries. This is useful because many food delivery startups underestimate the cash needed to build a reliable platform, acquire the first users, onboard restaurants, and support operations before reaching scale. A structured startup cost section helps founders budget more accurately, explain use of funds to investors or lenders, and avoid launching with insufficient capital. It also allows users to revise the plan if they choose to outsource development, build technology in-house, start in a smaller market, or phase the launch across multiple cities.
Break-Even Analysis
The break-even analysis component helps users estimate when the food delivery service may reach the point where revenue covers its startup and operating costs. This is one of the most important outputs for a platform business because early losses are common while the company invests in technology, marketing, restaurant acquisition, customer support, and operating infrastructure. The break-even section uses assumptions from the revenue forecast, cost of goods sold, driver-related expenses, payroll, overhead, marketing spend, and other operating expenses to determine when the business may become profitable. Users can test how different assumptions affect the break-even date, such as increasing commission rates, improving average order value, reducing customer acquisition cost, lowering driver payouts, adding subscription revenue, or managing fixed costs more efficiently. Outputs may include monthly profitability trends, cumulative cash requirements, break-even timing, and the relationship between order volume and margin coverage. This section is useful for financial planning, funding discussions, and strategic decision-making because it shows whether the business has a realistic path to sustainability. It also helps users understand which levers have the greatest impact on profitability, allowing them to focus on the operational improvements that can shorten the path to break-even and reduce the amount of outside capital required.
File types:
Excel – Single-User: .xlsx
Excel – Multi-User: .xlsx
Similar ProductsOther customers were also interested in...

 HenrySheykin
Grocery Store Financial Model Excel Template
The Grocery Store Financial Model helps entrepreneurs, founders, consultants, analysts, and retail b... Read more
Bakery Financial Model Excel Template
The Bakery Financial Model helps entrepreneurs, bakery owners, consultants, analysts, and business p... Read more
Juice Bar Financial Model Excel Template
The Juice Bar Financial Model helps entrepreneurs, founders, consultants, analysts, and business own... Read more
Clothing Manufacturing Business Plan Financial Mod...
The Clothing Manufacturing Financial Model helps users turn a garment production concept into a stru... Read more
Tea Cafe Financial Model Excel Template
The Tea Room Financial Model helps entrepreneurs, operators, consultants, and business planners turn... Read more
Bar Financial Model Excel Template
The Bar Financial Model Financial Model Template helps entrepreneurs, bar owners, consultants, analy... Read more
Pizzeria Financial Model Excel Template
The Pizza Restaurant Financial Model Template helps entrepreneurs, restaurant owners, consultants, a... Read more
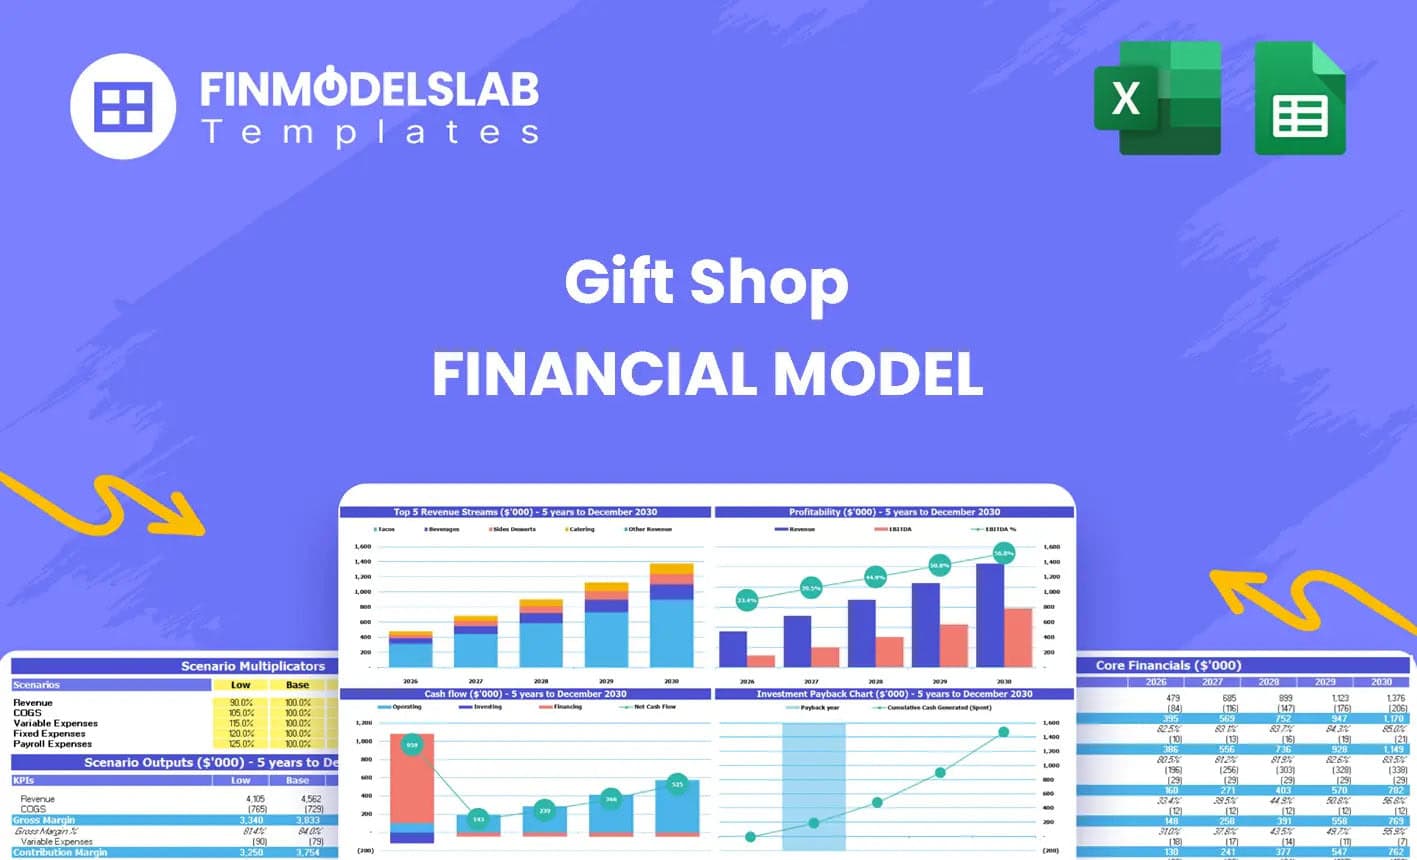
Gift Shop Financial Model Excel Template
The Gift Shop Financial Model helps users build a structured financial forecast for a retail gift st... Read more

Gas Station Financial Model Excel Template
The Gas Station Financial Model Financial Model Template helps entrepreneurs, business owners, consu... Read more
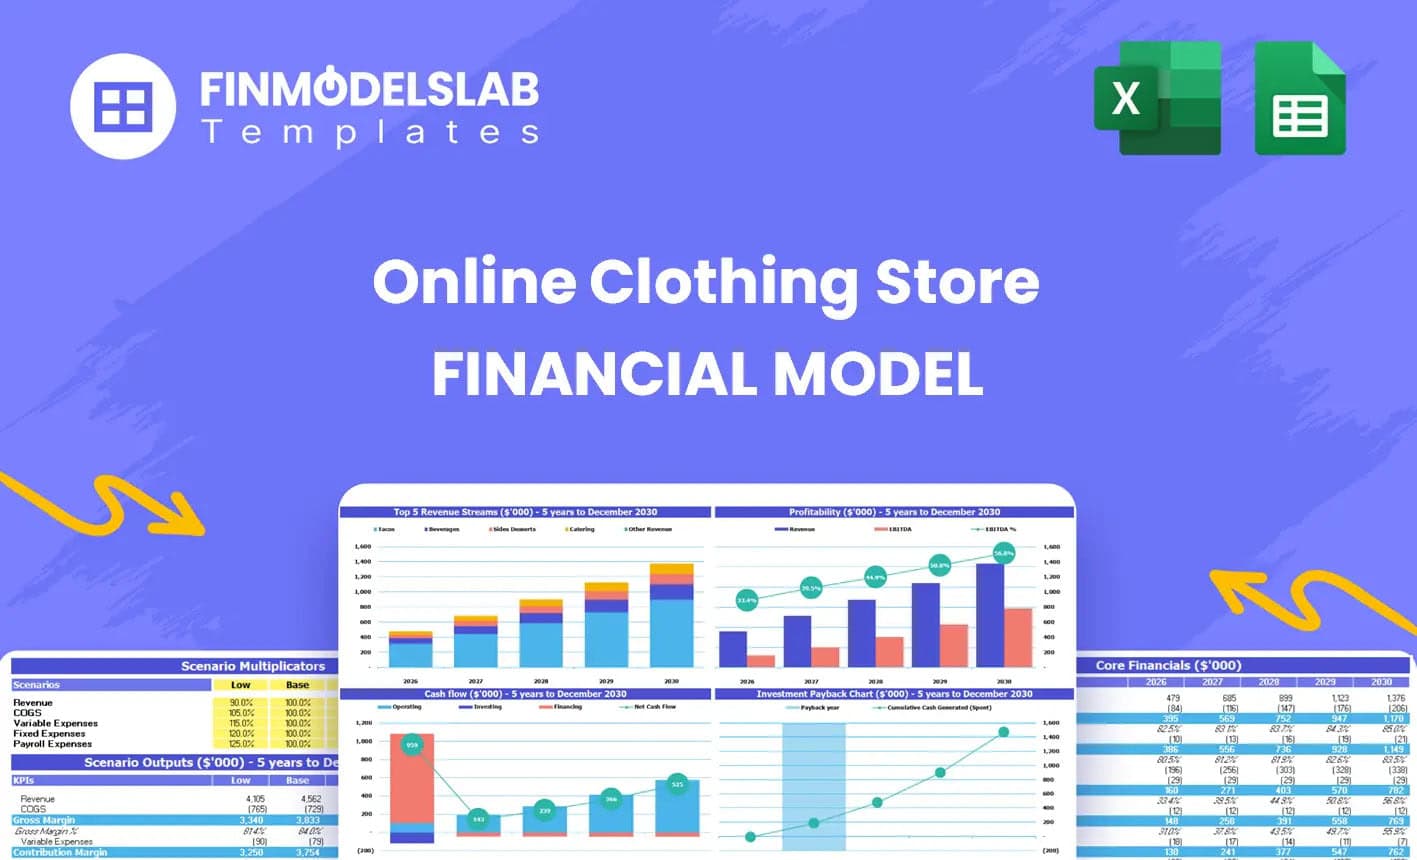
Online Clothing Store Financial Model Excel Templa...
The Online Clothing Store Financial Model helps founders, entrepreneurs, business owners, consultant... Read more
You must log in to submit a review.