
0 ITEMS

Fish Farm Financial Model Excel Template
The Fish Farming Financial Model template helps entrepreneurs, aquaculture founders, business owners, consultants, and analysts build a structured forecast for a commercial fish farming operation without starting from a blank spreadsheet. It is designed to translate operational assumptions such as production capacity, harvest volume, pricing, product mix, mortality rates, feed costs, labor, and capital investment into a clear financial planning framework. Instead of relying on rough estimates, users can organize the financial logic behind the business and understand how revenue, costs, cash flow, and profitability may develop over time. This template is useful for people preparing a fish farming business plan, investor presentation, bank loan application, internal budget, or expansion analysis. It supports planning for key financial areas such as revenue assumptions, startup costs, operating expenses, payroll, cost of goods sold, and cash flow requirements. Users can test how changes in pricing, production yield, staffing levels, energy costs, or product strategy affect the overall financial outlook. This makes it easier to compare decisions before committing capital to ponds, tanks, recirculating aquaculture systems, processing equipment, land, or working capital. The model is built to support practical decision-making as well as professional reporting. It connects inputs with forecast outputs such as profit and loss, cash flow, balance sheet, scenario results, charts, KPIs, break-even analysis, and funding requirements. For fish farming businesses, this is especially important because upfront investment can be high, production cycles can be long, and cash needs may peak before the operation becomes self-sustaining. The template helps users identify when profitability may be reached, how much funding may be required, and which drivers have the strongest impact on returns. Fully editable and ready to use, the Fish Farming Financial Model template can be customized for different aquaculture concepts, including hatchery operations, grow-out farms, integrated production facilities, and value-added fish processing models. It works as a time-saving planning tool for early-stage founders, established operators exploring expansion, advisors creating client forecasts, and stakeholders who need a clear view of financial feasibility. By bringing revenue, expenses, payroll, investment planning, cash flow, profitability, and break-even analysis into one organized model, it helps users make better decisions and present their fish farming opportunity with greater confidence.
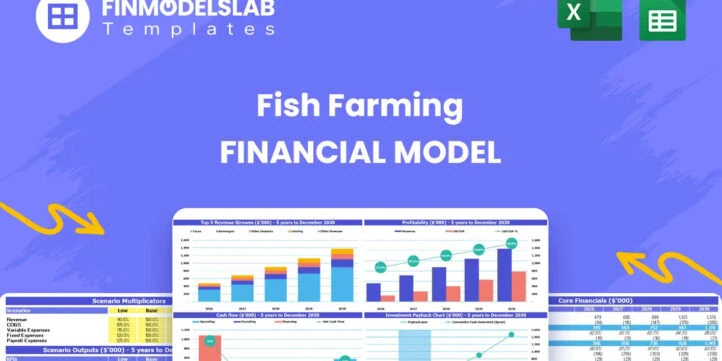


Financial Model Overview
The Fish Farming Financial Model template gives entrepreneurs, aquaculture operators, consultants, analysts, and business planners a structured way to evaluate the financial feasibility of a fish farming business. Commercial aquaculture requires careful planning because revenue depends on biological production cycles, stocking density, harvest yield, product mix, pricing, mortality assumptions, and market demand, while costs can include feed, energy, labor, land, construction, tanks, recirculating aquaculture systems, processing equipment, and working capital. This template brings those assumptions together in one editable financial model so users can forecast revenue, operating expenses, cash flow, profitability, and funding needs with greater clarity. It is designed for business planning, investor presentations, bank discussions, startup budgeting, and expansion analysis, helping users move from a concept or operating plan to an organized financial forecast that can be reviewed, adjusted, and presented professionally.
All-in-One Dashboard
The all-in-one dashboard component gives users a central view of the most important inputs and outputs in the Fish Farming Financial Model. Instead of moving through multiple disconnected calculations, the dashboard helps summarize key assumptions and results in one place, including revenue trends, cost behavior, cash flow position, profitability indicators, and high-level performance metrics. For a fish farming operation, this is useful because the business model can involve many connected drivers, such as breeding cycles, juvenile retention, grow-out capacity, survival rates, harvest weight, pricing by product type, and variable operating costs. The dashboard allows users to quickly review whether the forecast is moving in the right direction and identify areas that need more attention. It can support meetings with partners, investors, lenders, and internal teams by turning detailed spreadsheet outputs into a more accessible financial summary. Users can customize assumptions in the model and then use the dashboard to see how those changes affect revenue, profit, cash flow, and overall financial performance. This makes the dashboard a practical decision-making tool as well as a presentation-ready summary for stakeholders who need to understand the business without reviewing every calculation line by line.
Low, Base, and High Scenario Analysis
The low, base, and high scenario analysis component helps users test how the fish farming business may perform under different operating and market conditions. A fish farm forecast is rarely certain because results can be affected by survival rates, feed conversion, energy prices, harvest volumes, product pricing, processing yields, labor costs, capital expenditure timing, and sales mix. This scenario structure allows users to compare a conservative case, a realistic planning case, and an upside case within the same model. For example, the low case may reflect weaker pricing, higher mortality, slower production ramp-up, or increased operating expenses, while the high case may reflect improved yields, stronger market prices, better product mix, and more efficient cost control. The base case can serve as the core business plan used for budgeting, investor review, or lender discussions. This component is valuable because it helps users understand risk and opportunity before committing capital. It also makes the financial model more credible, since investors and lenders often want to know not only what the founder expects to happen, but also how the business performs if conditions change. By comparing scenarios, users can evaluate funding needs, cash flow resilience, profit potential, and the operational assumptions that matter most.
Professional Charts and Visual Reports
The professional charts and visual reports component converts the model’s financial projections into clear visual outputs that are easier to understand and present. Fish farming forecasts can include a wide range of numerical details, from hatchery production and grow-out yield to revenue streams, cost of goods sold, payroll, capital expenditure, debt service, EBITDA, net profit, and cash flow. Charts help users communicate these results more effectively by showing trends, comparisons, and relationships over time. This may include visual summaries of revenue growth, gross margin, operating expenses, cash balance, profitability, payback progress, and production-related financial outcomes. For entrepreneurs preparing business plans or funding documents, these visuals can make the financial story more compelling and easier for stakeholders to review. A bank officer, investor, partner, or board member may not want to inspect every calculation, but a well-structured chart can quickly show whether the business is scaling, when cash flow improves, how costs behave, and where the strongest value drivers are located. This component is especially useful for presentations because it translates complex aquaculture economics into charts that support explanation, discussion, and decision-making. Users can update assumptions in the model and use the linked visuals to reflect the revised forecast automatically.
ROE Components and DuPont Analysis
The ROE components and DuPont analysis component helps users evaluate return on equity by breaking it into the drivers that influence shareholder returns. In a capital-intensive fish farming business, return on equity is important because founders, investors, and lenders want to understand whether the capital invested in land, systems, construction, equipment, broodstock, processing capability, and working capital can generate an attractive financial return. DuPont analysis provides a more detailed view of ROE by connecting profitability, asset efficiency, and leverage. Instead of viewing return on equity as a single number, users can understand whether performance is being driven by net profit margin, asset turnover, or capital structure. This is useful when comparing strategic choices, such as investing in higher-value processing, increasing production capacity, improving survival rates, or using debt financing to support expansion. For a fish farm, a strong return profile may depend not only on selling more fish, but also on managing feed costs, energy use, staffing, capital utilization, and product mix. This component helps users analyze the financial quality of the business and communicate return potential in a more professional way. It is particularly valuable for investor discussions because it explains how the model creates returns rather than simply showing projected profit.
Revenue Inputs and Operating Assumptions
The revenue inputs and operating assumptions component is where users define the commercial and production drivers that shape the fish farming forecast. Revenue in aquaculture is not based only on a single sales price; it is influenced by hatchery output, juvenile production, retained stock, purchased juveniles, grow-out cycles, mortality rates, harvest weights, processing yields, product categories, and sales prices. This section allows users to document and adjust assumptions such as the number of breeding females, offspring per cycle, production cycles per year, juvenile loss rates, grow-out survival rates, average harvest weight, market pricing, and the proportion of harvest sold as whole fish, fillets, juveniles, or other revenue streams. By entering researched or business-specific assumptions, users can create a forecast that reflects the actual operating plan rather than a generic sales estimate. This component is useful because it connects operational reality with financial results. If survival rates improve, if the farm shifts to more value-added fillets, or if pricing changes, the model can show how revenue and margins respond. For business planning and funding preparation, well-documented revenue inputs also help reviewers understand the logic behind the forecast and assess whether the assumptions are realistic for the proposed fish farming operation.
Bank-Ready Financial Reports
The bank-ready financial reports component provides structured financial outputs that are designed to support lender, investor, and stakeholder review. A fish farming business may require substantial upfront capital for land, facility construction, tanks, recirculating aquaculture system equipment, processing equipment, water systems, permits, staffing, and early operating losses before the first full revenue cycle matures. Because of this, banks and investors typically need more than a simple revenue estimate. They want to review financial statements, cash flow projections, profitability, repayment capacity, funding requirements, and the assumptions behind the plan. This component helps generate professional reports such as projected profit and loss, cash flow statement, balance sheet, and summary financial schedules. These outputs help users present the business in a format that lenders can evaluate more easily. The reports can support loan applications by showing expected revenue, operating costs, EBITDA, net income, cash availability, capital needs, and payback potential. They are also useful for internal planning because they help the management team see whether the business can meet obligations, fund growth, and maintain liquidity during the ramp-up period. By using linked assumptions and automated calculations, the model reduces manual reporting work and helps create a more consistent financial package.
Revenue Breakdown by Stream
The revenue breakdown by stream component helps users see how different sources of income contribute to total fish farming revenue. Aquaculture businesses often generate revenue from multiple categories, such as juvenile sales, whole fresh fish, fresh fillets, processed fish products, live fish, or other value-added outputs depending on the business model. This section allows users to analyze each stream separately instead of treating revenue as one broad total. Inputs may include sales volume, price per kilogram, production allocation, processing conversion, product mix, and annual pricing changes. The outputs show how each stream contributes to revenue over time and how strategic changes can affect overall performance. For example, shifting more harvest volume from whole fish to fillets may increase revenue per kilogram but may also require processing labor, equipment, packaging, and quality control. Selling juveniles may create early cash flow while retained juveniles support future grow-out production. This component is useful for evaluating pricing strategy, production allocation, and margin improvement opportunities. It also helps users communicate the business model more clearly to investors and lenders by showing where revenue comes from and how the farm plans to increase value over time. A detailed revenue breakdown supports better decision-making because it reveals which products carry the greatest financial impact.
KPI Dashboard and Benchmark Metrics
The KPI dashboard and benchmark metrics component helps users track the financial and operating indicators that matter most for a fish farming business. Key performance indicators may include revenue growth, gross margin, EBITDA margin, net profit margin, cash balance, payback period, return on equity, internal rate of return, cost of goods sold as a percentage of revenue, payroll ratio, production yield, mortality assumptions, harvestable biomass, and revenue per unit of output. Benchmark-style metrics can help users compare the forecast against expected performance standards or internal targets. This is especially important in aquaculture because small changes in survival rates, feed efficiency, energy costs, and product mix can create a meaningful difference in profitability. The KPI dashboard gives users a quick way to evaluate whether the business is financially healthy, whether margins are improving, whether costs are controlled, and whether growth is being achieved efficiently. It can also help managers monitor performance after launch by comparing actual results against the forecast. For investors and lenders, KPIs provide a concise view of business quality and financial discipline. This component turns the Fish Farming Financial Model into more than a static forecast; it becomes a performance management tool that supports planning, tracking, and accountability.
Startup Costs and CAPEX Planning
The startup costs and CAPEX planning component helps users estimate the initial investment required to launch or expand a fish farming operation. Aquaculture can be capital intensive, especially when the plan includes land acquisition, site preparation, facility construction, ponds or tanks, water treatment systems, recirculating aquaculture system equipment, pumps, filtration, oxygenation, backup power, monitoring technology, processing equipment, cold storage, vehicles, licenses, permits, professional fees, and initial working capital. This section allows users to organize these expenditures into a clear startup budget and separate one-time capital needs from recurring operating expenses. The model can help show when the cash is required, how much total funding is needed before operations generate sufficient revenue, and how capital investment affects depreciation, asset base, and long-term financial statements. For founders and business owners, this component is useful because it reduces the risk of underestimating launch costs. For lenders and investors, it provides transparency around the use of funds and helps assess whether the requested financing is aligned with the operating plan. A detailed CAPEX plan also supports decision-making when comparing build-out options, equipment choices, facility sizes, or phased expansion strategies. By clearly estimating startup costs, users can approach funding conversations with a more credible financial plan.
Break-Even and Funding Requirements
The break-even and funding requirements component helps users understand when the fish farming business may become profitable and how much capital may be needed before that point. Fish farming businesses often experience a gap between upfront spending and revenue generation because construction, stocking, grow-out cycles, staffing, feed, energy, and overhead costs may occur before harvest and sales reach full capacity. This section connects revenue forecasts, gross margin, fixed operating expenses, payroll, capital spending, and cash flow to estimate the break-even timeline and peak funding need. The break-even analysis helps users see the sales volume or revenue level required to cover costs, while the funding requirement analysis highlights the maximum cash shortfall that must be financed through equity, debt, grants, or owner contributions.
File types:
Excel – Single-User: .xlsx
Excel – Multi-User: .xlsx
Similar ProductsOther customers were also interested in...


 Andreas
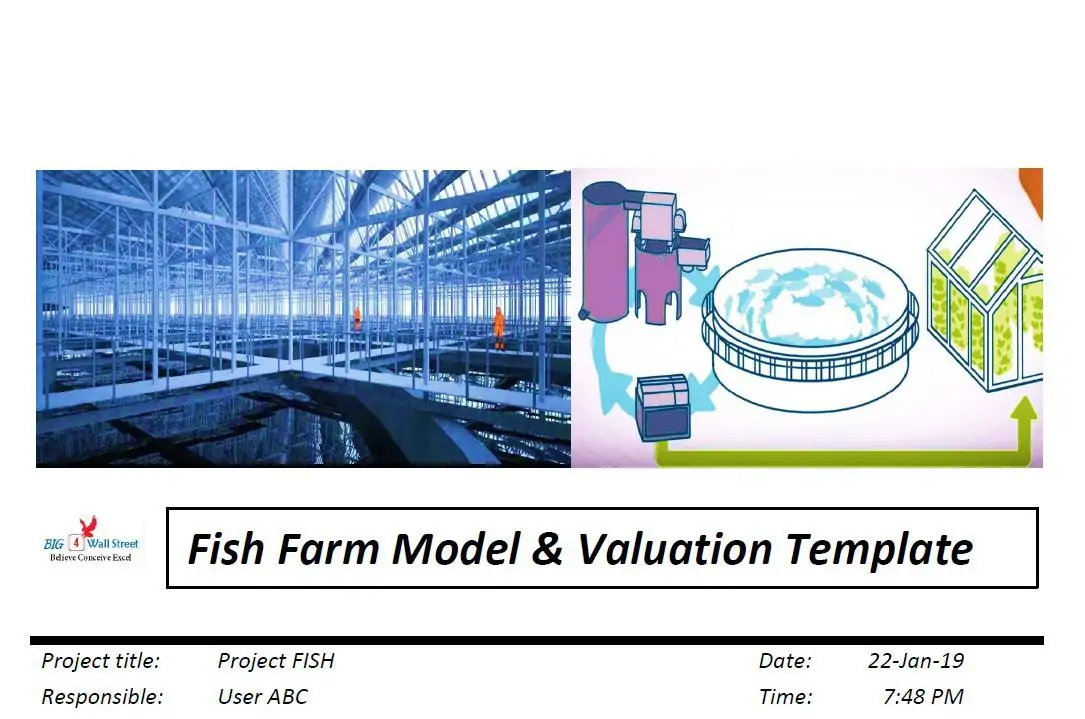
Fish Farm Financial and Valuation Model
Financial Model Templates that generates a three statement financial model and a valuation for a fis... Read more
 eFinancialModels
Agriculture Financial Model Templates Bundle
This is a collection of financial model templates for businesses in the Agriculture Industry and its... Read more
Agricultural Financial Model Bundle
Are you interested in starting a business in the Agriculture Industry? Or are you looking for financ... Read more
 HenrySheykin
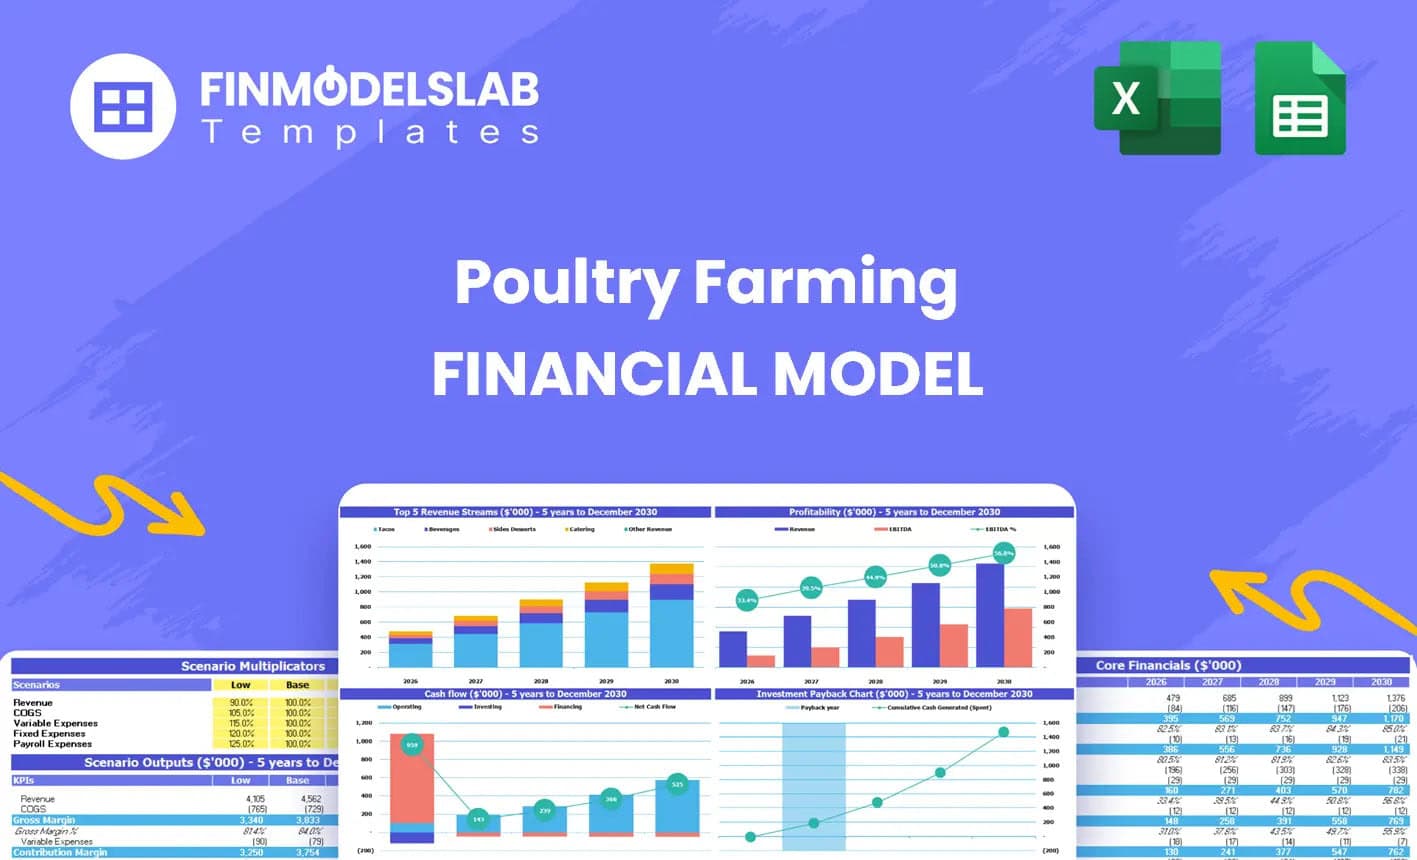
Poultry Farm Financial Model Excel Template
The Poultry Farming Financial Model helps users turn a poultry farm concept into a structured, lende... Read more
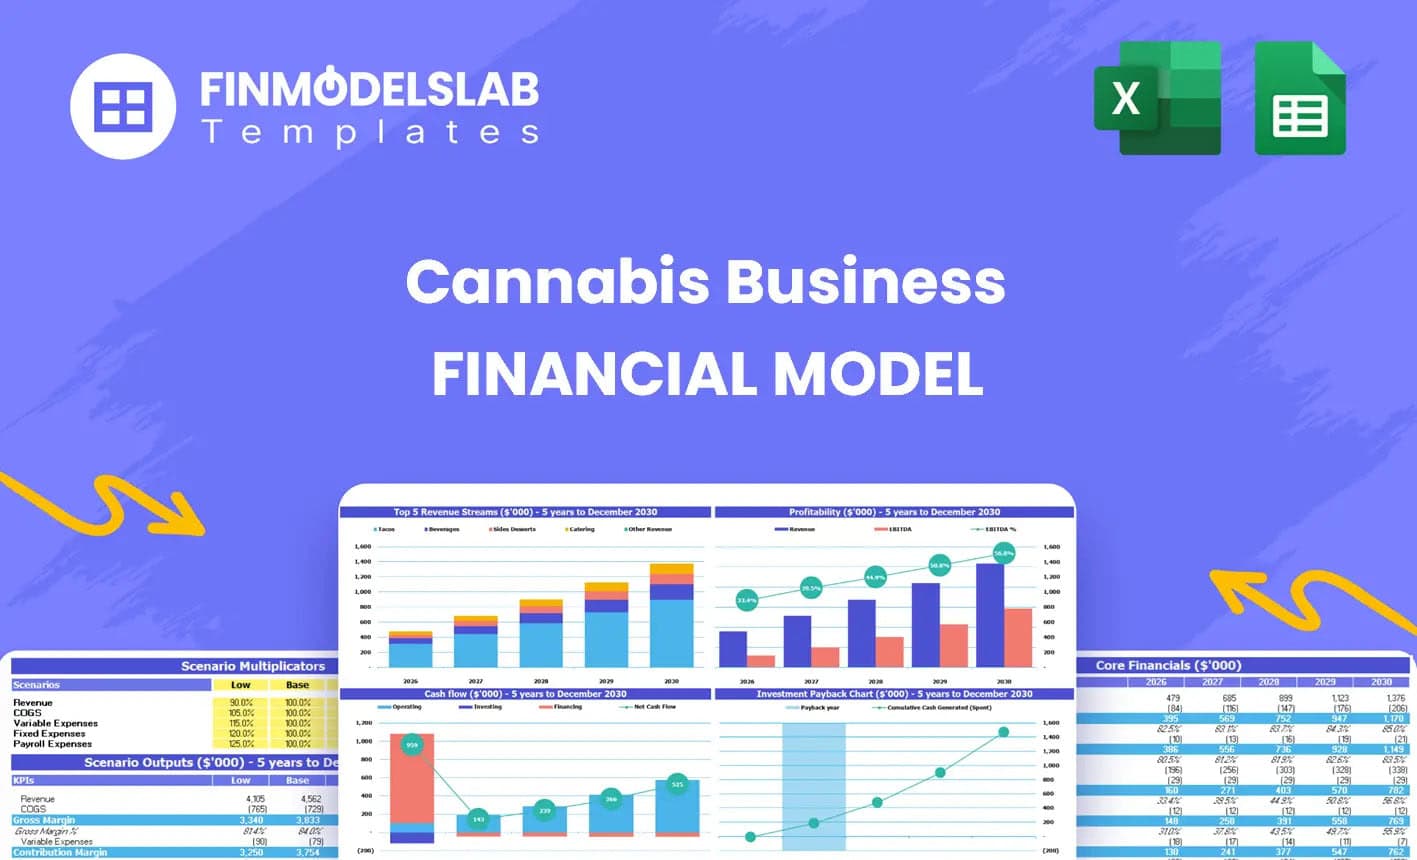
Cannabis Financial Model Excel Template
The Cannabis Business Financial Model is a ready-to-use financial model template designed to help en... Read more
Shrimp Farm Financial Model Excel Template
The Shrimp Farming Financial Model helps entrepreneurs, aquaculture operators, consultants, analysts... Read more
Fruits Farming Financial Model Excel Template
The Fruit Farming Financial Model helps users turn a fruit farm concept, orchard expansion, or agric... Read more
Marijuana Financial Model Excel Template
The Cannabis Business Financial Model is a ready-to-use financial model template designed to help en... Read more
Soy Production Financial Model Excel Template
The Soy Production Financial Model helps users turn a soybean farming and processing plan into a str... Read more
Vegetable Farming Financial Model Excel Template
The Vegetable Farming Financial Model helps users turn a farming concept, expansion plan, or funding... Read more
Reviews
 a bundle financial model of fish farm
 fish farming
please send me detailed financial analysis of fish farming .It is so important for me
1699 of 3358 people found this review helpful.
Help other customers find the most helpful reviews
Did you find this review helpful?
You must log in to submit a review.