
0 ITEMS

Marijuana Financial Model Excel Template
The Cannabis Business Financial Model is a ready-to-use financial model template designed to help entrepreneurs, founders, consultants, analysts, and business owners plan a cannabis cultivation or related cannabis operation with greater structure and confidence. Instead of building a spreadsheet from scratch, users can work from a professionally organized model that connects financial planning assumptions with projected results. It helps estimate revenue potential, startup costs, operating expenses, payroll requirements, cash flow needs, profitability, and funding requirements in one editable planning file. This template is especially useful for people preparing business plans, loan applications, investor presentations, internal budgets, or expansion strategies. Cannabis businesses often involve high upfront capital expenditure, regulated operating costs, staffing complexity, crop yield assumptions, harvest timing, pricing variation, and ongoing cash flow pressure. The model helps organize these moving parts so users can test assumptions, compare outcomes, and understand what must happen for the business to become financially sustainable. It supports planning around cultivated area, product mix, yield, pricing, cost of goods sold, overhead, payroll, and long-term growth. The Cannabis Business Financial Model also helps users review profitability from multiple angles, including gross margin, EBITDA, net income, cash flow, return on equity, break-even timing, and key performance indicators. Built-in outputs can support lender and investor discussions by presenting financial statements, charts, dashboards, and decision-ready reports in a format that is easier to interpret. Users can adjust core assumptions to reflect their own market, facility size, crop strategy, labor plan, lease or land ownership approach, and financing structure. Whether you are launching a new cannabis business, evaluating a cultivation project, expanding an existing operation, or advising a client, this financial model template gives you a practical framework for decision-making. It can help identify the cash needed before launch, estimate how fast revenue must ramp up, evaluate whether fixed overhead is realistic, and determine how changes in pricing, yield loss, staffing, or expansion timing may affect the bottom line. The template is editable, reusable, and structured to save time while supporting clearer financial planning.
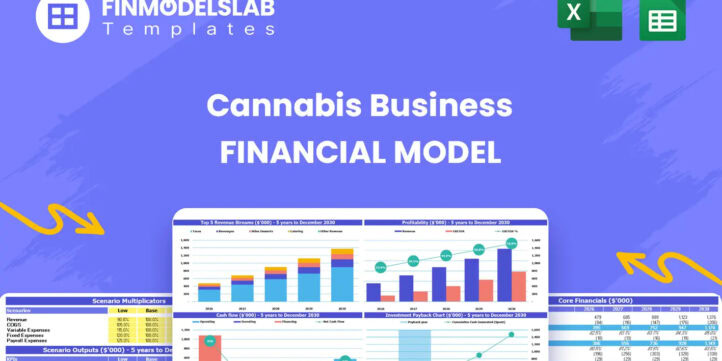


Financial Model Overview
The Cannabis Business Financial Model is a structured financial model template created for entrepreneurs, founders, cannabis operators, consultants, analysts, and business planning professionals who need to evaluate the financial performance of a cannabis business before launch, funding, or expansion. Cannabis operations can be capital intensive, highly regulated, and operationally complex, with major assumptions tied to cultivated area, crop allocation, yield per hectare, harvest frequency, product pricing, labor requirements, fixed overhead, direct production costs, and long-term land or facility strategy. This template brings those assumptions together in one organized planning file so users can forecast revenue, startup investment, expenses, cash flow, profitability, and investor-ready outputs without starting from a blank spreadsheet. It is built to support practical decision-making, helping users understand what the business may require, how it may perform, and which assumptions have the greatest impact on financial results.
All-in-One Dashboard
The all-in-one dashboard gives users a central place to review the core inputs and core outputs of the Cannabis Business Financial Model. This section is designed to simplify financial planning by bringing the most important assumptions and results into one easy-to-read view, allowing users to see how the business is expected to perform without navigating through every calculation tab. Inputs may include cultivated area, revenue assumptions, crop mix, pricing, yield expectations, startup investment, payroll, operating expenses, financing assumptions, and growth timing. Outputs may include total revenue, gross profit, EBITDA, net income, cash flow, cash balance, capital requirements, and selected financial ratios. For a cannabis business, this consolidated view is especially valuable because lenders, partners, and internal decision-makers often want quick answers about startup costs, profit forecasts, cash runway, and break-even timing. The dashboard helps users move from detailed spreadsheet logic to a clear management-level summary, making it easier to review business feasibility, compare forecast results, and prepare for stakeholder conversations.
Low, Base, and High Scenario Analysis
The low, base, and high scenario analysis section helps users evaluate how the cannabis business may perform under different operating and market conditions. Rather than relying on one fixed forecast, this component allows users to compare conservative, expected, and optimistic cases using different assumptions for pricing, yield, cultivated area, harvest frequency, yield loss, cost efficiency, payroll growth, overhead levels, or expansion timing. In a cannabis business, small changes in yield per harvest, product selling price, or production loss can have a large effect on revenue and profitability, so scenario analysis is essential for understanding risk. The low case may reflect slower sales ramp-up, higher crop loss, delayed harvests, or pricing pressure, while the base case can represent the planned operating strategy and the high case can show the upside potential if yields improve, costs decline, or product mix shifts toward higher-margin categories. This section is useful for funding presentations and internal planning because it helps users explain not only what they expect to happen, but also how resilient the business may be if conditions change. It supports better decision-making by showing the financial impact of uncertainty before major capital is committed.
Professional Charts
The professional charts section turns financial forecast data into visual reports that are easier to interpret and present. Cannabis business plans often include detailed assumptions across revenue streams, costs, margins, payroll, capital expenditures, cash flow, and profitability, but raw spreadsheet data can be difficult for investors or lenders to digest quickly. This component uses charts and graphs to display important trends such as revenue growth, EBITDA progression, cash balance movement, expense composition, gross margin improvement, or year-over-year performance. Inputs are pulled from the connected forecast sections, while outputs are visual summaries that can support investor presentations, management meetings, loan discussions, and strategic reviews. Professional charts are particularly useful when explaining a cannabis operation’s growth story, such as expansion from a smaller cultivated area to a larger production footprint, a shift from leased land to owned assets, or an improvement in margins as production efficiencies increase. By converting forecast results into presentation-ready visuals, this section helps users communicate financial expectations clearly and make complex projections more understandable for stakeholders.
ROE Components and DuPont Analysis
The ROE components and DuPont analysis section helps users evaluate return on equity by breaking it into the underlying drivers of profitability, asset efficiency, and financial leverage. For cannabis operators seeking funding or evaluating long-term value creation, return on equity can be an important measure because it shows how effectively owner or investor capital may be converted into profit. This component may use inputs and outputs from the income statement, balance sheet, and financing structure, including net income, revenue, assets, equity, margins, asset turnover, and leverage assumptions. Instead of viewing return on equity as one final number, the DuPont framework helps users understand whether ROE is being driven by strong profit margins, efficient use of assets, or the level of debt and equity financing in the capital structure. This is useful for cannabis businesses because heavy startup investment in facilities, cultivation equipment, land, licenses, and working capital can influence returns for many years. By showing the components behind ROE, the model helps users assess whether the business is building value through operating performance or relying too heavily on leverage, supporting more informed decisions around growth, funding, and asset investment.
Revenue Inputs
The revenue inputs section is where users define the assumptions that drive the cannabis business sales forecast. This component may include cultivated area, crop categories, allocation percentages, yield per hectare or production unit, number of harvests per year, expected yield loss, selling price per kilogram or unit, and timing of production. For a cultivation-focused cannabis business, revenue is highly dependent on operational productivity, harvest frequency, crop quality, and market pricing, so the model allows users to adjust these assumptions to match their own strategy. A user can model different product categories, such as premium flower, standard flower, trim, biomass for extraction, or other saleable outputs, then assign unique yields and prices to each category. The section calculates gross yield, adjusts for production loss, and converts net saleable yield into projected revenue. This is valuable because it connects operational planning directly to financial outcomes. If yield loss increases, pricing drops, or harvest timing changes, users can immediately see the impact on revenue and profitability. The revenue inputs section helps create a more realistic forecast and supports decision-making around crop mix, cultivation efficiency, pricing strategy, and expansion planning.
Bank-Ready Reports
The bank-ready reports section organizes financial outputs into a lender-friendly and stakeholder-ready format. Cannabis businesses often need to demonstrate financial viability to banks, private lenders, investors, partners, landlords, and board members, and these stakeholders typically look for structured financial statements and clear supporting metrics. This component may include forecasted profit and loss statements, cash flow statements, balance sheets, debt service assumptions, cash balance summaries, and key profitability measures over the forecast period. Inputs are drawn from the full model, including revenue, COGS, payroll, overhead, capital expenditures, financing, taxes, depreciation, and working capital assumptions. The outputs help users present a coherent financial story that shows how revenue is generated, what costs are required to operate, when the business becomes profitable, and whether cash flow can support the plan. For a cannabis business with large upfront investment and ongoing regulatory expenses, these reports can make the difference between a rough estimate and a credible financial package. This section is useful for loan preparation, investor due diligence, business plan appendices, and internal budget approvals.
Revenue Breakdown
The revenue breakdown section provides a detailed view of revenue streams so users can understand where sales are coming from and how each product category contributes to total performance. Cannabis businesses rarely depend on a single financial driver, even when cultivation is the core operation. Product mix, crop allocation, quality grade, yield efficiency, and market pricing can all influence the revenue profile. This component may separate revenue by crop category, product line, production area, harvest cycle, or sales channel, depending on how the user customizes the model. Inputs can include product-specific pricing, harvested quantities, yield loss percentages, cultivated area allocation, and sales timing. Outputs may show annual revenue by stream, percentage contribution to total sales, growth by category, and the effect of product mix on overall revenue. This is useful because a cannabis business may appear profitable in aggregate while relying heavily on one high-margin product or one pricing assumption. By reviewing the revenue breakdown, users can identify concentration risk, compare the value of premium versus lower-margin outputs, and make better decisions about production planning, sales strategy, and market positioning.
KPI Dashboard
The KPI dashboard section tracks key performance indicators that help users monitor the financial and operational health of the cannabis business. While financial statements provide detailed accounting-style outputs, KPIs give users a faster way to evaluate whether the business is meeting important targets. This component may include metrics such as revenue growth, gross margin, EBITDA margin, net profit margin, cash balance, cash runway, yield efficiency, COGS as a percentage of revenue, payroll as a percentage of revenue, overhead coverage, return on equity, and other performance benchmarks. Inputs are connected to the model’s revenue, cost, payroll, overhead, balance sheet, and cash flow calculations, while outputs are summarized into clear indicators for management review. For cannabis businesses, a KPI dashboard is especially helpful because performance depends on both operational execution and financial discipline. A strong sales forecast can be undermined by high production loss, rising labor costs, excess overhead, or delayed cash collections. The KPI dashboard helps users spot trends early, compare actual or forecasted performance against targets, and communicate progress to partners, lenders, or investors in a concise format.
Startup Costs and Capital Expenditures
The startup costs and capital expenditures section helps users estimate the initial investment required to launch or expand the cannabis business. Cannabis operations often require significant upfront spending before revenue begins, including facility construction, leasehold improvements, cultivation equipment, irrigation systems, lighting or greenhouse infrastructure, security systems, licensing and permitting, legal and professional fees, initial inventory, technology, deposits, and pre-opening working capital. This component allows users to itemize these costs and understand how much funding may be needed before operations can stabilize. Inputs may include one-time setup expenses, timing of capital expenditures, equipment purchases, land or facility investments, opening cash reserve targets, and financing sources. Outputs may include total startup funding required, monthly cash impact, capital expenditure schedules, and the relationship between launch costs and available cash. This section is useful for cannabis entrepreneurs because underestimating startup capital can create cash shortages before the first harvest or sales cycle is complete. It also supports investor and lender conversations by showing exactly where funds are expected to be used and whether the business has enough capital to cover buildout, staffing, overhead, and early operating needs.
Break-Even and Cash Flow Planning
The break-even and cash flow planning section helps users determine when the cannabis business may become profitable and whether it can maintain enough liquidity along the way. Break-even analysis may use fixed costs, variable costs, contribution margin, revenue assumptions, and product mix to estimate the sales level or time period required to cover operating expenses. Cash flow planning then goes further by tracking the timing of inflows and outflows, including revenue collections, payroll, COGS, overhead, capital expenditures, financing proceeds, debt service, taxes, and working capital needs. This is especially important for cannabis businesses because a forecast may show strong annual profit while still facing cash pressure during months with heavy buildout spending, delayed sales, seasonal harvest timing, or high fixed overhead. Outputs may include monthly cash balance, cash runway, break-even month, funding gap, operating cash flow, and investment payback timing. This component helps users test whether the business can survive slower sales ramp-up, higher costs, delayed harvests, or expansion spending. It is useful for budgeting, funding preparation, and operational decision-making because it shows not only whether the business can be profitable, but also whether it has enough cash to reach that point.
File types:
Excel – Single-User: .xlsx
Excel – Multi-User: .xlsx
Similar ProductsOther customers were also interested in...

 HenrySheykin
Cannabis Financial Model Excel Template
The Cannabis Business Financial Model is a ready-to-use financial model template designed to help en... Read more
Poultry Farm Financial Model Excel Template
The Poultry Farming Financial Model helps users turn a poultry farm concept into a structured, lende... Read more
Fish Farm Financial Model Excel Template
The Fish Farming Financial Model template helps entrepreneurs, aquaculture founders, business owners... Read more
Shrimp Farm Financial Model Excel Template
The Shrimp Farming Financial Model helps entrepreneurs, aquaculture operators, consultants, analysts... Read more
Fruits Farming Financial Model Excel Template
The Fruit Farming Financial Model helps users turn a fruit farm concept, orchard expansion, or agric... Read more
Soy Production Financial Model Excel Template
The Soy Production Financial Model helps users turn a soybean farming and processing plan into a str... Read more
Greenhouse Farming Financial Model Excel Template
The Greenhouse Farming Financial Model helps users evaluate the economics of a controlled environmen... Read more
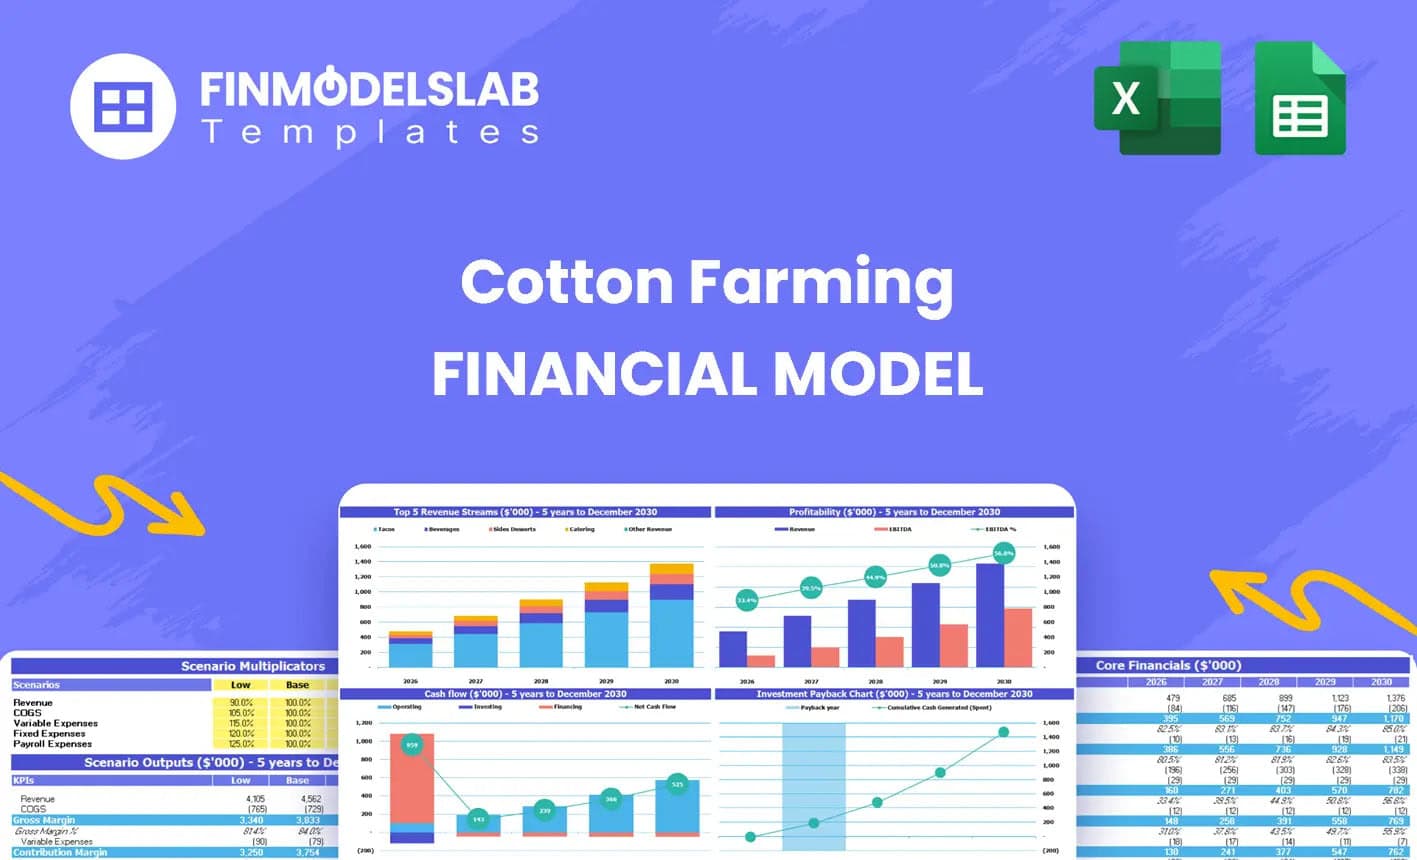
Cotton Growing Financial Model Excel Template
The Cotton Farming Financial Model Financial Model Template helps entrepreneurs, farm owners, consul... Read more
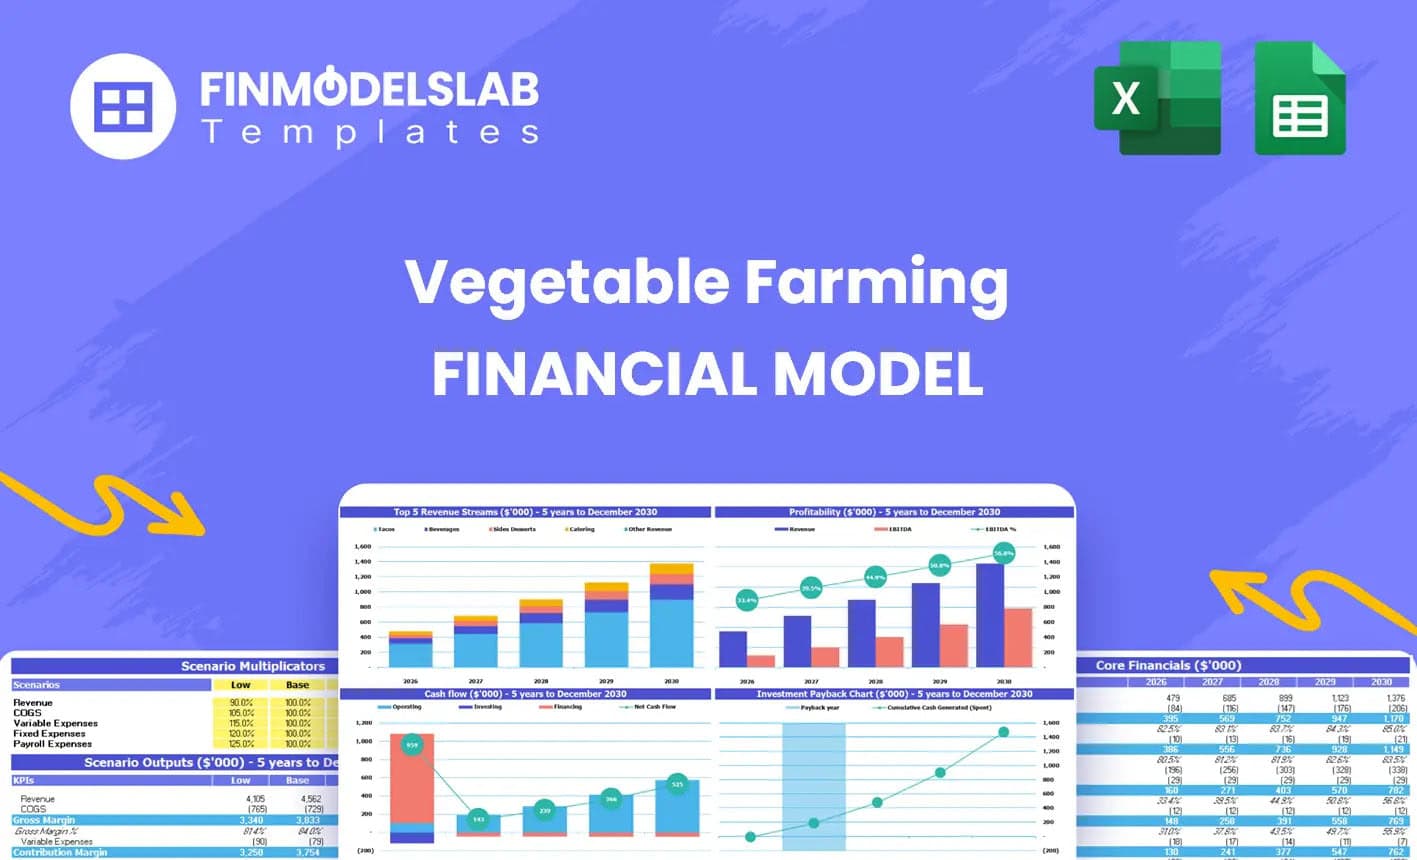
Vegetable Farming Financial Model Excel Template
The Vegetable Farming Financial Model helps users turn a farming concept, expansion plan, or funding... Read more

Rice Growing Financial Model Excel Template
The Rice Farming Financial Model helps turn a rice cultivation plan into a structured, investor-read... Read more
You must log in to submit a review.