
0 ITEMS

Fast Food Financial Model Excel Template
The Fast Food Restaurant Financial Model helps entrepreneurs, founders, restaurant owners, consultants, and analysts build a structured financial forecast without starting from a blank spreadsheet. It is designed for planning a quick service restaurant, fast casual concept, drive-thru location, franchise-style operation, or local food service business where revenue, traffic, menu mix, labor, ingredients, rent, and startup investment all need to be connected in one clear model. Instead of relying on rough estimates, users can organize financial planning around editable assumptions and see how those assumptions flow into revenue forecasts, operating expenses, cash flow, profitability, and funding needs. This financial model template is especially useful for people preparing business plans, investor materials, loan applications, internal budgets, or expansion plans. It allows users to estimate daily customer volume, average order value, revenue streams, cost of goods sold, payroll, overhead, startup costs, and capital expenditures in a professional forecasting structure. The model supports up to five years of projections and helps users understand how the restaurant may perform under realistic assumptions, including low, base, and high scenarios. This makes it easier to evaluate risk, compare outcomes, and make better decisions before committing capital. For a fast food restaurant, small changes in customer traffic, food costs, staffing levels, and average check size can have a major impact on margins and cash flow. This template helps users test those drivers in an organized way, review automated financial statements, and understand the relationship between sales growth and cost control. It also supports profitability analysis, break-even analysis, return metrics, and cash flow forecasting, helping users identify when the business may become profitable and how much working capital may be needed during launch and early operations. Built to be editable and presentation-ready, the Fast Food Restaurant Financial Model can be customized for a specific menu, location, service format, pricing strategy, and staffing plan. It is suitable for non-financial users who need a practical planning tool as well as experienced analysts who want a ready-made framework they can adapt quickly. By bringing key assumptions, dashboards, charts, bank-ready reports, revenue analysis, KPIs, and decision-making metrics together, the template helps turn a restaurant concept into a more credible, data-driven financial plan.
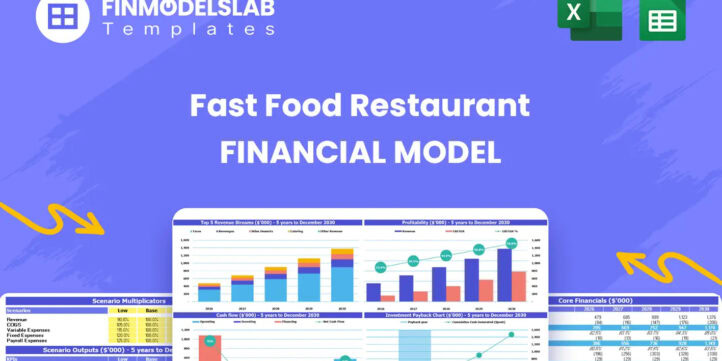


Fast Food Restaurant Financial Model Overview
The Fast Food Restaurant Financial Model is a ready-to-use financial model template built to help entrepreneurs, business owners, consultants, analysts, and funding applicants evaluate the financial potential of a fast food or quick service restaurant. It brings together the key planning areas required to understand how the business may perform, including sales assumptions, menu-driven revenue, cost of goods sold, payroll, operating expenses, startup investment, cash flow, profitability, and investor return metrics. For a fast food restaurant, financial performance depends on practical drivers such as daily customer traffic, average order value, weekday and weekend demand patterns, ingredient costs, packaging costs, labor scheduling, rent, utilities, and marketing. This template gives users a structured way to connect those assumptions to a five-year forecast, helping replace guesswork with an organized planning process that can support business plans, investor presentations, bank loan applications, internal budgets, and strategic decision-making.
All-in-One Dashboard
The all-in-one dashboard gives users a central view of the most important inputs and outputs in the Fast Food Restaurant Financial Model. Instead of searching across multiple worksheets to understand the forecast, users can review core assumptions and financial results in one practical summary area. This dashboard may include key inputs such as customer traffic, average order value, revenue growth, food and beverage cost assumptions, payroll levels, fixed overhead, capital expenditure, and financing assumptions. It then translates those inputs into high-level outputs such as total revenue, gross profit, EBITDA, net income, cash balance, margin performance, and investment return indicators. For entrepreneurs and business owners, this component is useful because it makes the model easier to manage and interpret, especially when testing different strategies or updating assumptions before a meeting. For consultants and analysts, it provides a clear control center for reviewing whether the forecast is internally consistent and whether the restaurant has the potential to generate enough sales and profit to support its cost structure. The dashboard also helps non-financial users focus on the business drivers that matter most, making the model more accessible for planning, budgeting, and decision-making.
Low, Base, and High Scenario Analysis
The low, base, and high scenario analysis section helps users evaluate how the fast food restaurant may perform under different operating conditions. A single forecast can be useful, but restaurant planning often requires a broader view because customer traffic, average check size, labor efficiency, supplier costs, and ramp-up speed can all vary significantly after launch. This component allows users to compare conservative, expected, and optimistic outcomes by adjusting key assumptions and seeing how each case affects revenue, profitability, cash flow, and funding requirements. A low scenario may help identify the minimum cash reserve needed if sales take longer to build or ingredient costs rise. A base scenario can be used as the main planning case for business plans and investor discussions. A high scenario can show the upside if the restaurant achieves stronger customer volume, better menu mix, or faster brand awareness. This type of scenario planning is valuable for founders, lenders, and investors because it shows that the financial plan has been stress-tested rather than built around one fixed outcome. It also supports better operational decisions, such as determining whether to delay hiring, adjust marketing spend, renegotiate supplier terms, or secure additional working capital before opening.
Professional Charts
The professional charts component turns detailed financial projections into clear visual reports that are easier to understand and present. Fast food restaurant forecasts can contain many moving parts, including daily sales assumptions, revenue by category, cost of goods sold, payroll, operating expenses, EBITDA, net income, cash flow, and investment return metrics. Charts help simplify that information by showing trends, relationships, and changes over time in a format that stakeholders can review quickly. This section may visualize revenue growth, expense structure, profit margins, cash balance, break-even progress, and scenario comparisons. For entrepreneurs preparing a pitch deck or business plan, presentation-ready charts help communicate the financial story behind the restaurant concept without overwhelming the audience with spreadsheet detail. For lenders, advisors, and internal teams, charts make it easier to spot potential issues such as rising costs, seasonal cash pressure, or unrealistic sales growth assumptions. The professional formatting also improves the credibility of the model by making outputs look organized, polished, and stakeholder-ready. This component is useful because it bridges the gap between financial analysis and communication, helping users explain the forecast clearly in meetings, funding discussions, and strategic planning sessions.
ROE Components and DuPont Analysis
The ROE components and DuPont analysis section helps users evaluate the drivers behind return on equity rather than looking only at the final return figure. In a fast food restaurant financial model, return on equity can be influenced by profitability, asset efficiency, and financial leverage. DuPont analysis breaks this relationship into more understandable components, allowing users to see whether returns are being driven by strong margins, efficient use of assets, or the financing structure of the business. Inputs may include net income, revenue, total assets, equity investment, debt assumptions, and balance sheet outputs. The model can then help calculate and interpret metrics such as net profit margin, asset turnover, equity multiplier, and overall return on equity. This is especially useful for investors, owners, and financial analysts who want to understand the quality of the projected return. A restaurant may appear attractive based on profit alone, but DuPont analysis can reveal whether that profit is supported by efficient operations or whether returns rely too heavily on leverage. For funding preparation, this component adds depth to the investment case by showing that the business has been reviewed from a return and capital efficiency perspective, not only from a sales and expense perspective.
Revenue Inputs
The revenue inputs section is one of the most important parts of the Fast Food Restaurant Financial Model because it defines the assumptions that drive the entire forecast. For a fast food restaurant, revenue is usually built from customer traffic, average order value, operating days, weekday and weekend demand patterns, sales channels, menu categories, and growth over time. This component allows users to adjust assumptions such as daily covers, average check size, food sales, beverage sales, events or catering revenue, delivery contribution, takeaway demand, and expected increases in volume as the restaurant gains awareness. By separating the drivers of revenue rather than using one simple sales estimate, the model gives users a more realistic way to project income. It can help answer practical questions such as how many customers are needed per day, whether weekend demand is essential to reaching profitability, and how price changes may affect annual sales. This section is useful for business planning because it connects the restaurant’s commercial strategy with the financial forecast. It also helps users test whether their assumptions are realistic for the location, concept, capacity, menu positioning, and target customer base. When used properly, the revenue inputs section becomes the foundation for a more credible financial plan.
Bank-Ready Reports
The bank-ready reports section provides lender-friendly financial outputs that can support loan applications, funding discussions, and formal business planning. Fast food restaurants often require significant upfront investment for renovation, kitchen equipment, fixtures, point-of-sale systems, signage, permits, deposits, opening inventory, and working capital. Banks and other lenders typically want to see structured financial statements that show how the business expects to generate enough cash to cover expenses and repay debt. This component may include an automated profit and loss statement, cash flow statement, balance sheet, and supporting schedules that present the forecast in a professional format. Inputs from revenue, costs, payroll, capital expenditures, and financing assumptions flow into these statements, helping users create a more complete financial package. The reports are useful because they organize the financial model in a way that lenders, investors, accountants, and advisors can review efficiently. They can also help users understand the relationship between profitability and liquidity, which is especially important in the restaurant industry. A restaurant may show positive earnings but still face cash pressure due to startup spending, loan repayments, inventory purchases, or seasonal fluctuations. Bank-ready reports make those dynamics easier to evaluate and explain.
Revenue Breakdown
The revenue breakdown section gives users a detailed view of how total sales are generated across different revenue streams. A fast food restaurant may earn revenue from core food items, beverages, combo meals, desserts, upsells, delivery orders, takeaway sales, catering, private events, or other add-on services. This component helps separate those categories so users can see which streams contribute the most to overall revenue and which may offer higher margins or better growth potential. Inputs may include sales mix percentages, average transaction values, channel-specific demand, growth rates, and pricing assumptions. Outputs may show revenue by category, revenue contribution over time, and changes in mix as the business scales. This is useful because not all restaurant revenue is equally profitable. Food sales may drive volume, beverages may support stronger margins, and events or catering may provide incremental sales outside normal peak hours. By reviewing the revenue breakdown, users can identify where to focus marketing, menu development, pricing, and operational capacity. This section also improves investor communication because it shows that total revenue is not a vague top-line number but is supported by specific, editable assumptions. For decision-making, it helps users understand whether the restaurant’s revenue model is diversified enough and whether certain streams should be expanded, reduced, or repositioned.
KPI Dashboard
The KPI dashboard provides a performance-focused view of the metrics that matter most for a fast food restaurant. While financial statements show the overall results, key performance indicators help users understand operational efficiency, profitability, and business health in a more direct way. This component may track metrics such as gross margin, food cost percentage, beverage margin, labor cost percentage, EBITDA margin, net profit margin, average order value, customers per day, revenue per employee, cash runway, break-even timing, and return metrics. It may also allow users to compare performance against industry benchmarks, helping validate whether assumptions are reasonable for a quick service or fast casual restaurant. This is valuable because fast food profitability depends on managing small margins at high volume. If food costs, labor costs, or rent rise too much as a percentage of revenue, the business can quickly become less profitable even when sales appear strong. The KPI dashboard helps users detect these issues early and make better decisions about pricing, staffing, supplier negotiations, promotions, and expansion timing. For founders and managers, it provides a practical management tool. For investors and lenders, it shows that the business is being measured against clear financial and operational standards.
Startup Cost and CAPEX Breakdown
The startup cost and CAPEX breakdown section helps users estimate the initial investment required to open or expand a fast food restaurant. Launching this type of business often involves major upfront spending before revenue begins, including leasehold improvements, kitchen equipment, refrigeration, cooking systems, furniture, fixtures, signage, technology, point-of-sale systems, deposits, licenses, insurance, initial inventory, pre-opening payroll, training, and launch marketing. This component allows users to organize those costs in one structured schedule and distinguish between capital expenditures, one-time setup expenses, and working capital needs. Outputs may include total startup funding required, timing of cash outflows, depreciation inputs, and the amount of capital needed before the restaurant reaches stable operations. This is useful for planning because underestimating startup costs is one of the most common risks in restaurant launches. A detailed breakdown helps founders understand how much money must be raised, how much should be reserved for early operating losses, and whether the opening plan is financially realistic. It also supports funding documents by giving investors and lenders a clear explanation of how capital will be used. For existing operators, this section can also be adapted for renovation, new location openings, franchise expansion, or equipment replacement planning.
Break-Even Analysis
The break-even analysis section helps users identify when the fast food restaurant may begin covering its costs and moving into profitability. This component connects revenue assumptions, cost of goods sold, payroll, fixed overhead, and contribution margin to determine the level of sales needed to cover expenses. Inputs may include average order value, customer traffic, food and beverage cost percentages, labor costs, rent, utilities, marketing, insurance, payment processing fees, packaging, and other operating expenses. Outputs may include the break-even month, break-even revenue, break-even customer volume, and the gap between projected sales and required sales. This is especially useful for restaurant planning because the early months often involve heavy spending, operational learning, and uncertain demand. By understanding the break-even point, users can make better decisions about pricing, promotions, staffing, opening hours, menu mix, and cash reserves. It also helps funding discussions because investors and lenders typically want to know how quickly the business can become self-sustaining.
Excel – Single-User: .xlsx
Excel – Multi-User: .xlsx
Similar ProductsOther customers were also interested in...


 HenrySheykin
Fast Casual Restaurant Financial Model Excel Templ...
The Fast Casual Restaurant Financial Model helps entrepreneurs, restaurant owners, consultants, anal... Read more

Donut Shop Financial Model Excel Template
The Donut Shop Financial Model helps entrepreneurs, founders, business owners, consultants, and anal... Read more

Drive-Thru Restaurant Financial Model Excel Templa...
The Drive-Thru Restaurant Financial Model Template helps users turn a quick-service restaurant conce... Read more

Food Court Financial Model Excel Template
The Food Court Financial Model helps entrepreneurs, founders, business owners, consultants, and anal... Read more

 Giorgos
Food Truck Financial Model – 5 Year Financial Fo...
This Financial Model presents an advanced 5-year financial plan for a startup or operating Food Truc... Read more

Pizzeria Financial Model – 5 Year Financial Fore...
Financial Model providing advanced financial planning & analysis for a Pizzeria business. Suitab... Read more
Cloud Kitchen Financial Model – 5 Year Financial...
A Cloud Kitchen—also referred to as a “ghost kitchen” or “virtual kitchen”—is a commerci... Read more

 Peter Graf
Karaoke Lounge Financial Model
The idea of this Karaoke Lounge Financial Model is, that you offer 3 separate Karaoke rooms for litt... Read more

 Excel Business Resou...
Fast Food Restaurant Financial Model Template
Maximize fast food financials with our user-friendly financial model template. Easily forecast sales... Read more
Restaurant Financial Model Excel Template
" The Restaurant Financial Model helps users turn a restaurant concept into a structured, editable f... Read more
You must log in to submit a review.