
0 ITEMS

Donut Shop Financial Model Excel Template
The Donut Shop Financial Model helps entrepreneurs, founders, business owners, consultants, and analysts turn a donut shop concept into a structured five-year financial forecast. Instead of starting with a blank spreadsheet, users can work from a ready-to-use model designed around the economics of a retail bakery, including customer traffic, average order value, product mix, ingredient costs, operating expenses, payroll, cash flow, and profitability. The template gives users a practical way to estimate whether a donut shop can generate enough sales to cover its fixed and variable costs, support day-to-day operations, and grow into a sustainable business. Built for business planning, funding preparation, lender conversations, and internal decision-making, this financial model template helps users organize assumptions in a clear and professional format. It supports revenue assumptions for weekday and weekend demand, multiple revenue streams, cost of goods sold, startup costs, ongoing expenses, staffing needs, and working capital requirements. Users can adjust the inputs to match their own location, pricing strategy, menu structure, catering plans, marketing budget, and growth expectations, then review the effect on profit, cash flow, and break-even timing. The model is especially useful for people preparing a donut shop business plan, investor presentation, bank loan package, or expansion analysis. It brings together the core financial statements and planning outputs that stakeholders typically expect, including profit and loss projections, cash flow forecasting, balance sheet planning, investor return metrics, scenario analysis, and visual reporting. By connecting assumptions to financial outputs, it helps users understand the relationship between sales volume, food costs, payroll, operating leverage, and overall profitability. With editable fields, pre-built formulas, and a polished reporting structure, the Donut Shop Financial Model saves time while still allowing full customization. Users can test low, base, and high scenarios, review break-even analysis, evaluate funding needs, and make more informed decisions before committing capital. Whether launching a new donut shop, refining an existing bakery concept, or advising a client, this template provides a practical framework for financial planning, budgeting, and strategic decision-making.
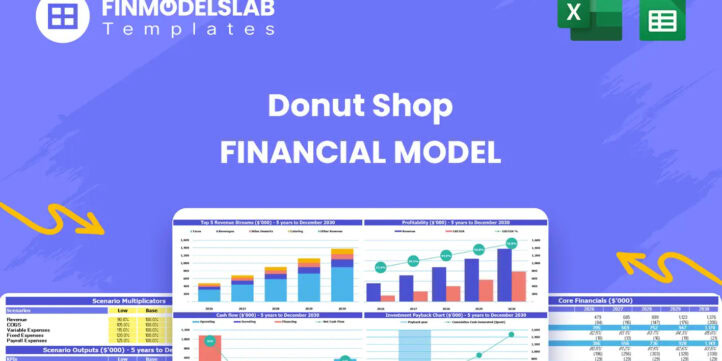


Financial Model Overview
The Donut Shop Financial Model is a ready-to-use financial model template built to help users plan, evaluate, and present the financial outlook of a donut shop or retail bakery concept. It brings together the major assumptions that drive this type of business, including daily customer traffic, average order value, revenue mix, ingredient costs, labor planning, operating expenses, startup investment, cash flow, and profitability. For entrepreneurs and founders, it provides a structured way to understand how much capital may be needed, how sales can grow over time, and when the business may become profitable. For consultants, analysts, lenders, and investors, it creates a clear framework for reviewing the business case and testing whether the plan is realistic. The template is designed for five-year projections and is fully editable, so users can replace the sample assumptions with their own pricing, location strategy, staffing plan, cost structure, and growth expectations. Instead of building formulas and financial statements from scratch, users can focus on the commercial questions that matter most, such as how many customers the shop needs each day, whether catering can improve margins, how payroll scales with demand, and whether the business can maintain enough cash to operate smoothly.
All-in-One Dashboard
The all-in-one dashboard gives users a central view of the donut shop’s most important inputs and outputs in one place. It is designed to make the model easier to navigate by connecting the key assumptions, financial results, and performance indicators that drive the forecast. Users can review core inputs such as sales assumptions, cost assumptions, startup investment, financing assumptions, and operating targets, then see how those assumptions flow through to revenue, profit, cash flow, and ending cash balances. For a donut shop, this is especially useful because performance depends on a combination of high-volume daily sales, average ticket size, ingredient cost control, labor scheduling, and repeat customer demand. The dashboard helps users avoid getting lost in the detail by providing a quick summary of what the model is saying about the business. It can support internal planning, investor discussions, loan applications, and management reviews by giving stakeholders a clean view of the forecast without requiring them to inspect every worksheet. Because the dashboard is connected to the underlying model, changes to assumptions can be reflected in the outputs, allowing users to quickly understand whether a change in customer volume, pricing, cost of goods sold, or payroll materially affects the business plan.
Low, Base, and High Scenario Analysis
The low, base, and high scenario analysis section helps users evaluate how the donut shop may perform under different business conditions. A single forecast is rarely enough for a new food service business because actual results can vary based on location, foot traffic, pricing acceptance, seasonality, ingredient inflation, marketing performance, and staffing efficiency. This component gives users a structured way to compare conservative, expected, and optimistic outcomes using different assumptions for revenue growth, daily customer counts, average order value, cost of goods sold, payroll, and other operating expenses. The low scenario can be used to stress-test the business against slower sales, weaker catering demand, or higher food costs. The base scenario can represent the most realistic operating plan used for budgeting and funding conversations. The high scenario can show upside potential if marketing, customer retention, weekend demand, or catering revenue performs better than expected. The outputs help users compare sales, gross profit, EBITDA, net income, cash flow, and funding needs across the three cases. This is valuable for planning because it highlights the assumptions that matter most and gives decision-makers a clearer view of risk, flexibility, and possible outcomes before committing capital.
Professional Charts
The professional charts component converts financial projections into visual reports that are easier to interpret and present. Donut shop planning often involves many moving parts, including revenue streams, cost categories, payroll levels, startup spending, cash balances, and profitability margins. Charts help users see trends and relationships that may be harder to identify in rows of numbers. This section may include visual summaries of revenue growth, expenses, cash flow, EBITDA, profit margins, customer volume, and other financial metrics over the five-year forecast period. Users can rely on these charts when preparing a business plan, investor deck, lender presentation, or internal management report. For example, a revenue chart can show whether the business is growing steadily, while a cash flow chart can highlight whether the shop has enough liquidity after launch. Expense and margin charts can show how ingredient costs and labor affect profitability as sales volume increases. Because the charts are tied to the model’s assumptions and outputs, they can update as users change the forecast. This makes the template more useful for decision-making because users can visually compare the impact of different pricing, traffic, cost, or growth assumptions without manually rebuilding presentation materials.
ROE Components and DuPont Analysis
The ROE components and DuPont analysis section helps users understand what is driving return on equity and overall shareholder value. While many donut shop forecasts focus only on sales and profit, investors and owners also want to know how effectively the business uses capital to generate returns. DuPont analysis breaks return on equity into underlying components, typically connecting profitability, asset efficiency, and financial leverage. In practical terms, this allows users to see whether returns are coming from strong profit margins, efficient use of assets, or the capital structure of the business. Inputs may include net income, equity, total assets, revenue, debt, and related balance sheet items. Outputs can include return on equity, profit margin, asset turnover, and leverage measures that help explain why returns improve or weaken over time. For a donut shop, this is useful because the business may require upfront investment in equipment, buildout, vehicles, signage, point-of-sale systems, and working capital. Understanding how those investments translate into revenue and profit helps owners and investors evaluate whether the business is using capital efficiently. This component supports funding conversations, investor review, and long-term planning by moving beyond simple profit forecasts into return-based analysis.
Revenue Inputs
The revenue inputs section is where users define the commercial assumptions that drive the donut shop’s sales forecast. For a donut shop, revenue is typically influenced by daily customer traffic, average order value, weekday and weekend demand patterns, product mix, catering volume, and potential growth over time. This component allows users to adjust the assumptions that reflect how the business will actually sell, such as expected daily covers, pricing for core menu categories, customer spending behavior, and the contribution of different revenue streams. It may include assumptions for donuts, beverages, sides, desserts, catering, and other bakery or food service offerings. These inputs then feed into monthly and annual revenue projections, helping users understand how changes in traffic, pricing, or mix affect total sales. This is especially valuable for planning because small differences in daily customers or average ticket size can have a major impact on profitability in a high-frequency retail food business. By documenting revenue assumptions clearly, users can build a forecast that is easier to explain to investors, lenders, partners, or internal stakeholders. It also makes the model more practical for decision-making because users can test pricing strategies, menu expansion, promotions, weekend demand, and catering growth in a structured way.
Bank-Ready Reports
The bank-ready reports component organizes the forecast into clean financial outputs that are suitable for lenders, investors, and other stakeholders. When seeking a loan or outside funding for a donut shop, users need more than a sales estimate. They typically need a clear profit and loss statement, cash flow forecast, balance sheet, financing assumptions, repayment visibility, and a credible explanation of how the business can meet its obligations. This section helps present those outputs in a professional format, making it easier to support a loan application, investor discussion, or business plan submission. Inputs from the rest of the model, such as revenue assumptions, startup costs, operating expenses, payroll, debt financing, and working capital needs, flow into the financial statements and summary reports. The outputs can show projected revenue, gross profit, EBITDA, net income, cash balance, assets, liabilities, equity, and other key figures over the forecast period. For lenders, this can help demonstrate whether the donut shop has enough cash flow to support debt payments and continue operating. For owners, it provides a disciplined way to review the financial impact of launching, expanding, or financing the business.
Revenue Breakdown
The revenue breakdown section gives users a more detailed view of how total sales are generated across the donut shop’s different revenue streams. Rather than treating revenue as one simple line item, this component separates the business into meaningful categories such as main food items, beverages, sides, desserts, catering, or other revenue channels relevant to the shop’s concept. Users can input or adjust assumptions for each stream, including pricing, sales mix, growth rate, customer volume, and average order contribution. The model can then show how each stream contributes to monthly and annual revenue, gross margin, and overall business performance. This is useful because not all revenue streams have the same margin profile or operational requirements. Beverages, for example, may offer strong margins and increase average order value, while catering may create larger order sizes but require advance planning, staffing, packaging, and delivery coordination. A revenue breakdown helps users identify which parts of the business are most important to growth and which deserve more marketing, operational focus, or cost control. It can also strengthen a business plan by showing that the forecast is based on specific sales drivers rather than a single unsupported revenue assumption.
KPI Dashboard
The KPI dashboard focuses on the performance metrics that help users monitor whether the donut shop is on track financially and operationally. A donut shop owner needs to understand more than total sales, because the health of the business depends on metrics such as gross margin, labor cost, EBITDA margin, cash balance, average order value, revenue per customer, cost of goods sold as a percentage of sales, and return measures. This component summarizes key performance indicators in a format that can be reviewed quickly by owners, managers, investors, consultants, or lenders. Inputs from revenue, expenses, payroll, and financial statement sections feed into the KPI calculations, creating a concise view of the business’s efficiency and profitability. The KPI dashboard may also support benchmarking by helping users compare projected performance against food service or bakery standards. This is valuable for decision-making because it can reveal whether the business plan is too aggressive, whether margins are being compressed by ingredient costs, or whether payroll is growing faster than sales. By monitoring KPIs over time, users can make better choices about pricing, staffing, promotions, purchasing, and expansion timing.
Startup Costs and CAPEX Planning
The startup costs and CAPEX planning section helps users estimate the initial investment required to launch or prepare the donut shop for operations. A donut shop can require significant upfront spending before the first sale is made, including kitchen equipment, ovens, refrigeration, display cases, point-of-sale systems, leasehold improvements, permits, signage, branding, initial inventory, packaging, technology, deposits, professional fees, and pre-opening marketing. If the concept includes a mobile or food truck model, vehicle purchase and equipment installation may also be important capital expenditures. This component allows users to organize those costs into a clear budget, separate one-time launch spending from ongoing operating expenses, and determine how much funding may be needed before opening. The outputs can feed into the cash flow forecast, balance sheet, depreciation assumptions, and funding requirements. This is useful for business planning because underestimating startup costs is one of the most common reasons new food businesses experience early financial pressure. A structured CAPEX and startup budget helps users prepare more realistic funding requests, plan launch timing, set aside working capital, and avoid unexpected cash shortages during the critical opening period.
Break-Even Analysis
The break-even analysis section helps users determine when the donut shop may generate enough revenue to cover its fixed and variable costs. This component is especially important for food service businesses because profitability depends on balancing customer volume, average order value, ingredient costs, labor, rent, utilities, marketing, and other operating expenses. Users can adjust assumptions such as sales volume, pricing, gross margin, payroll, rent, and fixed overhead to estimate the revenue level needed to reach break-even. The outputs may include break-even sales, break-even timing, contribution margin, required customer counts, and the point at which the business begins producing positive profit. For a donut shop, this analysis can help owners understand how many daily transactions are needed, whether weekend demand is critical to viability, and how much margin improvement is required if ingredient or labor costs increase. It is also useful for lenders and investors because it provides a clear milestone for assessing risk and business sustainability. By linking break-even analysis to the broader five-year forecast, the template helps users move from general optimism to a more measurable profitability target.
File types:
Excel – Single-User: .xlsx
Excel – Multi-User: .xlsx
Similar ProductsOther customers were also interested in...


 HenrySheykin
Fast Casual Restaurant Financial Model Excel Templ...
The Fast Casual Restaurant Financial Model helps entrepreneurs, restaurant owners, consultants, anal... Read more

Fast Food Financial Model Excel Template
The Fast Food Restaurant Financial Model helps entrepreneurs, founders, restaurant owners, consultan... Read more

Drive-Thru Restaurant Financial Model Excel Templa...
The Drive-Thru Restaurant Financial Model Template helps users turn a quick-service restaurant conce... Read more

Food Court Financial Model Excel Template
The Food Court Financial Model helps entrepreneurs, founders, business owners, consultants, and anal... Read more

 Giorgos
Food Truck Financial Model – 5 Year Financial Fo...
This Financial Model presents an advanced 5-year financial plan for a startup or operating Food Truc... Read more

Pizzeria Financial Model – 5 Year Financial Fore...
Financial Model providing advanced financial planning & analysis for a Pizzeria business. Suitab... Read more
Cloud Kitchen Financial Model – 5 Year Financial...
A Cloud Kitchen—also referred to as a “ghost kitchen” or “virtual kitchen”—is a commerci... Read more

 Peter Graf
Karaoke Lounge Financial Model
The idea of this Karaoke Lounge Financial Model is, that you offer 3 separate Karaoke rooms for litt... Read more

 Excel Business Resou...
Fast Food Restaurant Financial Model Template
Maximize fast food financials with our user-friendly financial model template. Easily forecast sales... Read more
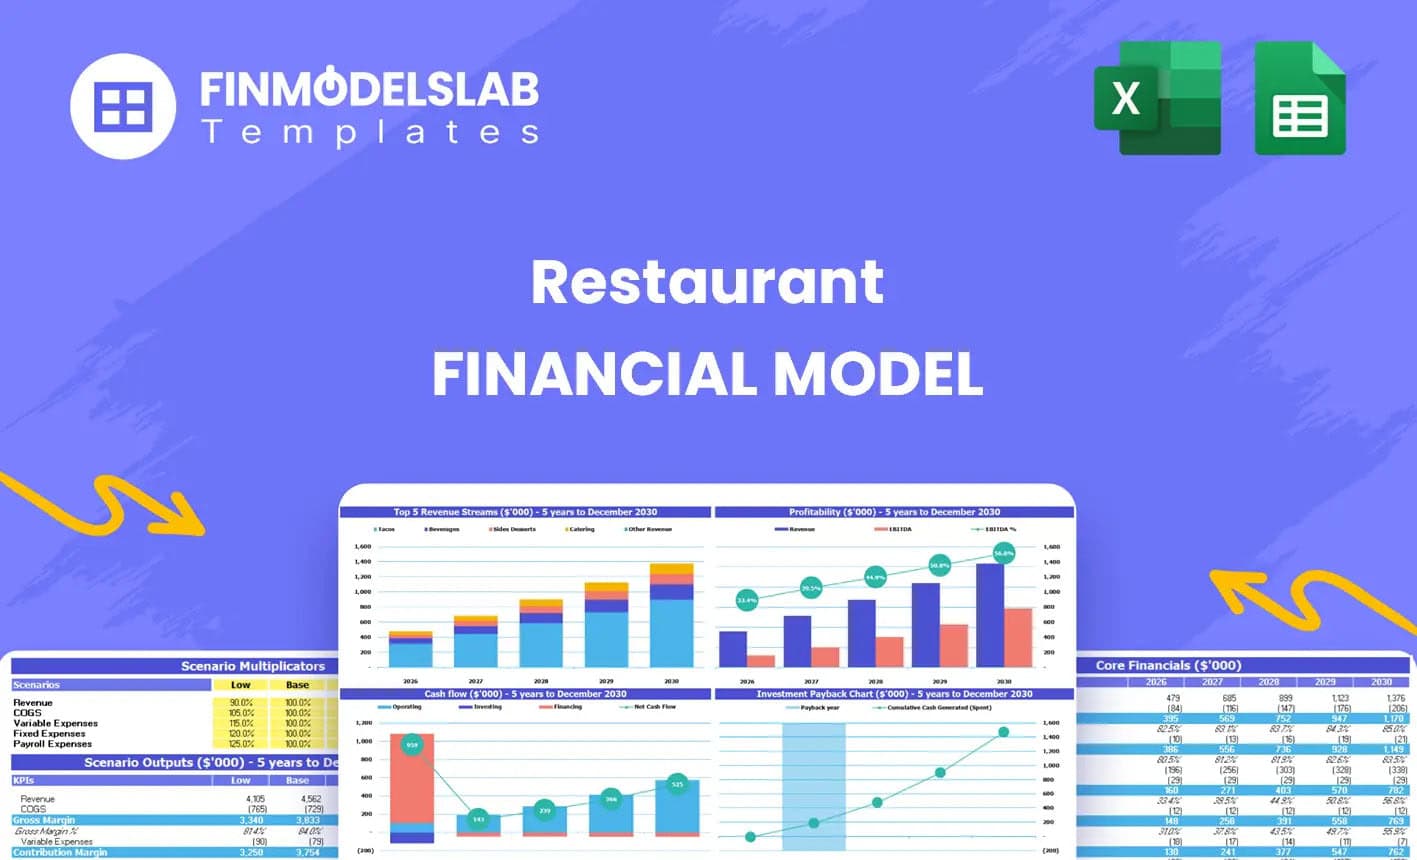
Restaurant Financial Model Excel Template
" The Restaurant Financial Model helps users turn a restaurant concept into a structured, editable f... Read more
You must log in to submit a review.