Restaurant Financial Model Excel Template
Get Your Restaurant Financial Model Template. Spend less time on Cash Flow forecasting and more time on your products. Restaurant Financial Projection Model Excel for startups or established companies is the right choice when they need to raise funds from investors or bankers and calculate funding requirements, make cash flow projections, develop budgets for the future years, or enhance a business plan. Consider using Restaurant Finance Projection before buying the restaurant business. Unlocked – edit all – last updated in Sep 2020. A Comprehensive package of investor-ready reports, including a restaurant profit and loss pro forma, projected cash flow statement format, an industry benchmark KPIs, and an extended set of financial ratios.

NOTE: Single-User pertains to a limited Single User License where the template can only be used by one single user; while Multi-User is a license for users sharing the template with up to 20 members. Please refer to Terms of Use and License and Permitted Use for clarification.
RESTAURANT FINANCE PROJECTION KEY FEATURES
Video tutorial:
Prove You Can Pay Back the Loan You Requested
When you apply for a business loan, bankers will study your Cash Flow Statement in an attempt to answer this question: Can this business pay back the loan? Requesting a loan without showing your Cash Flow Projection for paying it back is a common way to land in the rejection pile. It is exceptionally accurate if your current cash flow won’t cover all of your monthly operating expenses — plus your loan payment. Don’t fall into this kind of situation. Use Cash Flow Forecast to strengthen your case by showing the banker exactly how you plan to use the loan and when you will start repaying the debt. This type of forecasting helps you create a road map that can impress a lender with the confidence they need to approve your loan.
Build your plan and pitch for funding
Impress bankers and investors with a proven, strategic Restaurant Pro Forma Projection that impresses every time.
Build your plan and pitch for funding
Impress bankers and investors with a proven, solid restaurant financial model that impresses every time.
Get it Right the First Time
Funding is a binary event: either you succeed or you fail. If you fail, most investors won’t give you a second chance. Learn about the pros and cons with Restaurant Financial Model In Excel.
We do the math
Financial Model Excel Spreadsheet has all the required features ready with no formula writing, no formatting, no programming, no charting, and no expensive external consultants! Concentrate on the task of planning rather than programming.
Run different scenarios
A Cash Flow Statement Forecast shows you what your cash balance will look like taking into account the numbers you put into the template. It means you can play with the various variables that impact your cash flow forecast, i.e., wages, sales inflow, supplier payments, taxes, and so on. By adjusting the input amounts, you will be able to see what impact they will have on your businesses’ cash flow and when this impact is likely to occur. A well-known example of this is the ability to forecast the effect a new member of staff might have on your cash flow over different periods. Increase the wage costs and see what happens to your cash flow. Running different scenarios in your Projected Cash Flow Statement Format can have several benefits.
REPORTS and INPUTS
Cap Table
The Restaurant P&L Projection has built-in proformas to calculate discounted cash flows and various sales’ and EBITDA valuations. Business owners can use these valuations to assess the exit value and perform the financial projections of returns to investors.
Users can use the Cap table or ignore it; it will not have a negative impact on the other financial calculations in the model.
Costs
A Restaurant 3 Way Forecast Excel Template is an important financial tool that enables users to identify actual and forecasted expenditures, as well as financial resources needed to cover these costs. With a well-developed cost budget, you can see the areas where you can save money and the areas of high priority. As a part of a business plan, the cost budget supports the process of pitching to investors and loan applications.
Burn and Runway
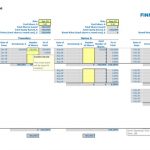
This Restaurant 3 Way Financial Model automatically calculates the cash burn rate based on the inputs from other spreadsheets, in particular, from the cashflow forecast.
Profitability KPIs
Internal rate of return (IRR). An internal rate of return or IRR is the interest rate or such type of a discount rate that yields a net present value of the net cash flow stream from different kinds of investments and actions. IRR financial metric is very important for investors and analysts. IRR is usually shown as a percentage.
Top Expenses
It is very important for a start-up and existing company to monitor, plan, and manage its costs and expenses to maintain a good profitability level.
For this purpose, it is necessary to analyze the highest costs and always work on their optimization. In our Financial Projection Template Excel we have created a Top expense report helps users with this task. It summarizes the four biggest expense categories and the rest of the expenses as the ‘other’, so the users can easily monitor these expenses and track the tendencies related to their increase or decrease from year to year.
Financial KPIs
The Restaurant Financial Model Excel Template has key financial indicators (KPIs) that show sales and profitability performance: revenue growth rate, gross margin, and EBITDA margin.
It also has KPIs related to cash flows and raising investment: the cash burn rate, runway and funding need. You can choose the KPIs relevant to your company and industry, and monitor your company’s performance. For example, SaaS companies typically monitor and manage customer lifetime value (LTV), customer acquisition costs (CAC), LTV/CAC ratio, and the churn rate. For SaaS businesses, these KPIs are crucial.
Performance KPIs
Return on equity. The return on equity financial metric can be calculated based on the information both from the Balance Sheet and pro forma profit and loss statement. It measures the correspondence of earnings to the equity, i.e., the amount of money used to get profits.
File types:
Excel – Single-User: .xlsx
Excel – Multi-User: .xlsx
Free Demo – .xlsx
Similar Products
Other customers were also interested in...
Cafe Financial Model Excel Template
Check Our Cafe Budget Template. Creates a financial summary formatted for your Pitch Deck. Ready to ... Read more
Catering Financial Model Excel Template
Check Our Catering Pro-forma Template. Excel template - robust and powerful. This is your solid foun... Read more
Pizzeria Financial Model Excel Template
Get Your Pizzeria Budget Template. Excel template - robust and powerful. This is your solid foundati... Read more
Vegan Restaurant Financial Model Excel Template
Get the Best Vegan Restaurant Financial Plan. Excel template - robust and powerful. This is your sol... Read more
Hospitality Financial Model Template Bundle
Planning to start a business in the hospitality industry? Do you want to try starting a Hotel busine... Read more
A La Carte Restaurant Financial Model Excel Templa...
Shop A La Carte Restaurant Budget Template. Allows investors and business owners to make a complete ... Read more
Fast Casual Restaurant Financial Model Excel Templ...
Purchase Fast Casual Restaurant Financial Projection Template. Allows you to start planning with no ... Read more
Pub Financial Model Excel Template
Try Pub Financial Model. Based on years of experience at an affordable price. Pub Budget Financial M... Read more
Fine Dining Restaurant Financial Model Excel Templ...
Try Fine Dining Restaurant Pro-forma Template. Creates 5-year financial projection and financial rat... Read more
Gourmet Food Store Financial Model Excel Template
Gourmet Food Store Financial Model Allows you to start planning with no fuss and maximum of help . S... Read more
You must log in to submit a review.


