
0 ITEMS

Crossfit Gym Financial Model Excel Template
The CrossFit Gym Financial Model helps founders, gym owners, consultants, and analysts turn a fitness business concept into a structured financial forecast. Instead of building a complex spreadsheet from scratch, users can work from an editable financial model template designed around the core economics of a CrossFit gym, including membership capacity, class occupancy, pricing, personal training, workshops, merchandise, staffing, startup costs, operating expenses, cash flow, and profitability. It gives users a practical way to test assumptions before launching, expanding, raising capital, or preparing a business plan. Built for financial planning and decision-making, the template connects the main revenue assumptions of a CrossFit facility with the cost structure required to operate it. Users can adjust member volume, pricing, revenue streams, payroll, rent, equipment investment, buildout costs, marketing spend, and other business drivers to see how changes affect monthly and annual performance. This makes it useful for evaluating whether the gym can cover fixed costs, sustain operating expenses, generate positive cash flow, and move toward long-term profitability. The model is also helpful for people preparing funding documents, investor presentations, lender packages, or internal planning materials. It organizes projections into a professional structure with forecast outputs, bank-ready reports, visual dashboards, KPI summaries, profitability views, and scenario analysis. Entrepreneurs can use it to explain how the business is expected to make money, how much capital may be needed, when the business may reach break-even analysis targets, and what financial results could look like under different assumptions. Because the CrossFit Gym Financial Model is fully customizable, it can be adapted for a new studio, an existing gym, a franchise-style location, or an expansion plan. The template supports clearer budgeting, better forecasting, and more confident decisions by putting revenue, costs, payroll, cash flow, and performance metrics in one connected model. It is designed to save time, reduce guesswork, and help users build a more credible financial plan for launching or managing a CrossFit gym.


Financial Model Overview
The CrossFit Gym Financial Model is a ready-to-use financial model template designed to help entrepreneurs, gym owners, consultants, analysts, and business planners evaluate the financial potential of a CrossFit gym before launch, expansion, or funding discussions. A CrossFit facility has several moving parts that must be planned together, including member capacity, class occupancy, monthly membership pricing, coach payroll, facility rent, equipment purchases, buildout costs, marketing, personal training, workshops, merchandise, cash flow, and profitability.
This template brings those assumptions into one structured model so users can replace rough estimates with a more organized financial planning process. It is built to support business plans, investor materials, lender conversations, and internal decision-making by showing how the gym may perform over time under realistic operating assumptions. Users can edit the inputs, review the outputs, test scenarios, and understand how pricing, utilization, staffing, and cost control affect financial outcomes.
All-in-one Dashboard
The all-in-one dashboard gives users a central view of the CrossFit gym’s most important inputs and outputs, making it easier to understand the business without digging through every worksheet. This component is designed to summarize the financial model in a practical way by connecting assumptions such as member capacity, occupancy, membership pricing, revenue mix, startup investment, operating expenses, payroll, and growth expectations with key outputs such as revenue, EBITDA, profit, cash balance, return metrics, and funding needs.
For a CrossFit gym, this is especially useful because the business depends heavily on utilization and recurring membership revenue, while still carrying fixed costs such as rent, equipment, staffing, insurance, and affiliation-related expenses. The dashboard helps users quickly see whether the model is financially balanced, whether assumptions are producing realistic results, and whether the gym has enough projected income to support its cost structure. It is useful for owners who want a quick operating summary, consultants who need to present findings, and founders preparing investor-ready materials because it turns a detailed forecast into a clear management view.
Low Base High Scenario Analysis
The Low Base High scenario analysis component helps users evaluate how the CrossFit Gym Financial Model performs under different business conditions. Rather than relying on one fixed forecast, users can compare a conservative case, an expected case, and an optimistic case by adjusting key drivers such as class occupancy, membership growth, average monthly fees, personal training adoption, workshop participation, merchandise sales, staffing requirements, and operating cost inflation. This is valuable because a CrossFit gym’s performance can vary significantly based on local demand, retention, competition, coaching quality, class scheduling, and marketing execution.
A low case may show what happens if membership growth is slower or operating expenses are higher than expected, while a high case may show the upside from stronger utilization, better pricing, and higher-margin add-on services. This component supports strategic planning by helping users understand downside risk, set realistic base-case targets, and define stretch goals. It is also useful for lenders and investors because it shows that the business owner has considered uncertainty and can explain how financial results may change if market conditions differ from the original plan.
Professional Charts
The professional charts component converts the CrossFit gym’s financial projections into presentation-ready visuals that are easier to understand than raw spreadsheet outputs. Charts may display revenue growth, profitability trends, cash flow movement, expense categories, member utilization, EBITDA progression, revenue stream contribution, and other performance indicators that help tell the financial story of the business. For a CrossFit gym, visual reporting is especially helpful because stakeholders often want to see how recurring membership income grows over time, how quickly fixed costs are covered, and whether the business is becoming more efficient as occupancy increases.
These charts can be used in business plans, funding decks, lender discussions, internal planning meetings, and performance reviews. They help users communicate assumptions and results in a polished way, reducing the need to manually create graphs from scratch. The component also improves decision-making because trends are often easier to identify visually, such as when revenue growth begins to flatten, when payroll becomes too large relative to sales, or when cash flow improves after the initial launch period.
ROE Components and DuPont Analysis
The ROE components and DuPont analysis section helps users understand the drivers behind return on equity instead of looking at a single return percentage in isolation. This component breaks performance into the underlying factors that influence owner or investor returns, such as profitability, asset efficiency, and financial leverage. In the context of a CrossFit gym, this can help explain whether returns are being driven by strong profit margins, efficient use of invested capital, controlled asset spending, debt structure, or a combination of these factors.
Inputs may include projected net income, revenue, assets, equity, financing assumptions, and operating performance metrics. Outputs can help users assess how effectively the gym turns invested funds into financial returns and whether the business model is creating value for owners. This is particularly useful when preparing investor discussions because it gives more depth than a basic profit forecast. It can also support internal planning by showing whether improving pricing, reducing costs, increasing utilization, or changing the capital structure would have the strongest effect on return performance.
Revenue Inputs
The revenue inputs component is where users build the commercial engine of the CrossFit Gym Financial Model. It allows users to define the assumptions that drive sales, including group class capacity, expected occupancy, monthly membership pricing, personal training volume, workshop and seminar participation, branded merchandise sales, and other revenue opportunities relevant to the gym. Because a CrossFit facility often depends on recurring members while also benefiting from high-margin add-ons, this section helps users model the full revenue picture rather than relying on one broad sales estimate.
Users can adjust pricing, volume, utilization, and growth assumptions to reflect their own market, facility size, launch plan, and customer acquisition strategy. The outputs feed into the revenue forecast, profit and loss statement, cash flow projection, dashboard, and scenario analysis. This component is useful because small changes in membership occupancy or monthly pricing can have a major effect on profitability, especially when fixed costs are significant. By documenting revenue assumptions clearly, users can create a more credible business plan and better understand which activities drive the most value.
Bank-Ready Reports
The bank-ready reports component organizes the model’s outputs into clear financial statements and summaries that can support lender reviews, funding applications, investor meetings, and business planning documents. These reports may include profit and loss projections, cash flow forecasts, balance sheet views, summary assumptions, capital expenditure schedules, debt-related outputs, and key financial metrics. For a CrossFit gym, this matters because lenders and investors typically want to see more than enthusiasm for the concept; they need to understand how the business will generate revenue, manage expenses, repay obligations, maintain liquidity, and produce sustainable earnings. This section helps present the forecast in a structured and professional format, reducing the time required to prepare supporting financial materials. Users can review monthly and annual outputs, identify financing gaps, and explain how startup costs, operating expenses, payroll, and revenue streams work together. The reports are useful for demonstrating financial readiness, supporting loan discussions, and giving stakeholders confidence that the gym has been planned with a disciplined approach.
Revenue Breakdown
The revenue breakdown component gives users a detailed view of how total sales are built from each revenue stream in the CrossFit gym. Instead of seeing only one top-line revenue number, users can separate income from group memberships, personal training, workshops and seminars, branded merchandise, and other services or products that may be part of the business model. This is useful because each revenue stream has different pricing, margin, capacity, staffing, and growth characteristics. Group classes may provide recurring monthly income, personal training may generate higher revenue per customer, workshops may add periodic cash flow, and merchandise may support brand loyalty while contributing additional sales.
By viewing these streams separately, users can understand which parts of the business drive the largest share of revenue and which may offer the best opportunities for expansion. The section can support pricing decisions, capacity planning, marketing allocation, and profitability analysis by showing how changes in one stream affect the overall forecast. It also makes the business plan more transparent for stakeholders who want to understand exactly where projected revenue is coming from.
KPI Dashboard
The KPI dashboard component tracks performance metrics and benchmark-style indicators that help users evaluate the health of the CrossFit gym beyond basic revenue and profit. This may include metrics such as occupancy rate, membership capacity utilization, average revenue per member, revenue per class spot, EBITDA margin, payroll as a percentage of revenue, cash balance, customer growth assumptions, retention-related indicators, and return metrics. For a CrossFit gym, these KPIs are important because the business can appear profitable on the surface while still having operational weaknesses, such as underused class capacity, rising staffing costs, weak add-on revenue, or cash flow pressure.
The KPI dashboard gives users a concise way to monitor the operational drivers behind the financial statements. It supports performance benchmarking, management reviews, investor updates, and ongoing business planning. By connecting financial outcomes with operational metrics, this component helps owners understand not only what the numbers are, but why they are moving. It is especially useful for decision-making because it highlights the levers that can improve performance, such as increasing occupancy, improving pricing, adding higher-margin services, or controlling payroll growth.
Startup Cost and Capital Expenditure Planning
The startup cost and capital expenditure planning component helps users estimate the initial investment required to open or upgrade a CrossFit gym. This section can include major launch costs such as fitness equipment, flooring, rigs, weights, cardio machines, gym buildout, renovation, HVAC upgrades, leasehold improvements, signage, technology systems, point-of-sale software, deposits, permits, licenses, legal costs, initial inventory, pre-opening marketing, and working capital reserves.
For a CrossFit gym, this component is critical because the business often requires meaningful upfront spending before revenue begins, and underestimating these costs can create cash pressure early in operations. Users can edit the assumptions to match the size, location, design, and positioning of their facility, then see how startup costs affect funding needs, cash balance, depreciation, and return metrics. This component is useful for budgeting, investor planning, loan applications, and launch readiness because it clarifies how much money may be needed before opening day. It also helps users prioritize spending by separating essential investments from optional upgrades, making it easier to control capital requirements and avoid overbuilding before membership demand is proven.
Break-Even and Cash Flow Analysis
The break-even and cash flow analysis component helps users understand when the CrossFit gym may become profitable and whether it can maintain enough cash to operate smoothly. Break-even analysis connects revenue assumptions, fixed costs, variable costs, payroll, and pricing to show the sales or membership level needed to cover expenses. Cash flow analysis then shows how money moves through the business over time, including operating cash inflows, startup spending, capital expenditures, debt service, working capital needs, and ending cash balances.
This is especially important for a CrossFit gym because strong projected profit does not always mean the business has enough cash during launch, seasonal shifts, equipment purchases, or growth periods. Users can test how changes in member volume, payment timing, pricing, staffing, rent, marketing, and financing affect liquidity. This component supports better decision-making by identifying potential cash gaps before they happen and helping users plan reserves, funding needs, or cost adjustments. It is also valuable for lenders and investors because it demonstrates whether the business can support operations, repay financing, and reach sustainable profitability under the assumptions in the model.
File types:
Excel – Single-User: .xlsx
Excel – Multi-User: .xlsx
Similar ProductsOther customers were also interested in...


 HenrySheykin
Gym Financial Model Excel Template
The Gym Financial Model Financial Model Template helps entrepreneurs, gym owners, consultants, analy... Read more
Physical Fitness Gym Financial Model Excel Templat...
The Gym Financial Model Template helps entrepreneurs, gym owners, consultants, analysts, and busines... Read more
Pilates Studio Financial Model Excel Template
The Pilates Studio Financial Model helps entrepreneurs, studio owners, consultants, analysts, and bu... Read more
Fitness Center Financial Model Excel Template
The Fitness Center Financial Model Template helps entrepreneurs, gym owners, consultants, analysts, ... Read more
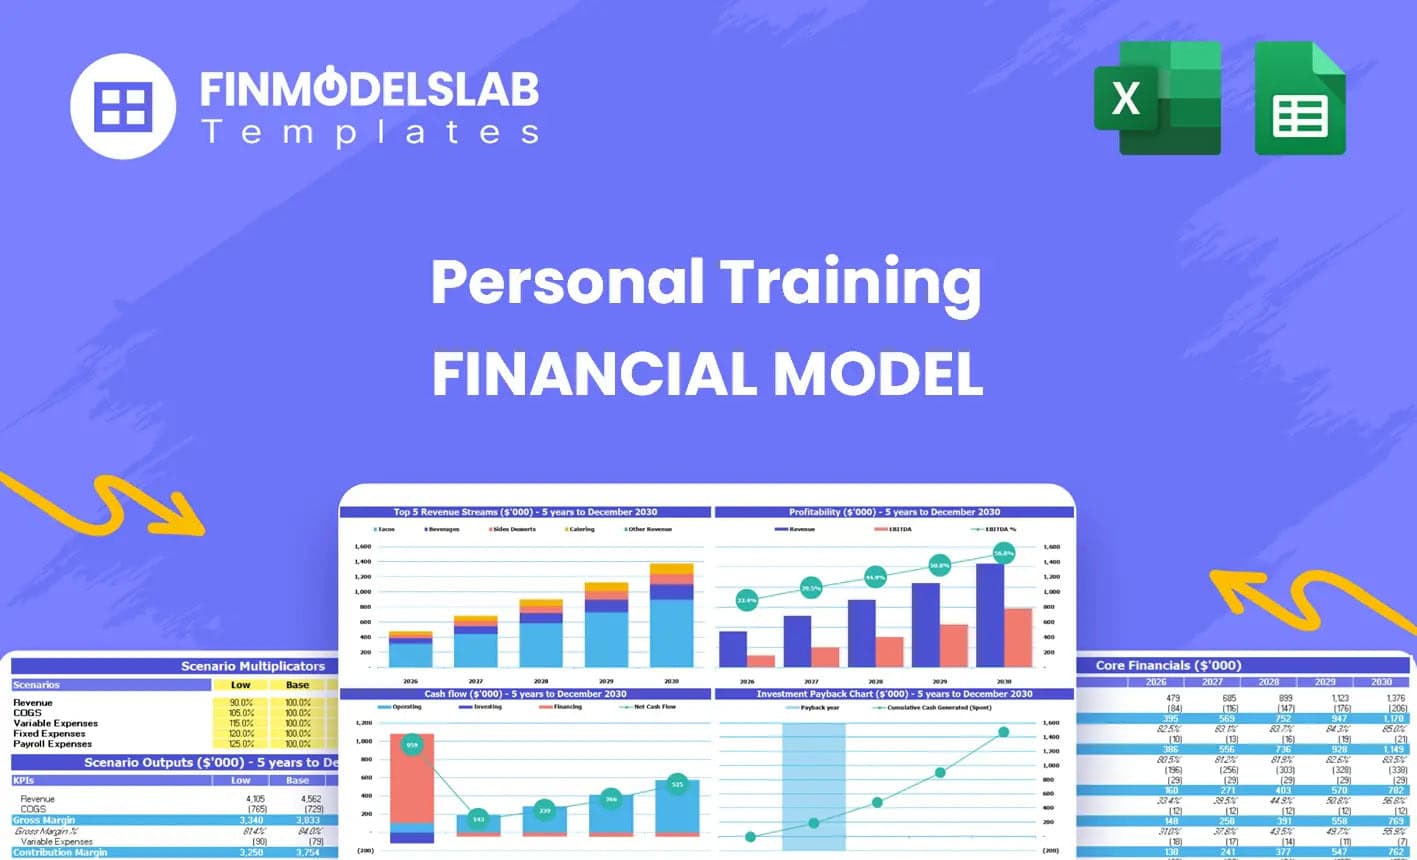
Personal Training Service Financial Model Excel Te...
The Personal Training Financial Model helps entrepreneurs, fitness studio owners, consultants, analy... Read more
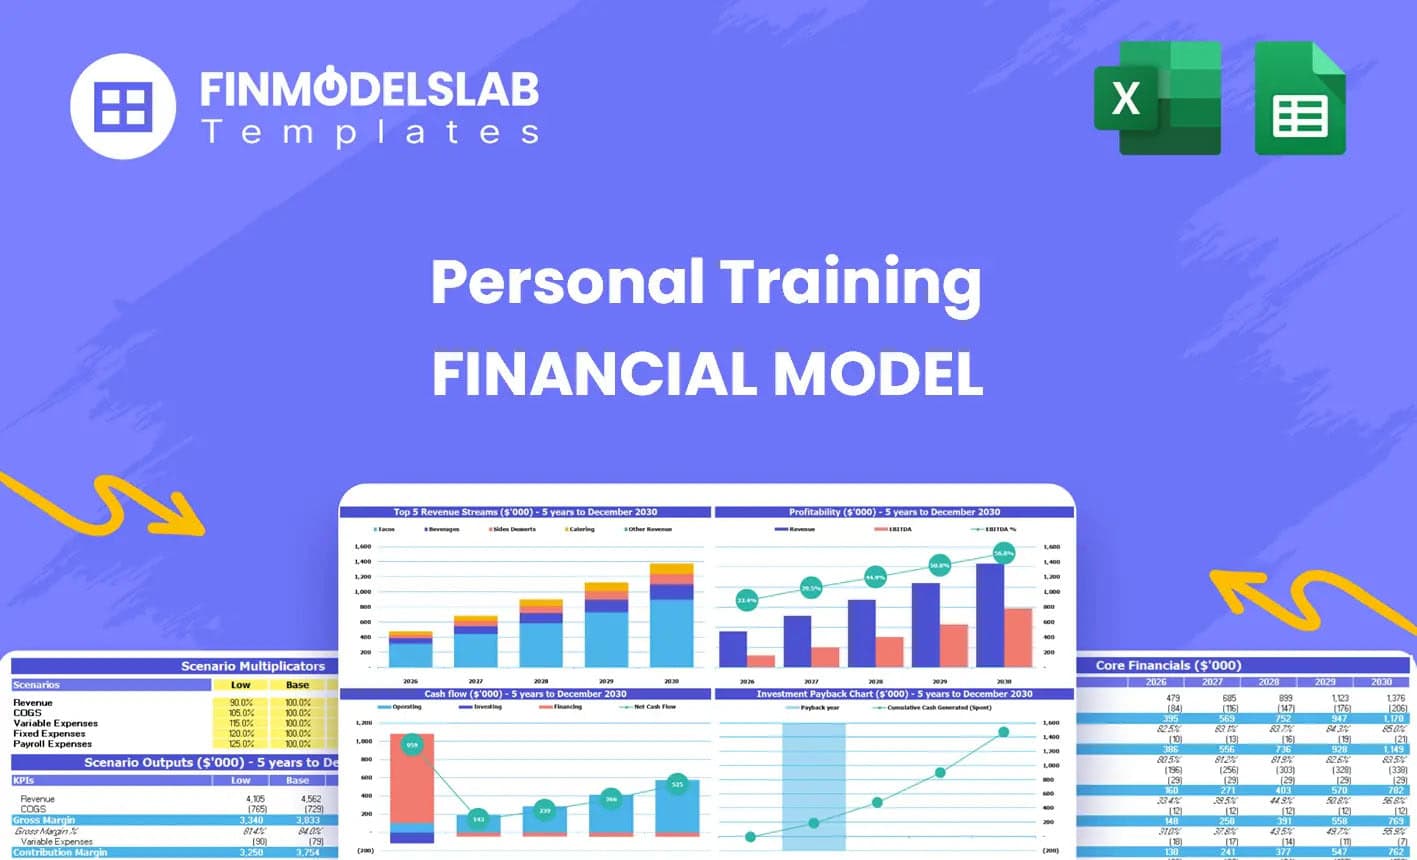
Personal Training Financial Model Excel Template
The Personal Training Financial Model helps entrepreneurs, fitness studio owners, consultants, analy... Read more

 Giorgos
Pilates & Yoga Studio Financial Model – 5 Ye...
Financial Model provides an advanced 5-year financial plan for a startup or operating Pilates & ... Read more

 anthony
Racket Sports Financial Model Bundle
This bundle of financial model templates tailored to racket sports businesses aims to provide a soph... Read more

Multi Sports Complex Financial Model – Dynam...
Financial Model presenting a development and operating scenario of an Indoor Multi-Sports & Fitn... Read more
You must log in to submit a review.