
0 ITEMS

Cattle Farming Financial Model Excel Template
The Cattle Farming Financial Model helps users turn a cattle farm concept, expansion plan, or funding proposal into a structured financial forecast. Instead of starting with a blank spreadsheet, buyers get a ready-to-use model designed around the realities of livestock operations, including breeding herd growth, juvenile cattle sales, harvested beef revenue, feed costs, processing costs, payroll, capital expenditures, cash flow timing, and profitability. It gives entrepreneurs and farm planners a practical way to estimate whether a cattle operation can support its cost structure, reach break-even, and generate sustainable returns over time. This template is built for cattle farm owners, startup founders, agricultural entrepreneurs, consultants, analysts, and anyone preparing a business plan, loan package, investor presentation, or internal budget. It helps users organize revenue assumptions around herd size, offspring production, mortality rates, harvest weights, product mix, and sales pricing, while also connecting those assumptions to cost of goods sold, operating expenses, staffing, startup costs, and ongoing working capital needs. Because cattle farming can require significant upfront investment before meaningful cash flow is generated, the model is especially useful for understanding funding requirements before launch or expansion. The Cattle Farming Financial Model supports financial planning by showing how changes in sales channels, product pricing, feed costs, payroll, and capital spending may affect profit, cash flow, and long-term financial performance. Users can review projected financial statements, test low, base, and high scenarios, monitor key performance indicators, and evaluate break-even timing. This makes the template useful for decision-making around herd scaling, direct-to-consumer beef sales, wholesale distribution, staffing levels, equipment purchases, and financing strategy. The model is fully editable and compatible with Microsoft Excel and Google Sheets, allowing users to customize assumptions for their own cattle farming business. Whether the goal is to secure financing, compare growth strategies, manage farm expenses, or present investor-ready projections, this template provides a professional framework for building credible financial forecasts. It saves time, improves planning discipline, and helps users communicate the financial story of a cattle operation with greater clarity.
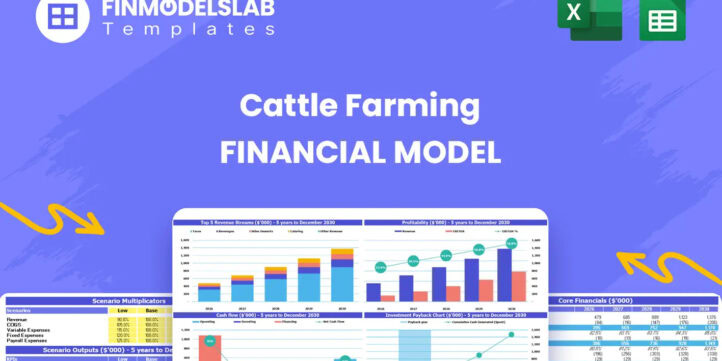


Financial Model Overview
The Cattle Farming Financial Model is a ready-to-use financial model template designed to help entrepreneurs, farm owners, consultants, analysts, and business planners evaluate the financial performance of a cattle farming operation. Cattle farming has a unique financial profile because revenue depends on herd development, breeding productivity, animal survival rates, harvest weights, product mix, and sales channels, while costs include feed, veterinary care, processing, labor, land, equipment, facilities, and working capital. This template brings those assumptions into one structured model so users can forecast revenue, expenses, cash flow, profitability, and funding needs over a multi-year period. It is useful for planning a new cattle farm, expanding an existing operation, preparing a business plan, applying for a loan, building an investor presentation, or reviewing internal strategy. The model is editable, investor-ready, and built to replace guesswork with a practical financial planning framework that connects cattle operations to projected financial outcomes.
All-in-One Dashboard
The all-in-one dashboard gives users a central view of the most important inputs and outputs in the Cattle Farming Financial Model. This section is designed to help users quickly understand the relationship between key assumptions and projected performance without searching through multiple tabs or rebuilding formulas. Inputs may include herd size, breeding females, offspring assumptions, juvenile loss rates, harvest weight per head, sales pricing, product mix, feed cost percentages, processing fees, payroll assumptions, and startup investment requirements. The dashboard then summarizes outputs such as total revenue, gross profit, EBITDA, net income, cash position, funding needs, and other headline metrics. For a cattle farming business, this is valuable because operational decisions can take years to show their financial impact, especially when growing a breeding herd or retaining animals for future production. A clear dashboard allows users to monitor the big picture, identify pressure points, and present the farm’s financial story to partners, lenders, investors, or internal decision-makers in a clean and practical format.
Low, Base, and High Scenario Analysis
The low, base, and high scenario analysis section helps users test how the cattle farming business may perform under different operating and market conditions. A cattle farm is exposed to variables such as beef prices, feed costs, breeding success, mortality rates, product mix, labor requirements, and harvest volumes, so relying on one forecast can create a false sense of certainty. This component allows users to compare conservative, expected, and optimistic cases by adjusting assumptions that drive revenue, cost of goods sold, operating expenses, cash flow, and profitability. For example, the low case may reflect higher feed costs, slower herd growth, or lower direct-to-consumer sales, while the high case may reflect stronger pricing, improved survival rates, better product mix, or faster sales channel development. The outputs help users compare revenue, EBITDA, cash balance, funding requirements, and timing of profitability across scenarios. This is especially useful for business planning, lender discussions, and investor presentations because it shows that the user has considered risk and uncertainty rather than presenting only one static financial outcome.
Professional Charts
The professional charts section converts the model’s calculations into presentation-ready visuals that make financial trends easier to understand. Cattle farming forecasts often involve many moving parts, including multi-year herd growth, revenue expansion, direct costs, operating expenses, payroll, capital expenditures, cash flow, and profitability. Charts help users communicate these relationships clearly by showing trends such as revenue growth over time, cost structure changes, gross margin development, EBITDA progression, cash balance movement, and the relationship between investment and profitability. Inputs come from the model’s assumptions and financial statements, while outputs are displayed as visual summaries that can be used in business plans, pitch decks, loan packages, or management reviews. This component is useful because stakeholders often need to understand the financial direction of the cattle farming business quickly. A clean chart can show whether revenue scales fast enough to absorb fixed costs, whether cash flow pressure is concentrated in the early years, and whether the farm’s profitability improves as the herd matures and operating efficiencies develop.
ROE Components and DuPont Analysis
The ROE components and DuPont analysis section helps users evaluate return on equity by breaking performance into the drivers that influence shareholder or owner returns. In a cattle farming operation, profitability alone does not tell the full story because the business may require significant assets, equipment, facilities, herd investment, and financing before it reaches stable returns. This component may analyze net profit margin, asset turnover, and financial leverage to show how operating efficiency, asset utilization, and capital structure affect return on equity. Inputs can include net income, revenue, total assets, owner equity, debt balances, and projected balance sheet values. Outputs help users understand whether returns are being driven by healthy operating margins, efficient use of farm assets, or increased leverage. This is useful for investors, lenders, and owners because it provides a deeper view of financial performance beyond basic profit and loss. For cattle farming decisions, DuPont-style analysis can support discussions about whether to lease or buy equipment, how much debt to use, how efficiently land and facilities are being utilized, and whether the business can generate acceptable returns on invested capital.
Revenue Inputs
The revenue inputs section is where users define the core assumptions that drive the cattle farm’s sales forecast. For this type of business, revenue is not based on a single price and volume figure. It may depend on the number of breeding females, annual offspring per female, juvenile loss rates, the share of calves sold early, the share retained for grow-out, average harvest weight, market pricing, and the allocation of finished beef across sales categories. This section may include assumptions for juvenile cattle sales, premium direct-to-consumer cuts, wholesale primals, ground beef, specialty products, or other revenue streams relevant to the user’s operation. Outputs flow into the revenue forecast, gross profit calculation, cash flow forecast, and profitability analysis. This component is useful because it connects operational planning directly to financial results. Users can test how a larger breeding herd, lower mortality rate, higher harvest weight, improved pricing, or a stronger direct-to-consumer mix changes the business outlook. It also helps users document assumptions clearly for investors, lenders, or partners who need to understand how projected sales are calculated.
Bank-Ready Financial Reports
The bank-ready financial reports section organizes the model’s results into lender-friendly financial outputs that support funding discussions and loan applications. Cattle farming often requires substantial upfront investment for land access, equipment, barn construction, herd acquisition, infrastructure, and working capital, so lenders need to see more than a simple revenue estimate. This component may include projected income statements, cash flow statements, balance sheets, debt schedules, annual summaries, and key financial metrics that show how the business plans to operate and repay financing. Inputs come from the model’s revenue assumptions, cost structure, payroll plan, capital expenditures, loan assumptions, and operating timeline. Outputs help users present a complete financial picture, including profitability, liquidity, asset base, liabilities, cash shortfalls, and future repayment capacity. This is useful for preparing agricultural loan packages, bank meetings, investor discussions, and formal business planning documents. The structured format helps users communicate that the cattle farming business has been evaluated with professional financial discipline and that funding requirements are supported by detailed projections.
Revenue Breakdown
The revenue breakdown section provides a detailed view of how total sales are generated across the cattle farming business. Instead of showing only one top-line revenue figure, this component separates revenue by stream, such as juvenile cattle sales, harvested beef products, premium direct-to-consumer cuts, wholesale primals, ground beef, and other possible product categories. Inputs may include headcount by animal category, survival rates, harvest weights, product mix percentages, price per kilogram or price per head, and sales channel allocation. Outputs help users see which revenue streams contribute most to total sales, which channels carry the highest value, and how changes in mix affect overall financial performance. This is particularly important in cattle farming because selling live animals, selling wholesale beef, and selling premium packaged products can produce very different margins and cash flow profiles. The section supports better decision-making around sales strategy, marketing focus, processing capacity, pricing, and customer development. It can also help users explain their revenue logic clearly when presenting the farm’s growth plan to lenders, investors, advisors, or operating partners.
KPI Dashboard
The KPI dashboard section tracks the operating and financial performance indicators that matter most for a cattle farming business. Key performance indicators may include revenue growth, gross margin, EBITDA margin, cash balance, break-even timing, feed cost as a percentage of revenue, processing cost as a percentage of revenue, herd growth, mortality rate, average harvest weight, revenue per head, payroll burden, and funding gap. Inputs are drawn from the forecast assumptions and financial outputs, while the dashboard summarizes the results in a way that helps users monitor performance and compare actual or projected outcomes against expectations. This component is useful because cattle farming decisions are often operational, but their consequences are financial. A KPI dashboard helps users see whether the farm is improving productivity, controlling direct costs, scaling revenue efficiently, and moving toward sustainable profitability. It also supports investor updates, lender reporting, management reviews, and internal planning. By focusing attention on the metrics that drive results, the KPI dashboard helps users make more informed decisions about herd management, pricing, sales mix, staffing, and cash planning.
Startup Costs and CAPEX Planning
The startup costs and CAPEX planning section helps users estimate the initial investment required to launch or expand the cattle farming operation. This may include the initial breeding herd purchase, tractors, loaders, fencing, barns, shelters, water systems, feeding infrastructure, handling equipment, land preparation, lease deposits, permitting, initial veterinary setup, technology, and pre-opening working capital. Inputs may be organized by timing, category, amount, useful life, and whether the expense is a one-time startup cost, capital asset, or recurring operating cost. Outputs help calculate total funding required before and during launch, depreciation assumptions where relevant, cash flow impact, and the amount of capital needed before the farm becomes self-sustaining. This component is especially important for cattle farming because upfront spending can be large and cash inflows may be delayed while the herd matures. A detailed CAPEX plan helps users avoid underestimating launch costs, prepare a more realistic funding strategy, and explain to lenders or investors how capital will be used. It also supports decision-making around buying versus leasing equipment, phasing facility investments, and timing herd expansion.
Break-Even and Funding Requirements Analysis
The break-even and funding requirements analysis section helps users identify when the cattle farming business may become profitable and how much capital may be needed to reach that point. This component brings together revenue growth, cost of goods sold, operating expenses, payroll, capital expenditures, debt service, and cash flow timing to show the period when the business crosses into sustainable profitability. Inputs may include fixed costs, variable costs, gross margins, herd growth assumptions, product pricing, sales channel mix, financing terms, and opening cash balance. Outputs may include break-even month, cumulative cash shortfall, minimum cash position, required startup funding, and the amount of working capital needed to cover operating losses before the farm stabilizes. This is useful because cattle farming can require patience, especially when the business is retaining animals for grow-out, building a breeding base, or developing higher-margin direct sales channels. Understanding the funding gap helps users plan debt, equity, grants, owner contributions, or staged investment more carefully. It also strengthens business plans and investor presentations by showing exactly how the operation expects to bridge the period between initial investment and positive cash generation.
File types:
Excel – Single-User: .xlsx
Excel – Multi-User: .xlsx
Similar ProductsOther customers were also interested in...
 HenrySheykin
Hydroponics Financial Model Excel Template
The Hydroponic Farming Financial Model helps entrepreneurs, growers, consultants, analysts, and busi... Read more
Hemp Farming Financial Model Excel Template
The Hemp Farming Financial Model Template helps entrepreneurs, farm owners, consultants, analysts, a... Read more
Dairy Farming Financial Model Excel Template
Purchase Dairy Farming Financial Projection. Sources & Uses, Profit & Loss, Cash Flow statem... Read more
Aquaponics Financial Model Excel Template
The Commercial Aquaponics Financial Model helps users turn a capital-intensive aquaponics concept in... Read more
Sheep Farming Financial Model Excel Template
The Sheep Farming Financial Model helps entrepreneurs, farm owners, consultants, analysts, and busin... Read more
Garden Nursery Financial Model Excel Template
The Garden Nursery Financial Model helps entrepreneurs, nursery owners, consultants, analysts, and b... Read more
Horse Boarding Financial Model Excel Template
The Horse Boarding Financial Model helps turn a stable, equestrian center, or horse boarding concept... Read more
Garlic Farming Financial Model Excel Template
The Garlic Farming Financial Model helps entrepreneurs, growers, consultants, analysts, and business... Read more
Plant Nursery Financial Model Template
The Plant Nursery Financial Model helps entrepreneurs, nursery owners, consultants, analysts, and bu... Read more
Cow-Calf Operation Financial Model Excel Template
The Cow-Calf Operation Financial Model helps ranch owners, agricultural entrepreneurs, consultants, ... Read more
 Cattle Farming