
0 ITEMS

Cap Tables & Investor Returns Model
Cap Table and VC Returns Excel template covering funding rounds, dilution, ownership, preferred shares, exit proceeds, IRR and investor returns.

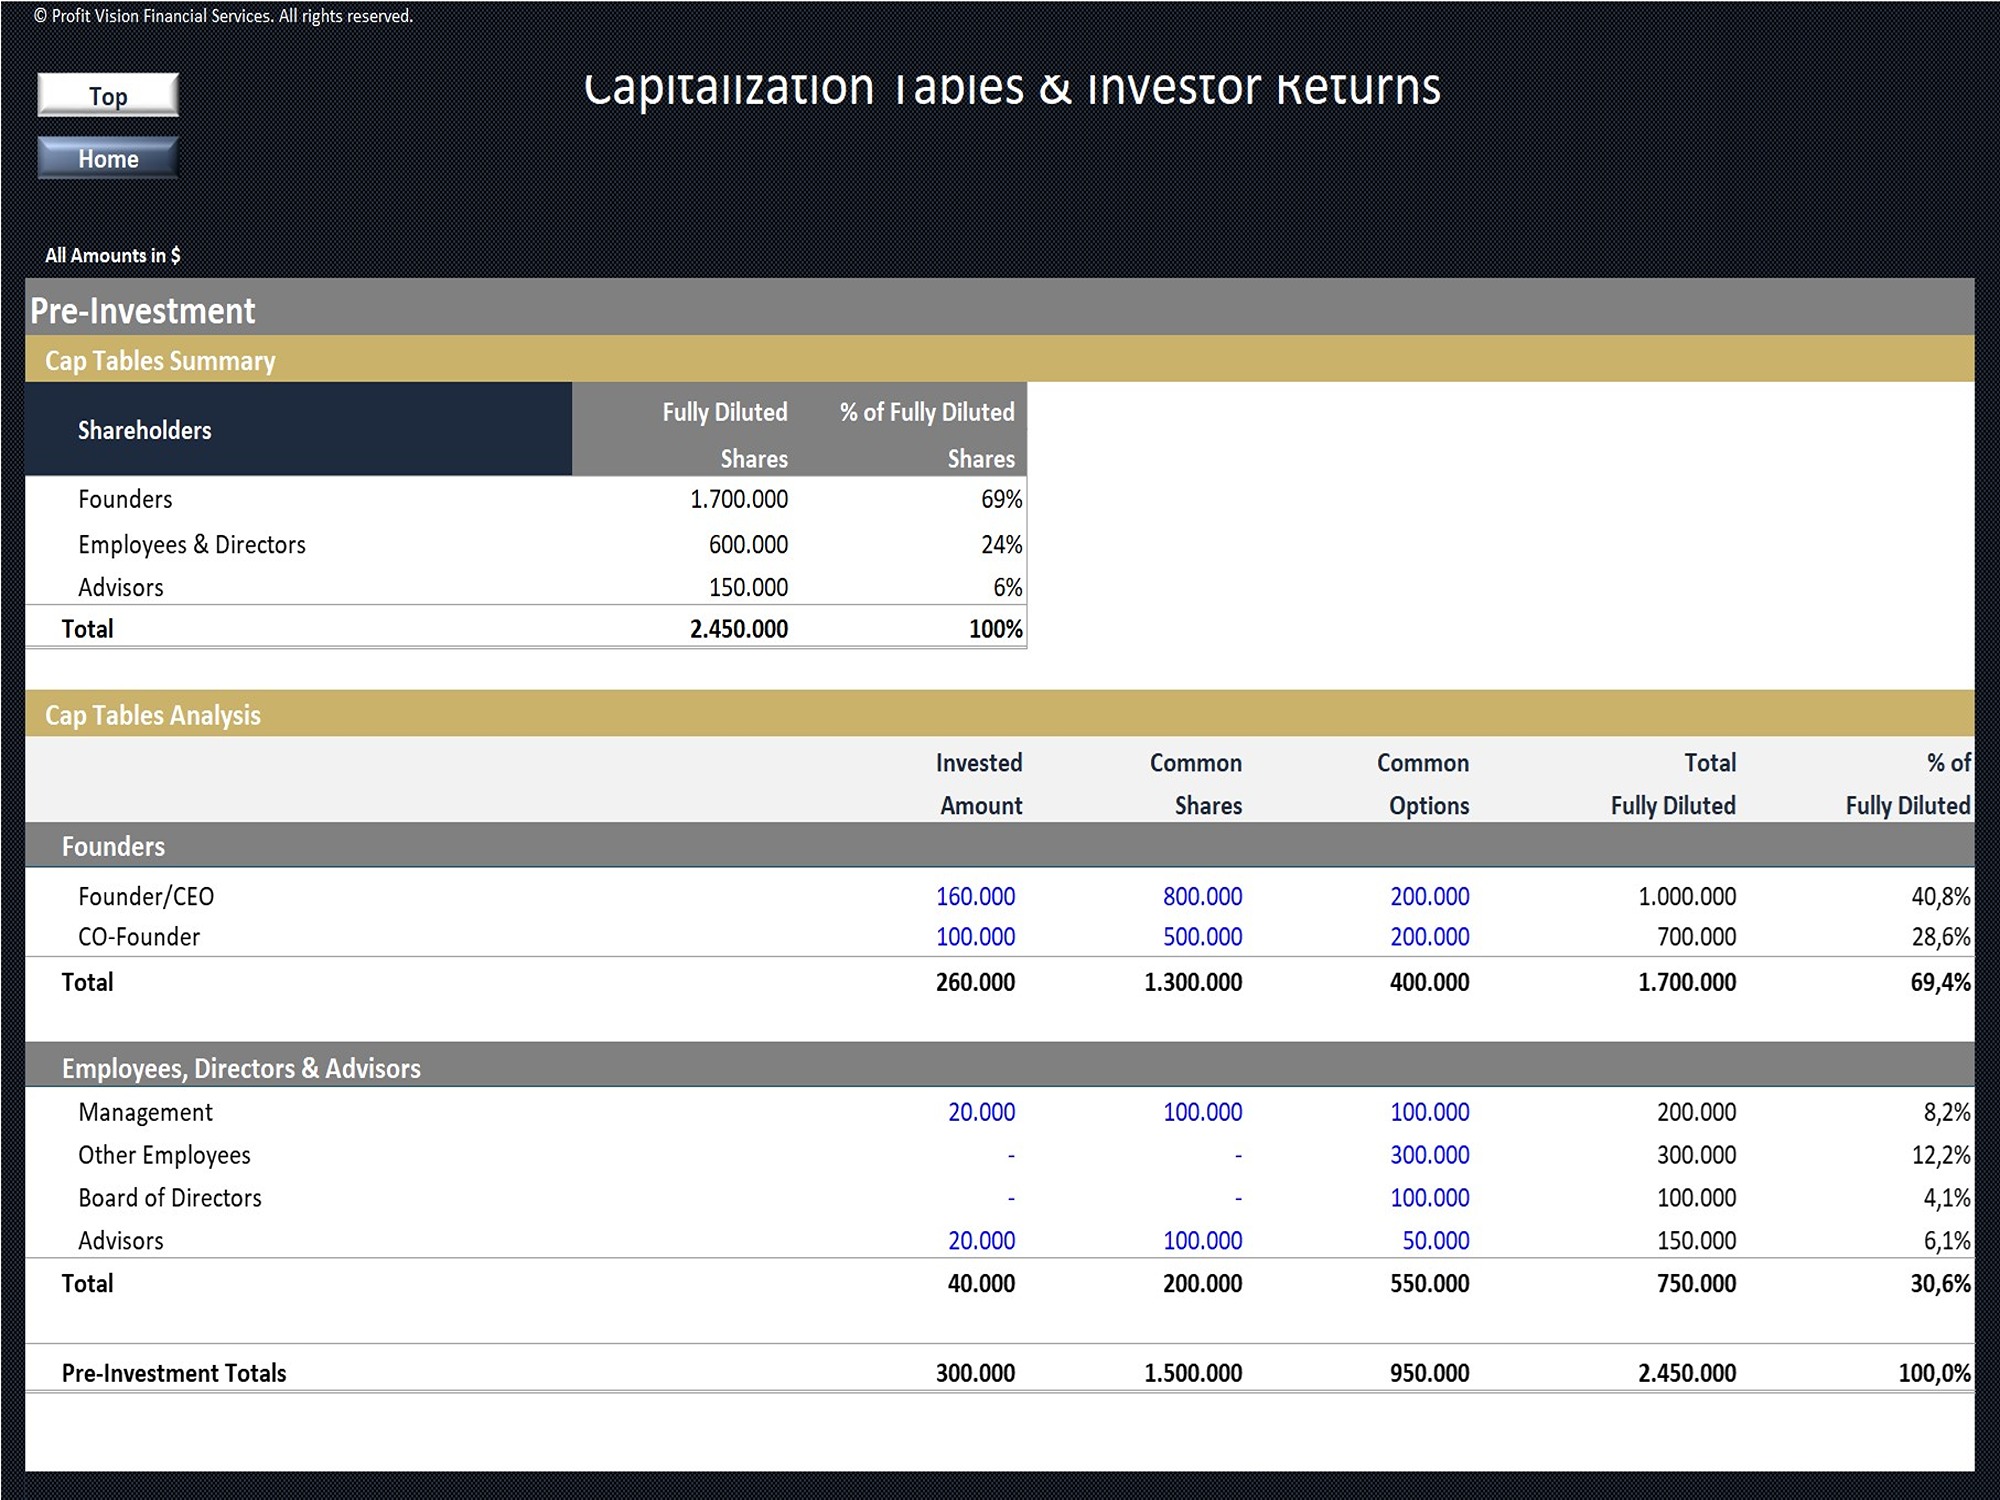
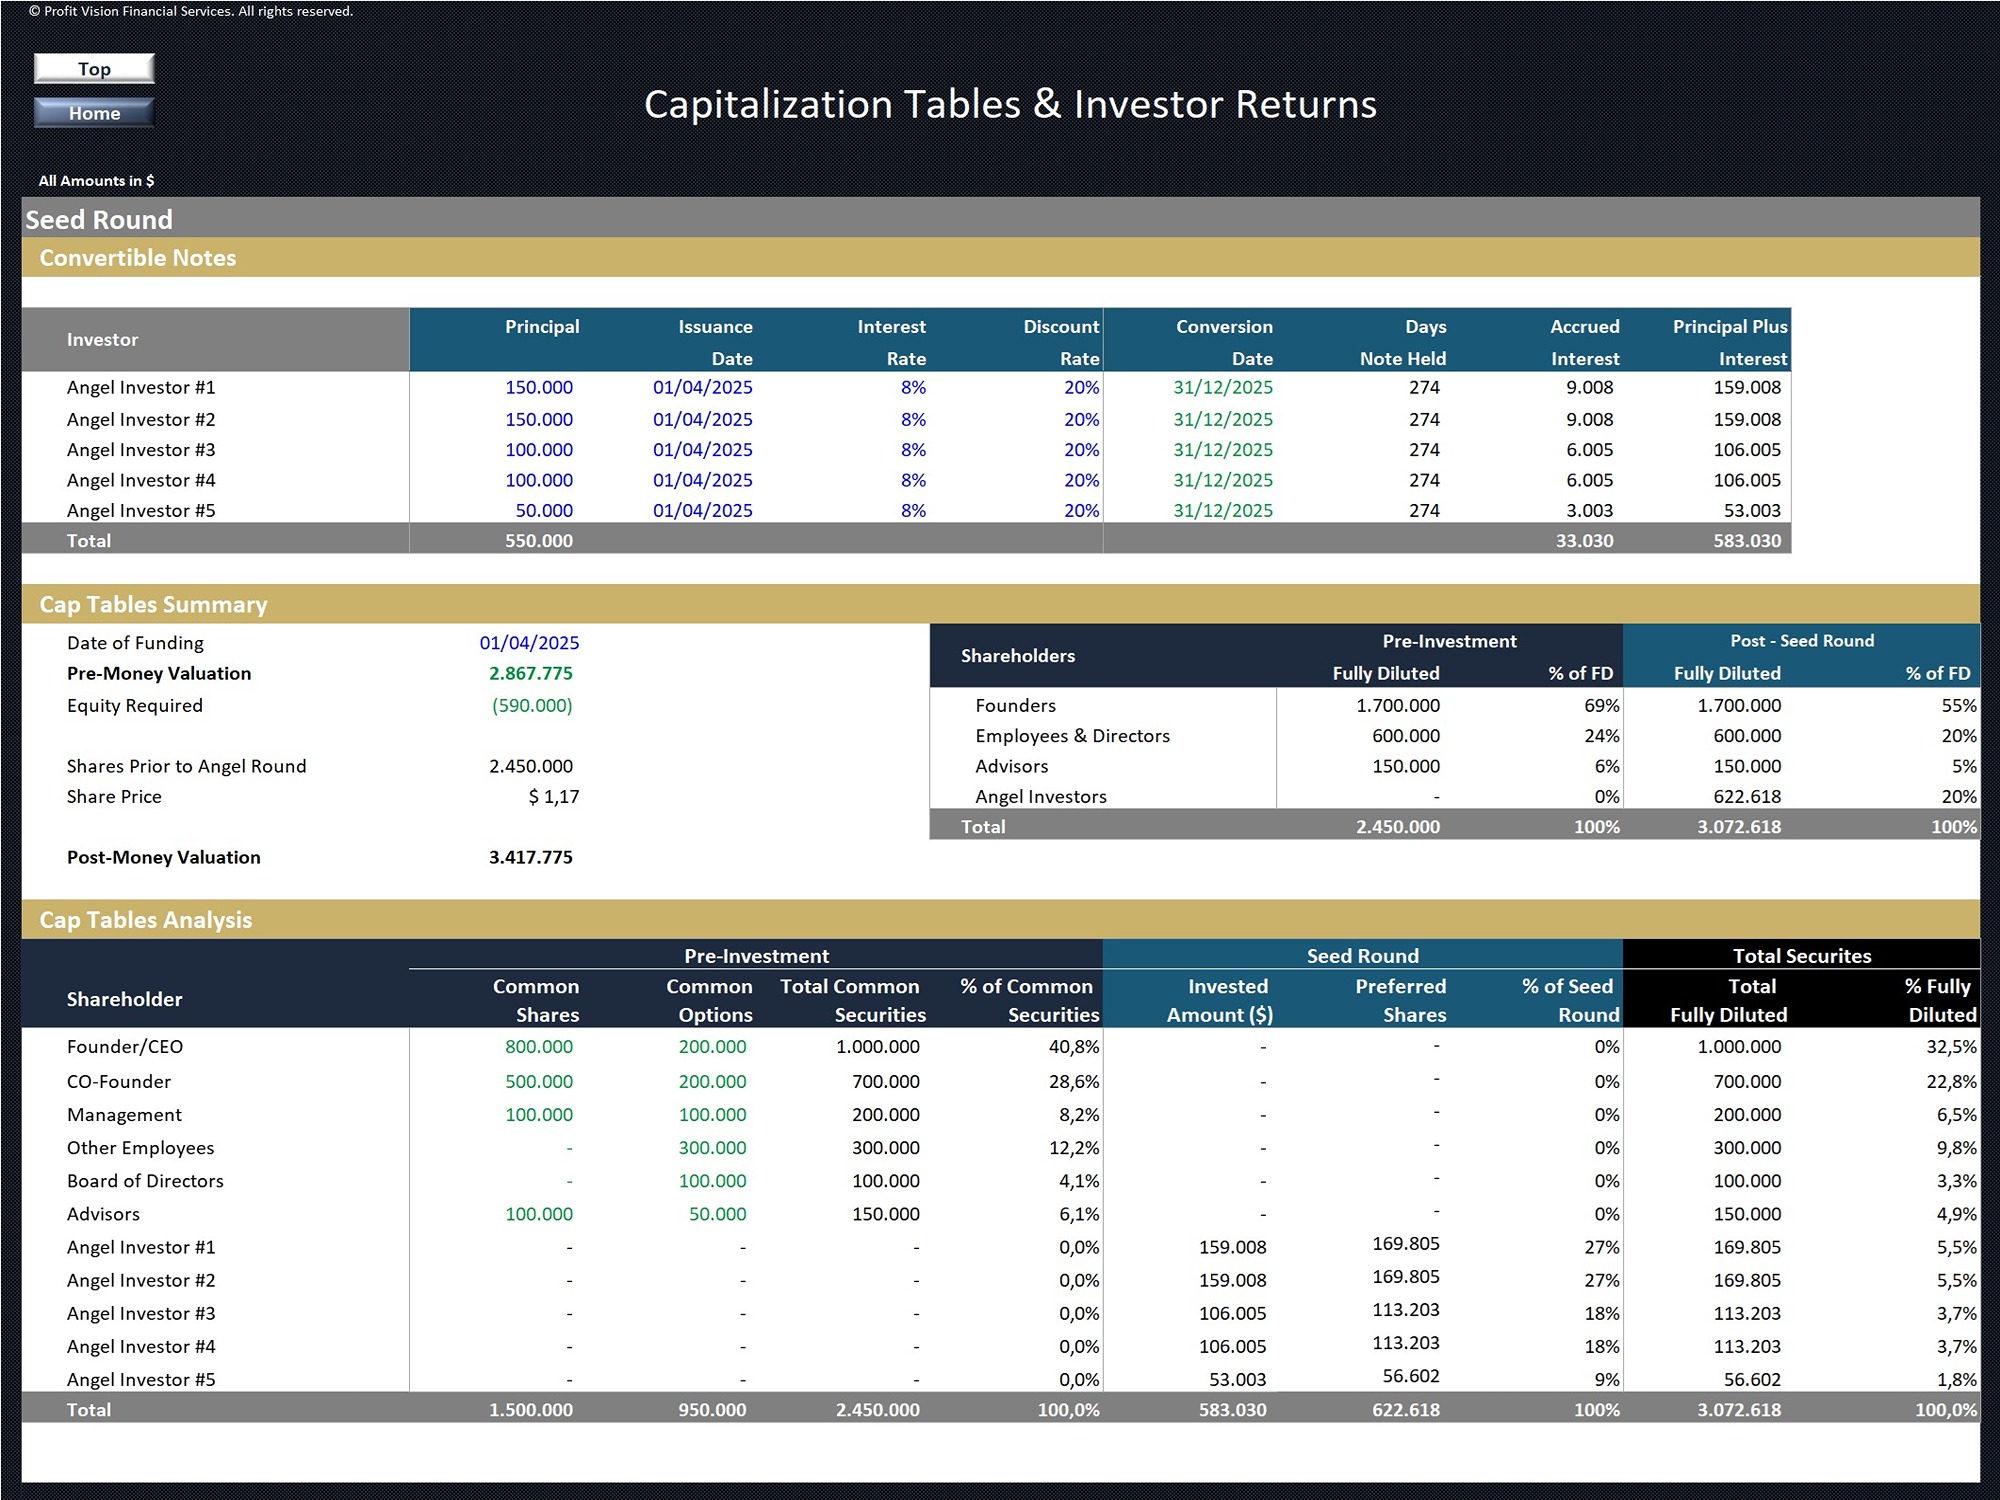
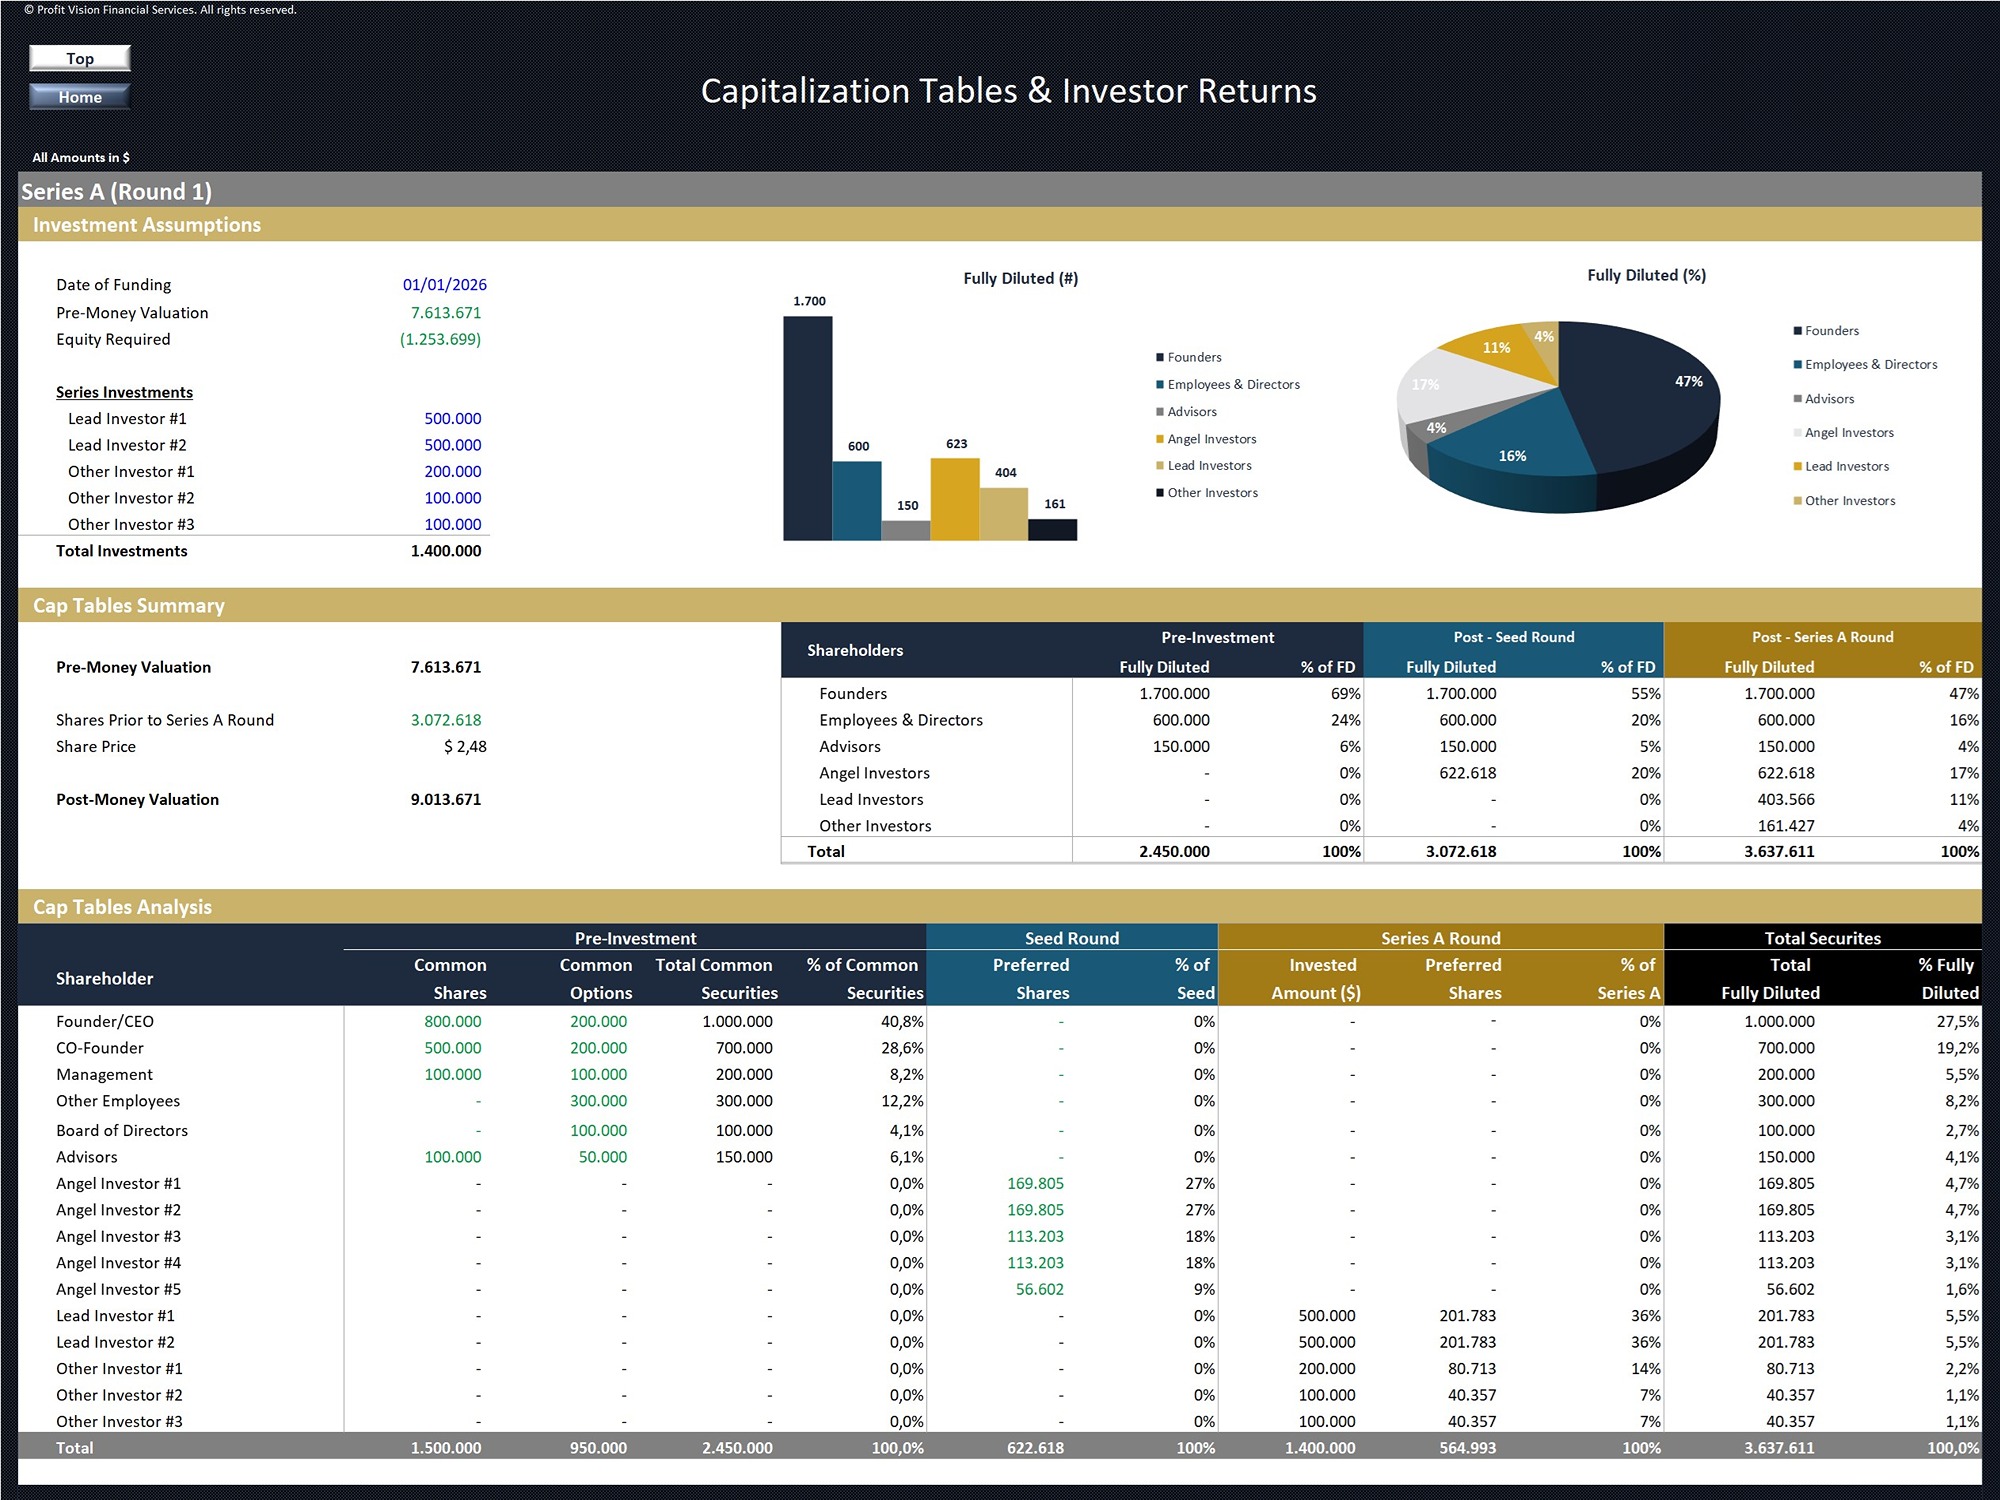
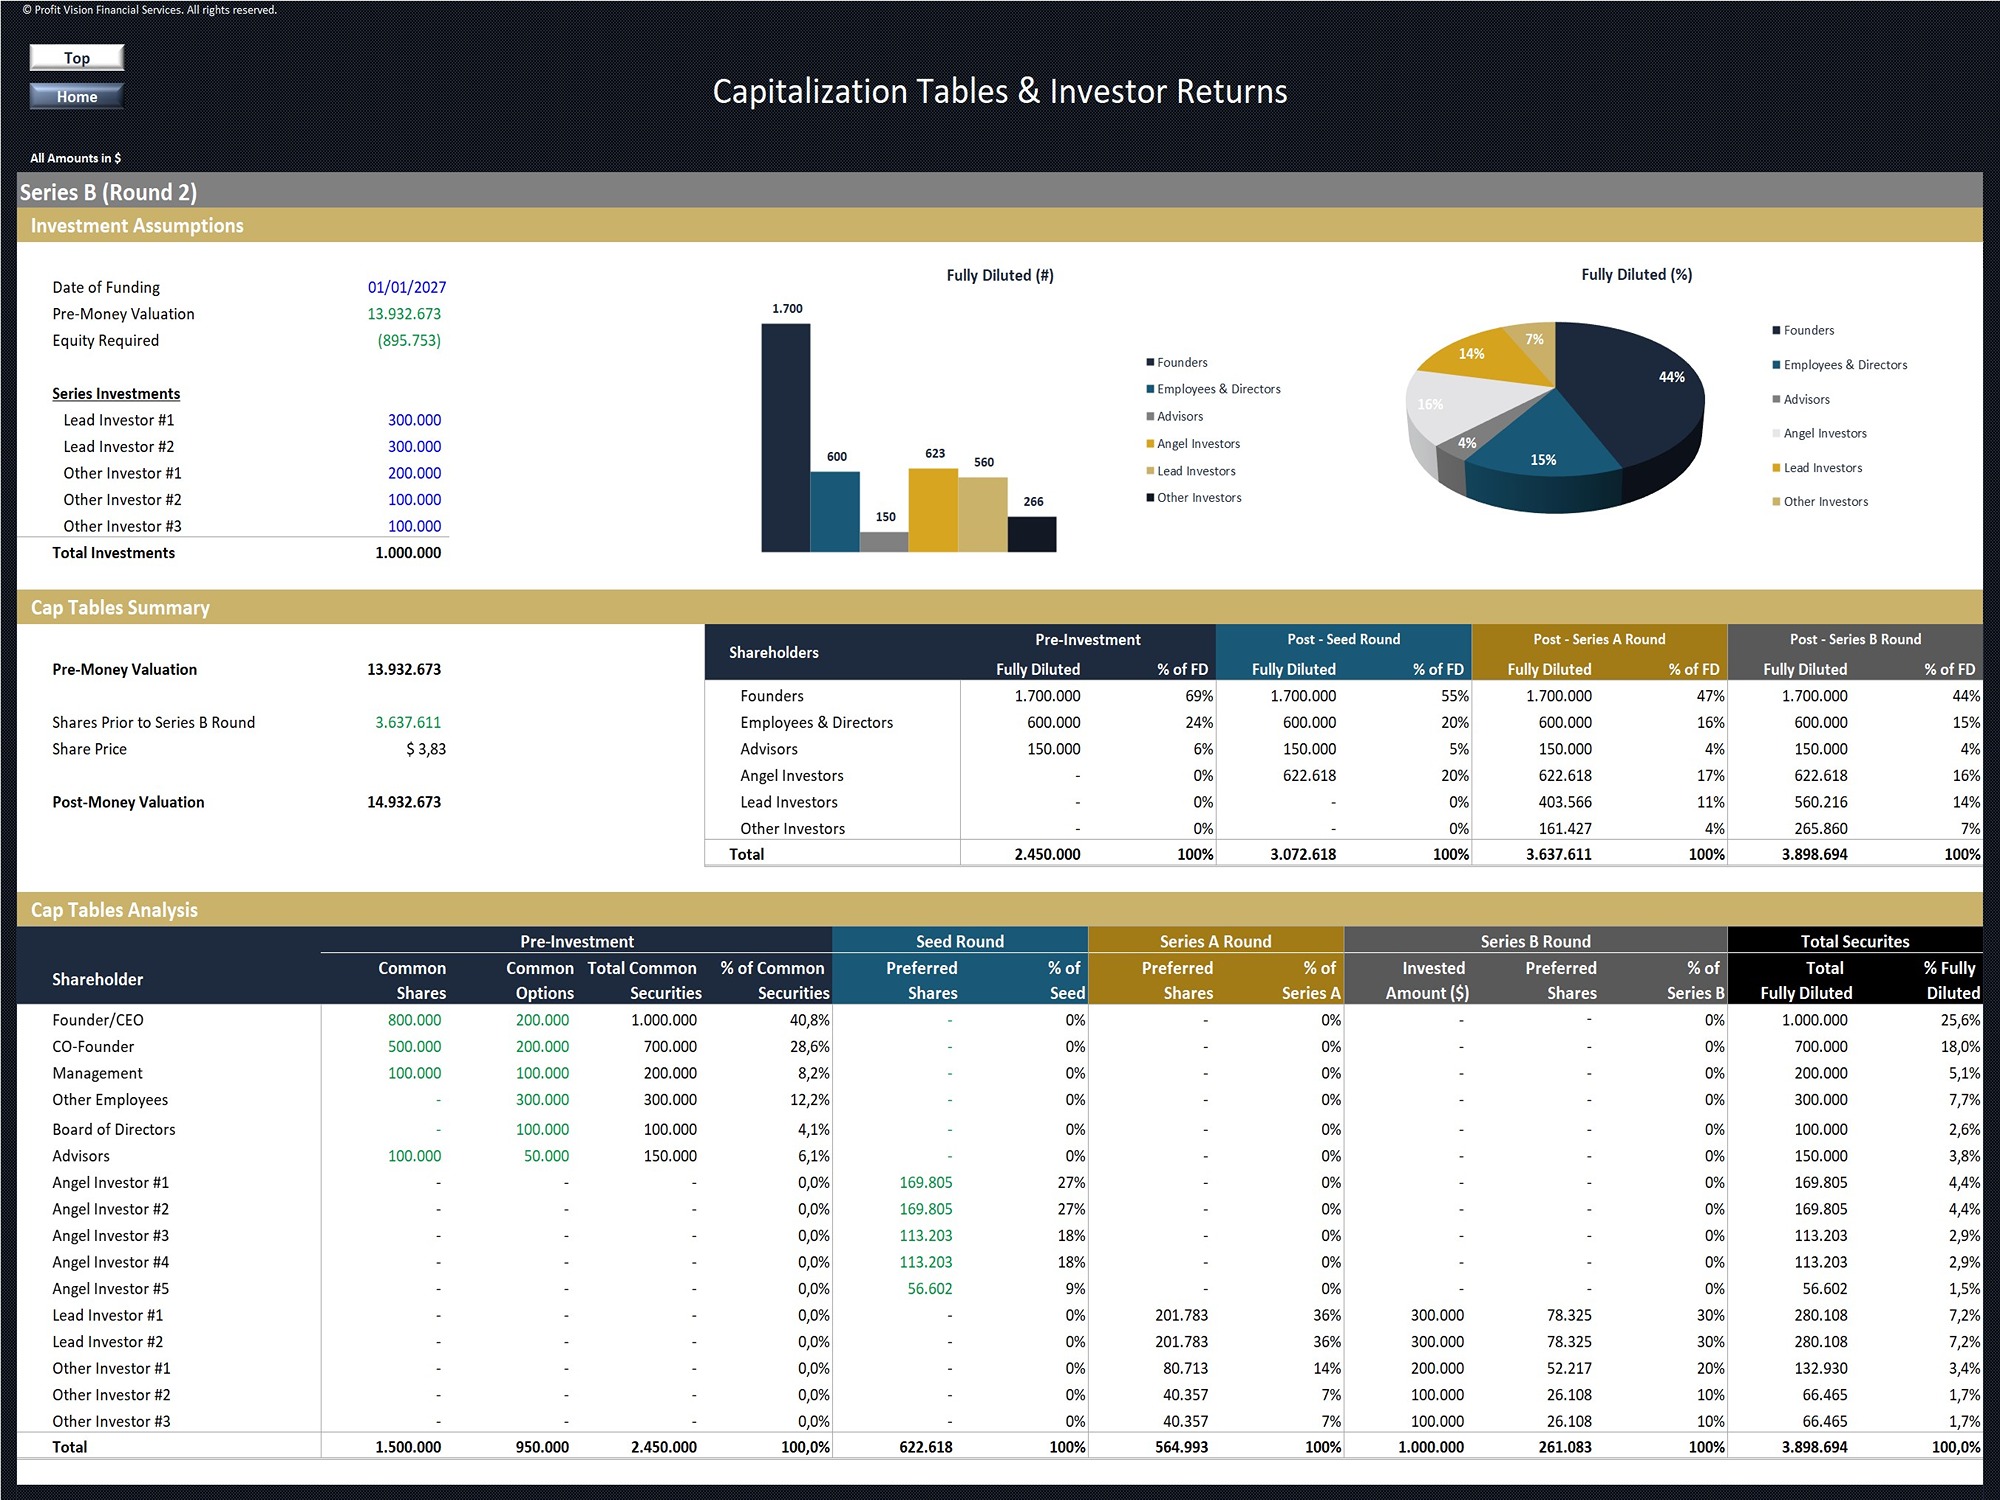
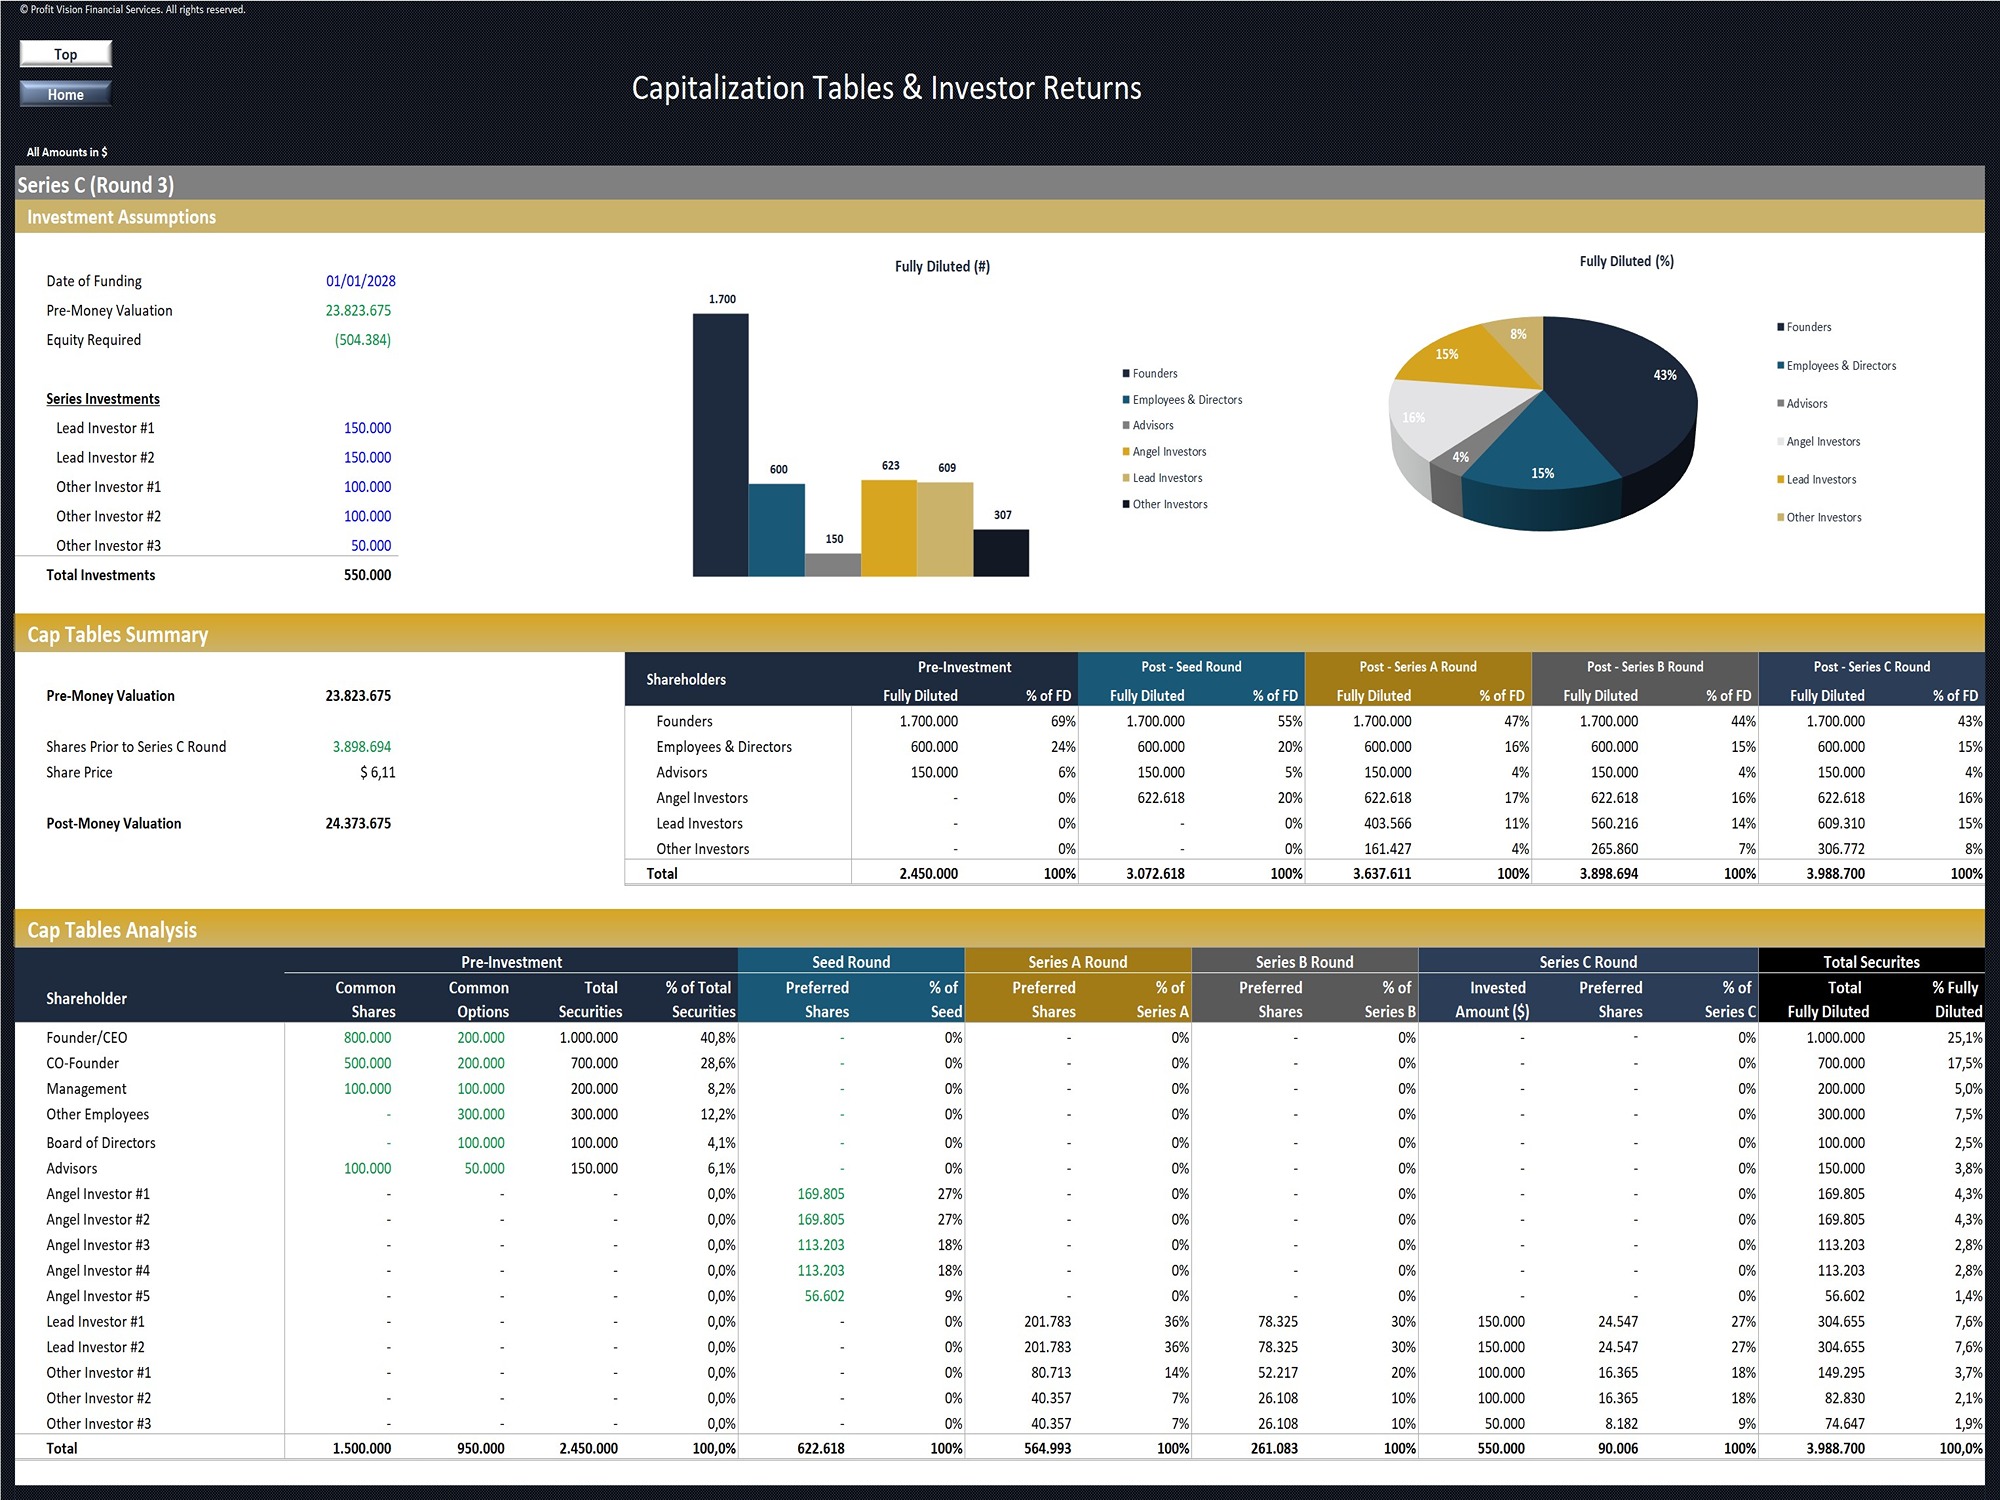
A Capitalization Table, or Cap Table, is a detailed record of a company’s ownership structure showing the securities held by founders, employees, advisors and investors. It tracks common shares, options, preferred shares and other equity instruments and is used to understand ownership percentages, dilution and changes in shareholder economics as the company raises additional financing rounds.
This Capitalization Tables & Venture Capital Returns Template provides a comprehensive framework for modeling a startup’s ownership structure from the pre-investment stage through multiple venture capital financing rounds and eventual exit.
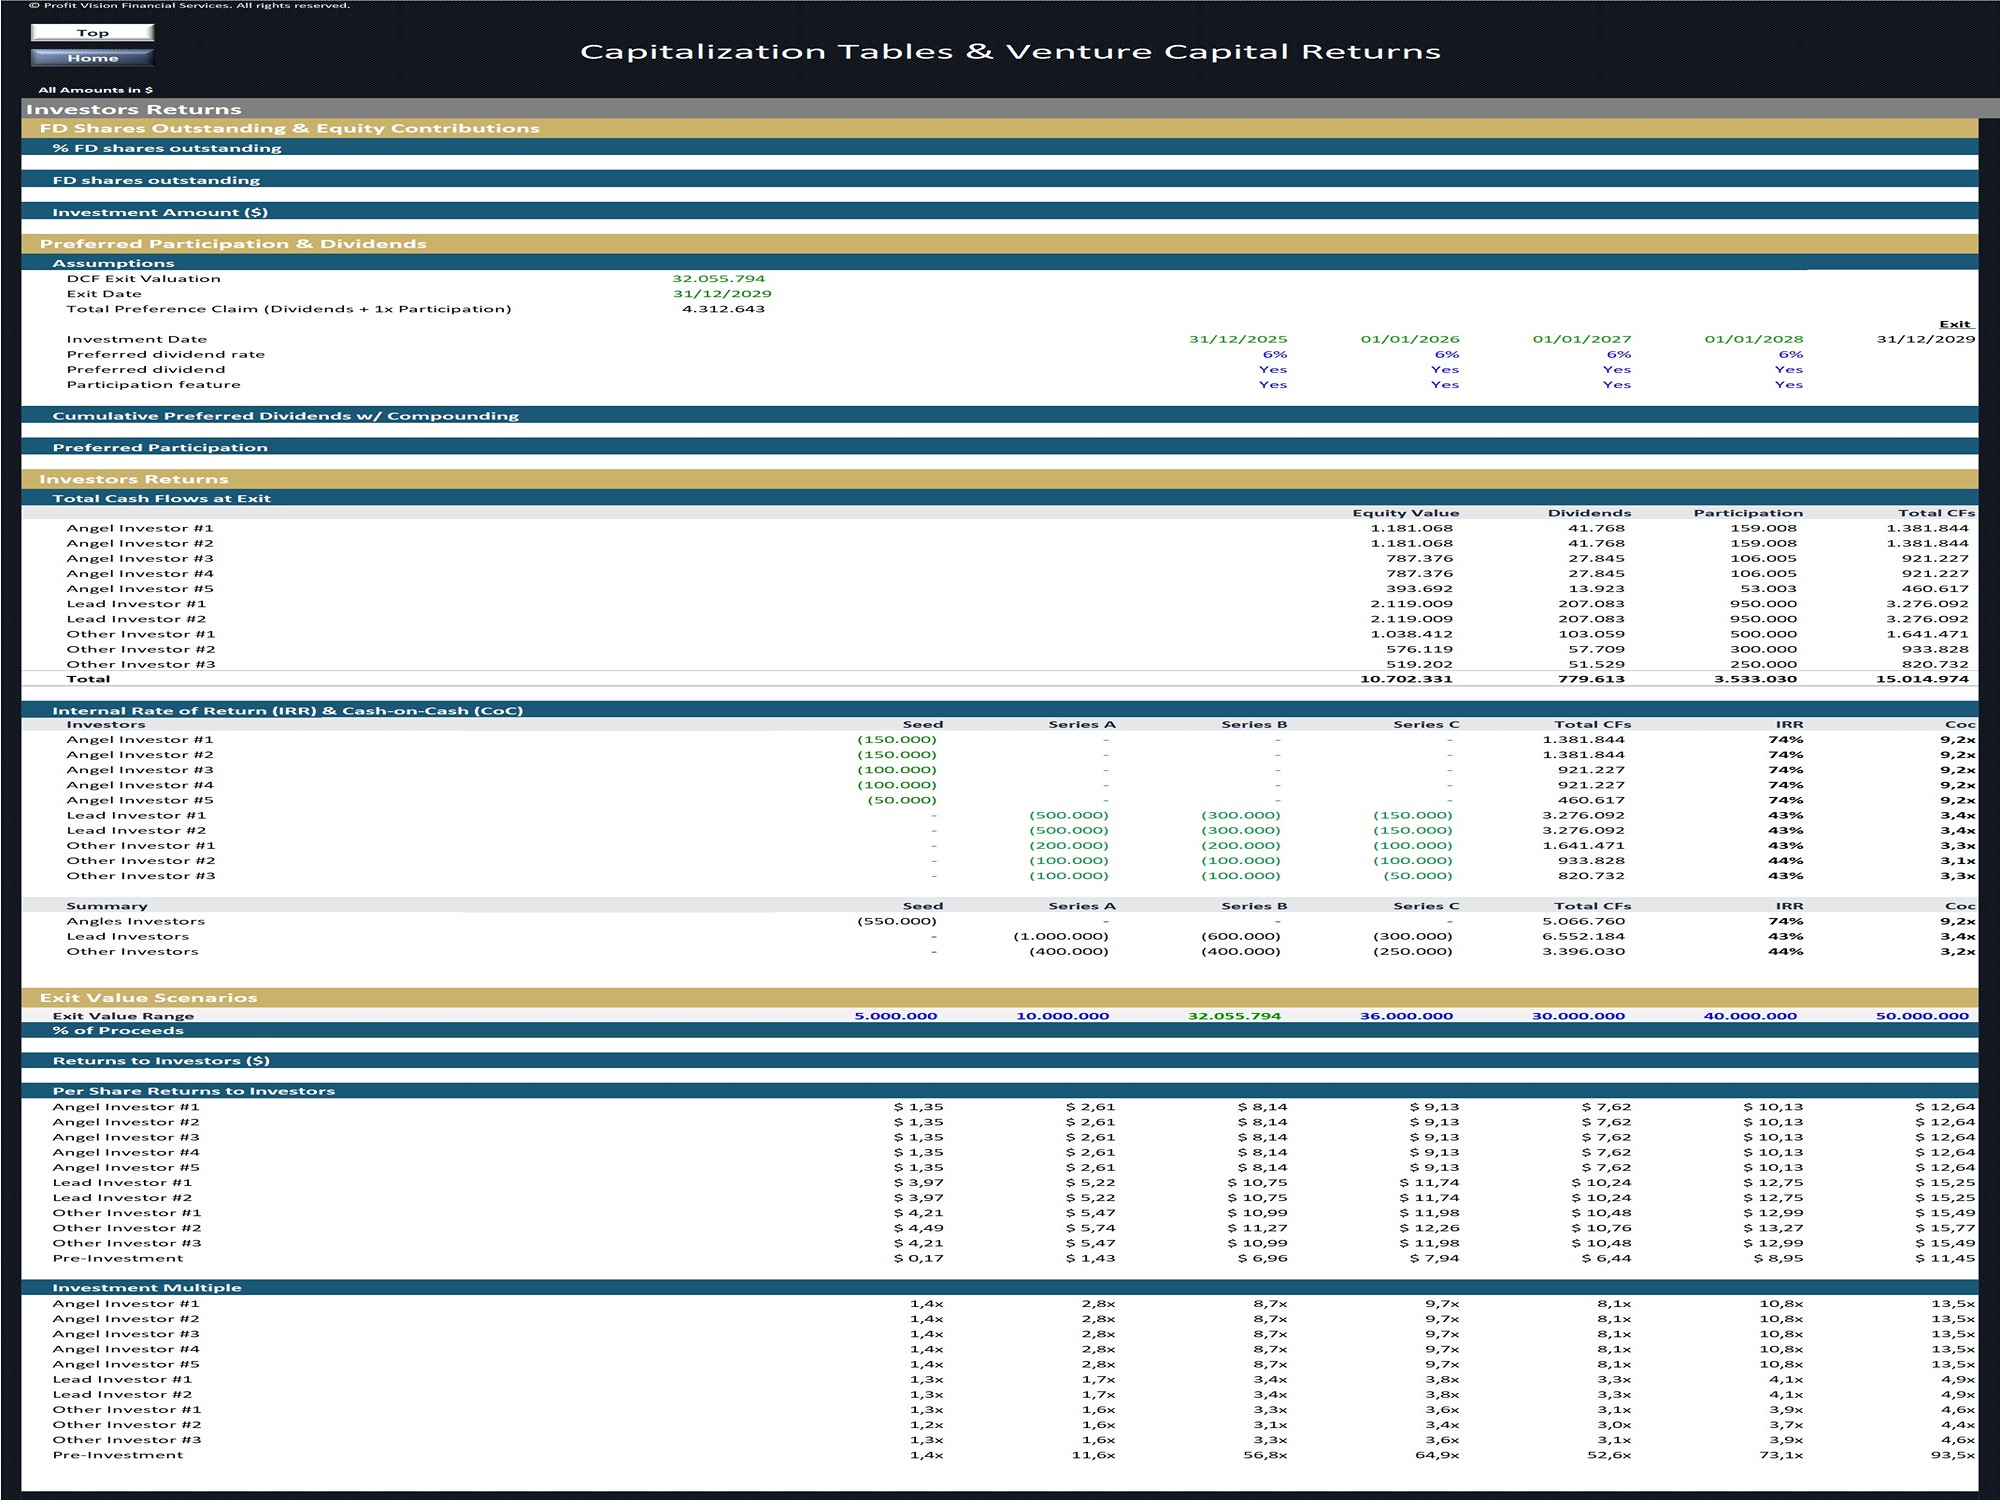
The template tracks founders, employees, advisors, angel investors and institutional investors across Seed, Series A, Series B and Series C financings. It calculates pre- and post-money valuations, share prices, new preferred shares issued, fully diluted ownership and dilution after each round. The workbook also incorporates company financial projections and DCF-based valuation, convertible note conversion at the Seed stage, preferred dividends and participation rights, and investor-level exit proceeds, IRR and cash-on-cash returns under different exit scenarios.
Template Structure
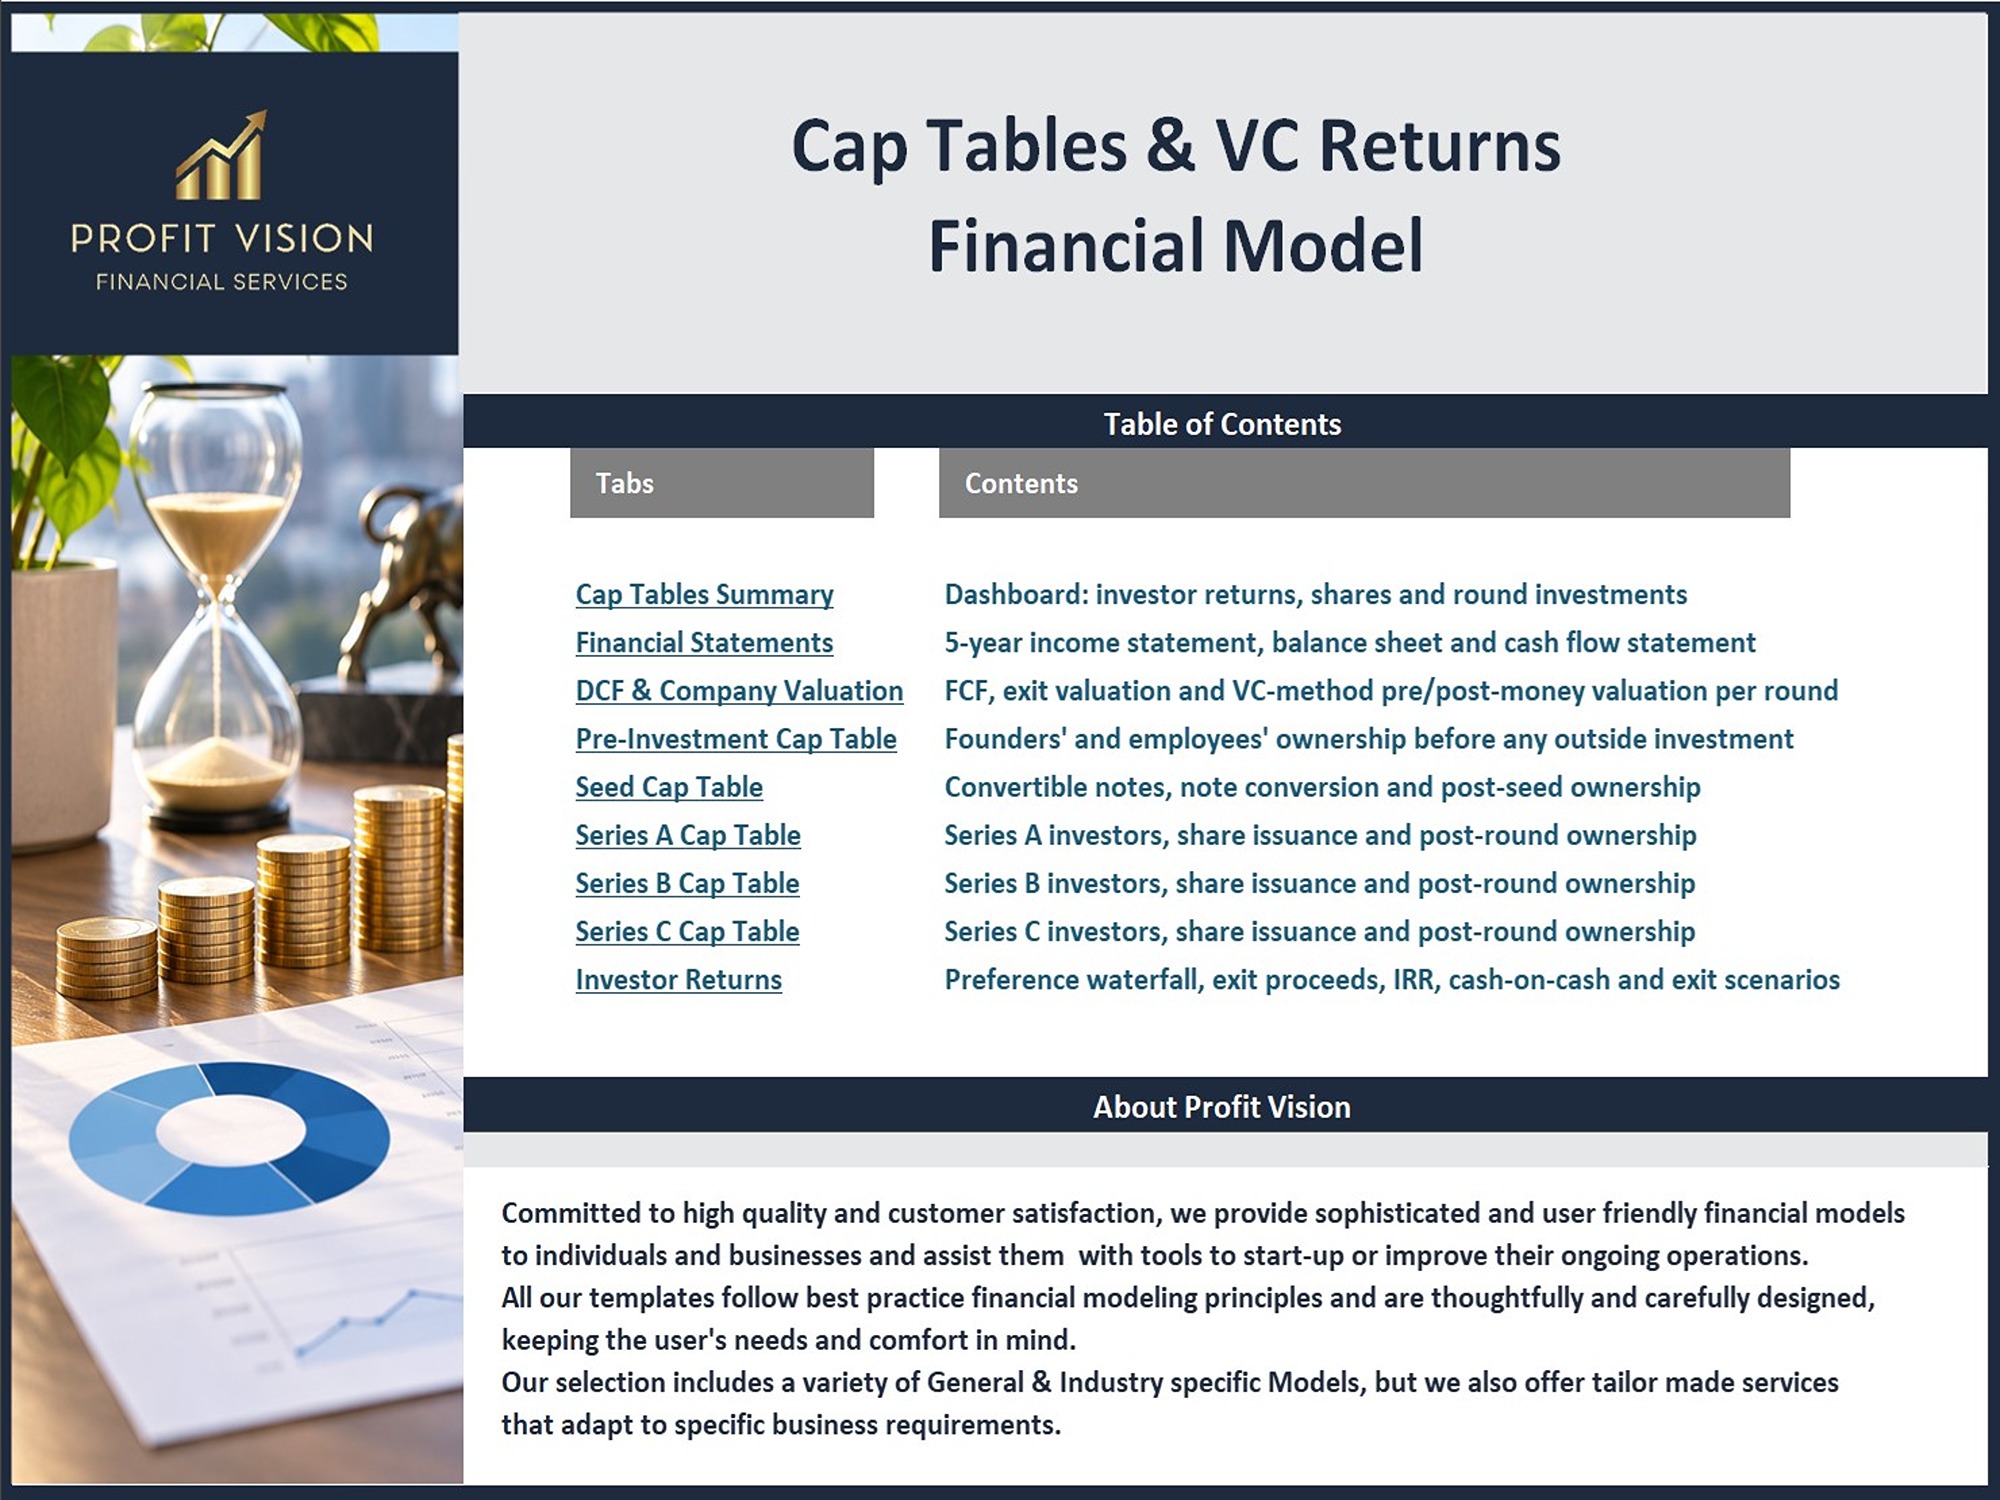
• Cap Tables Summary
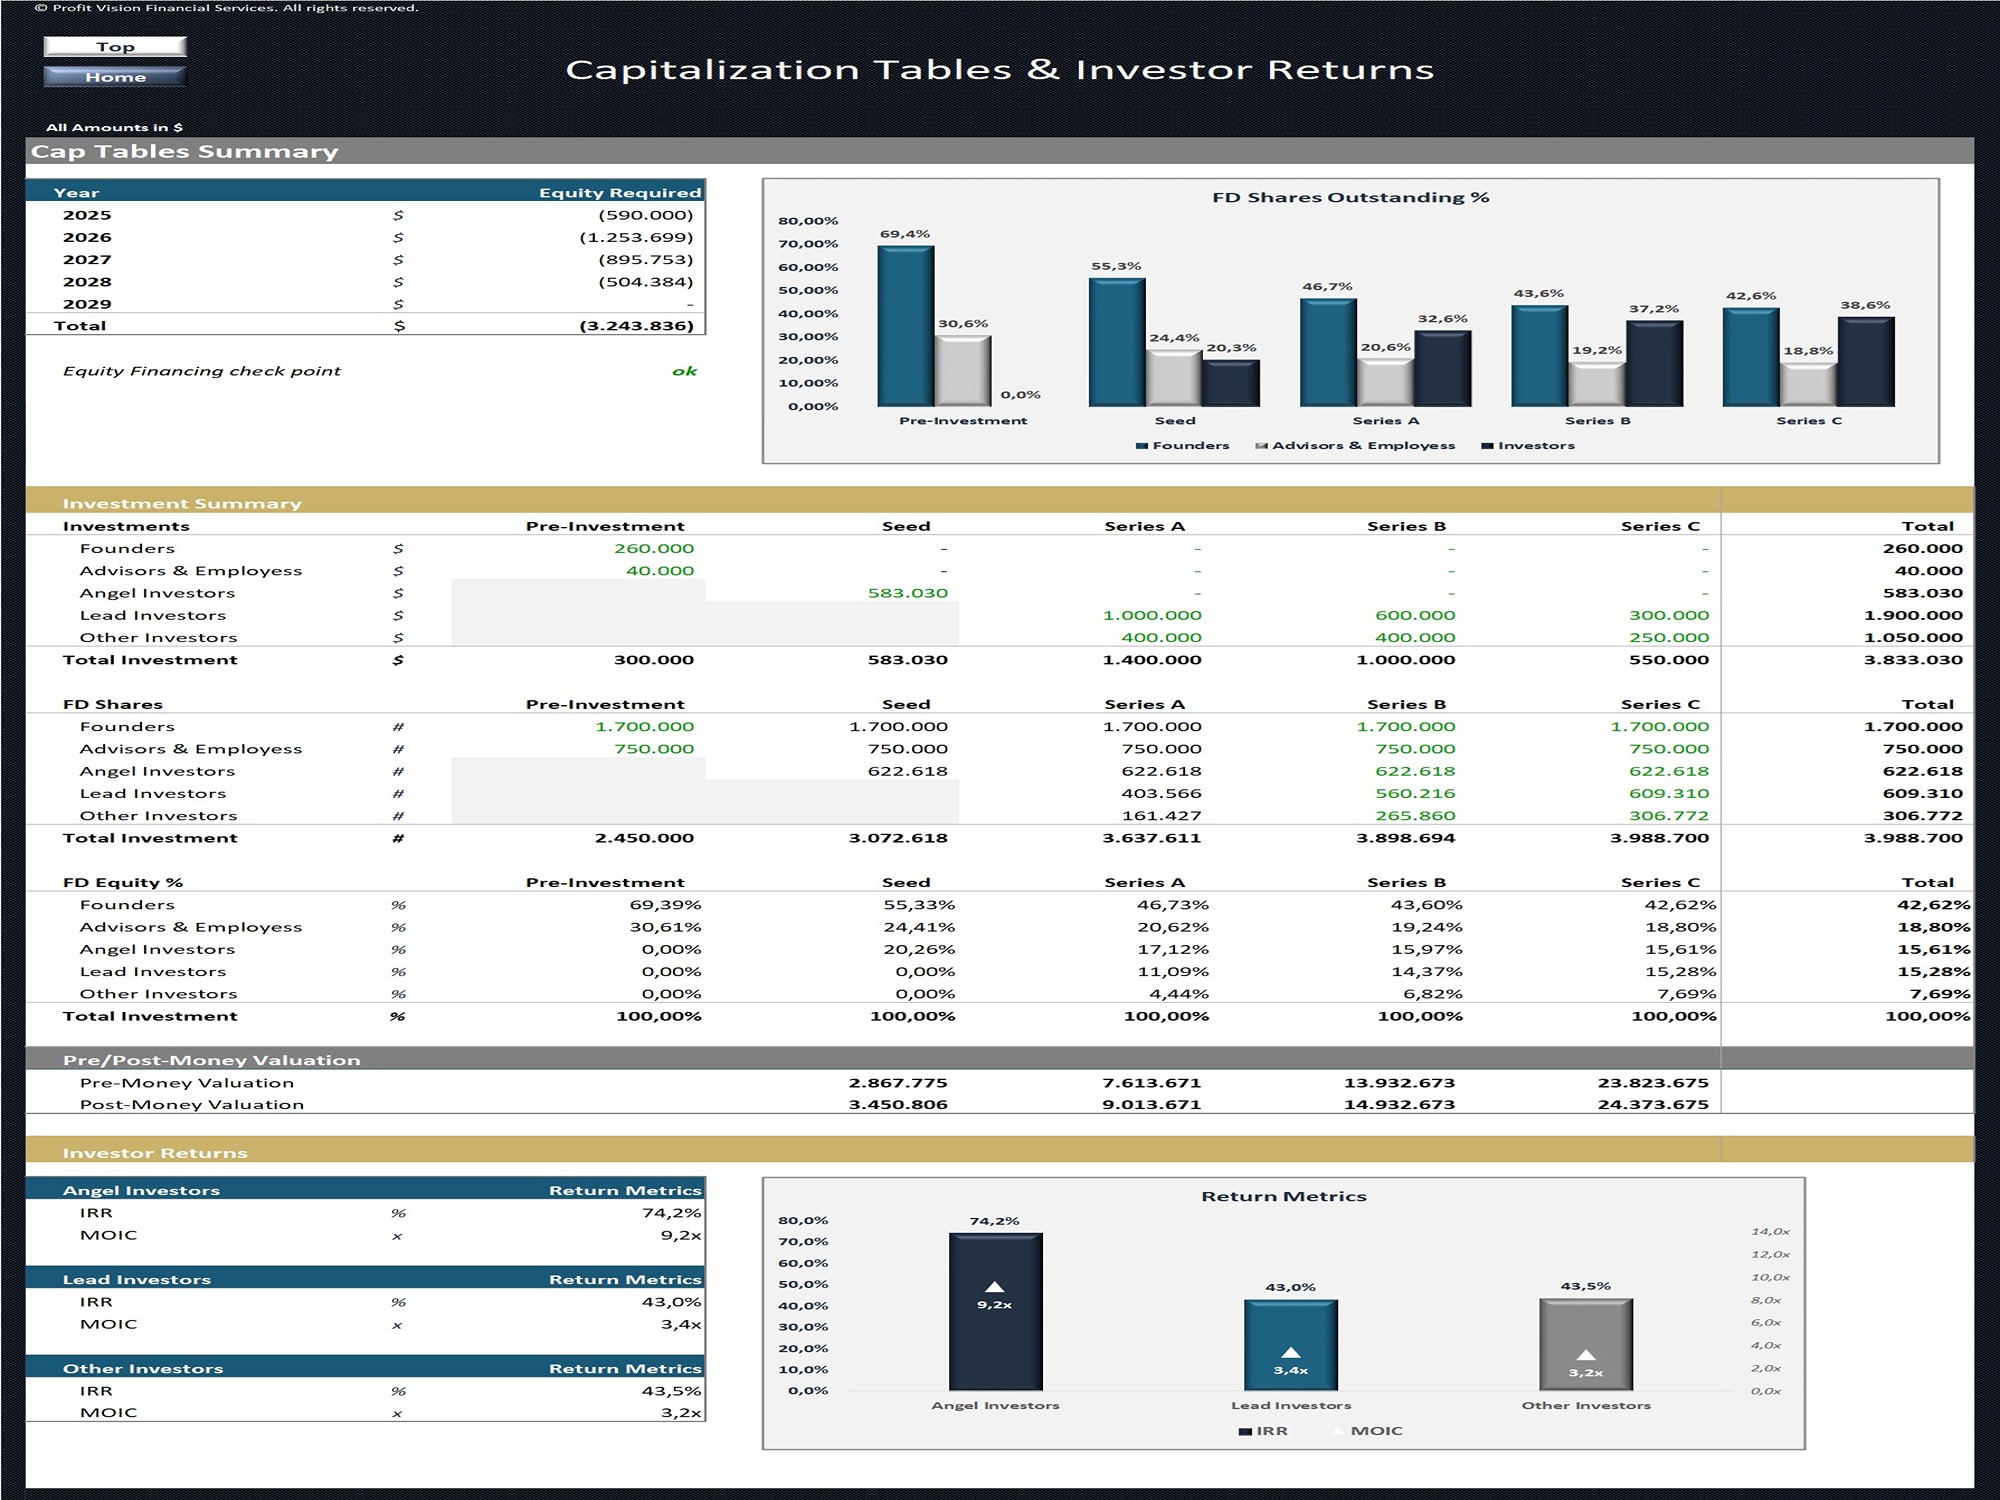
Consolidated dashboard summarizing the evolution of the company’s capitalization across all financing rounds. The section presents investment amounts, shares issued, fully diluted ownership and investor positions from the pre-investment stage through Series C, providing a clear view of how ownership changes and dilution develops over time.
• Financial Statements
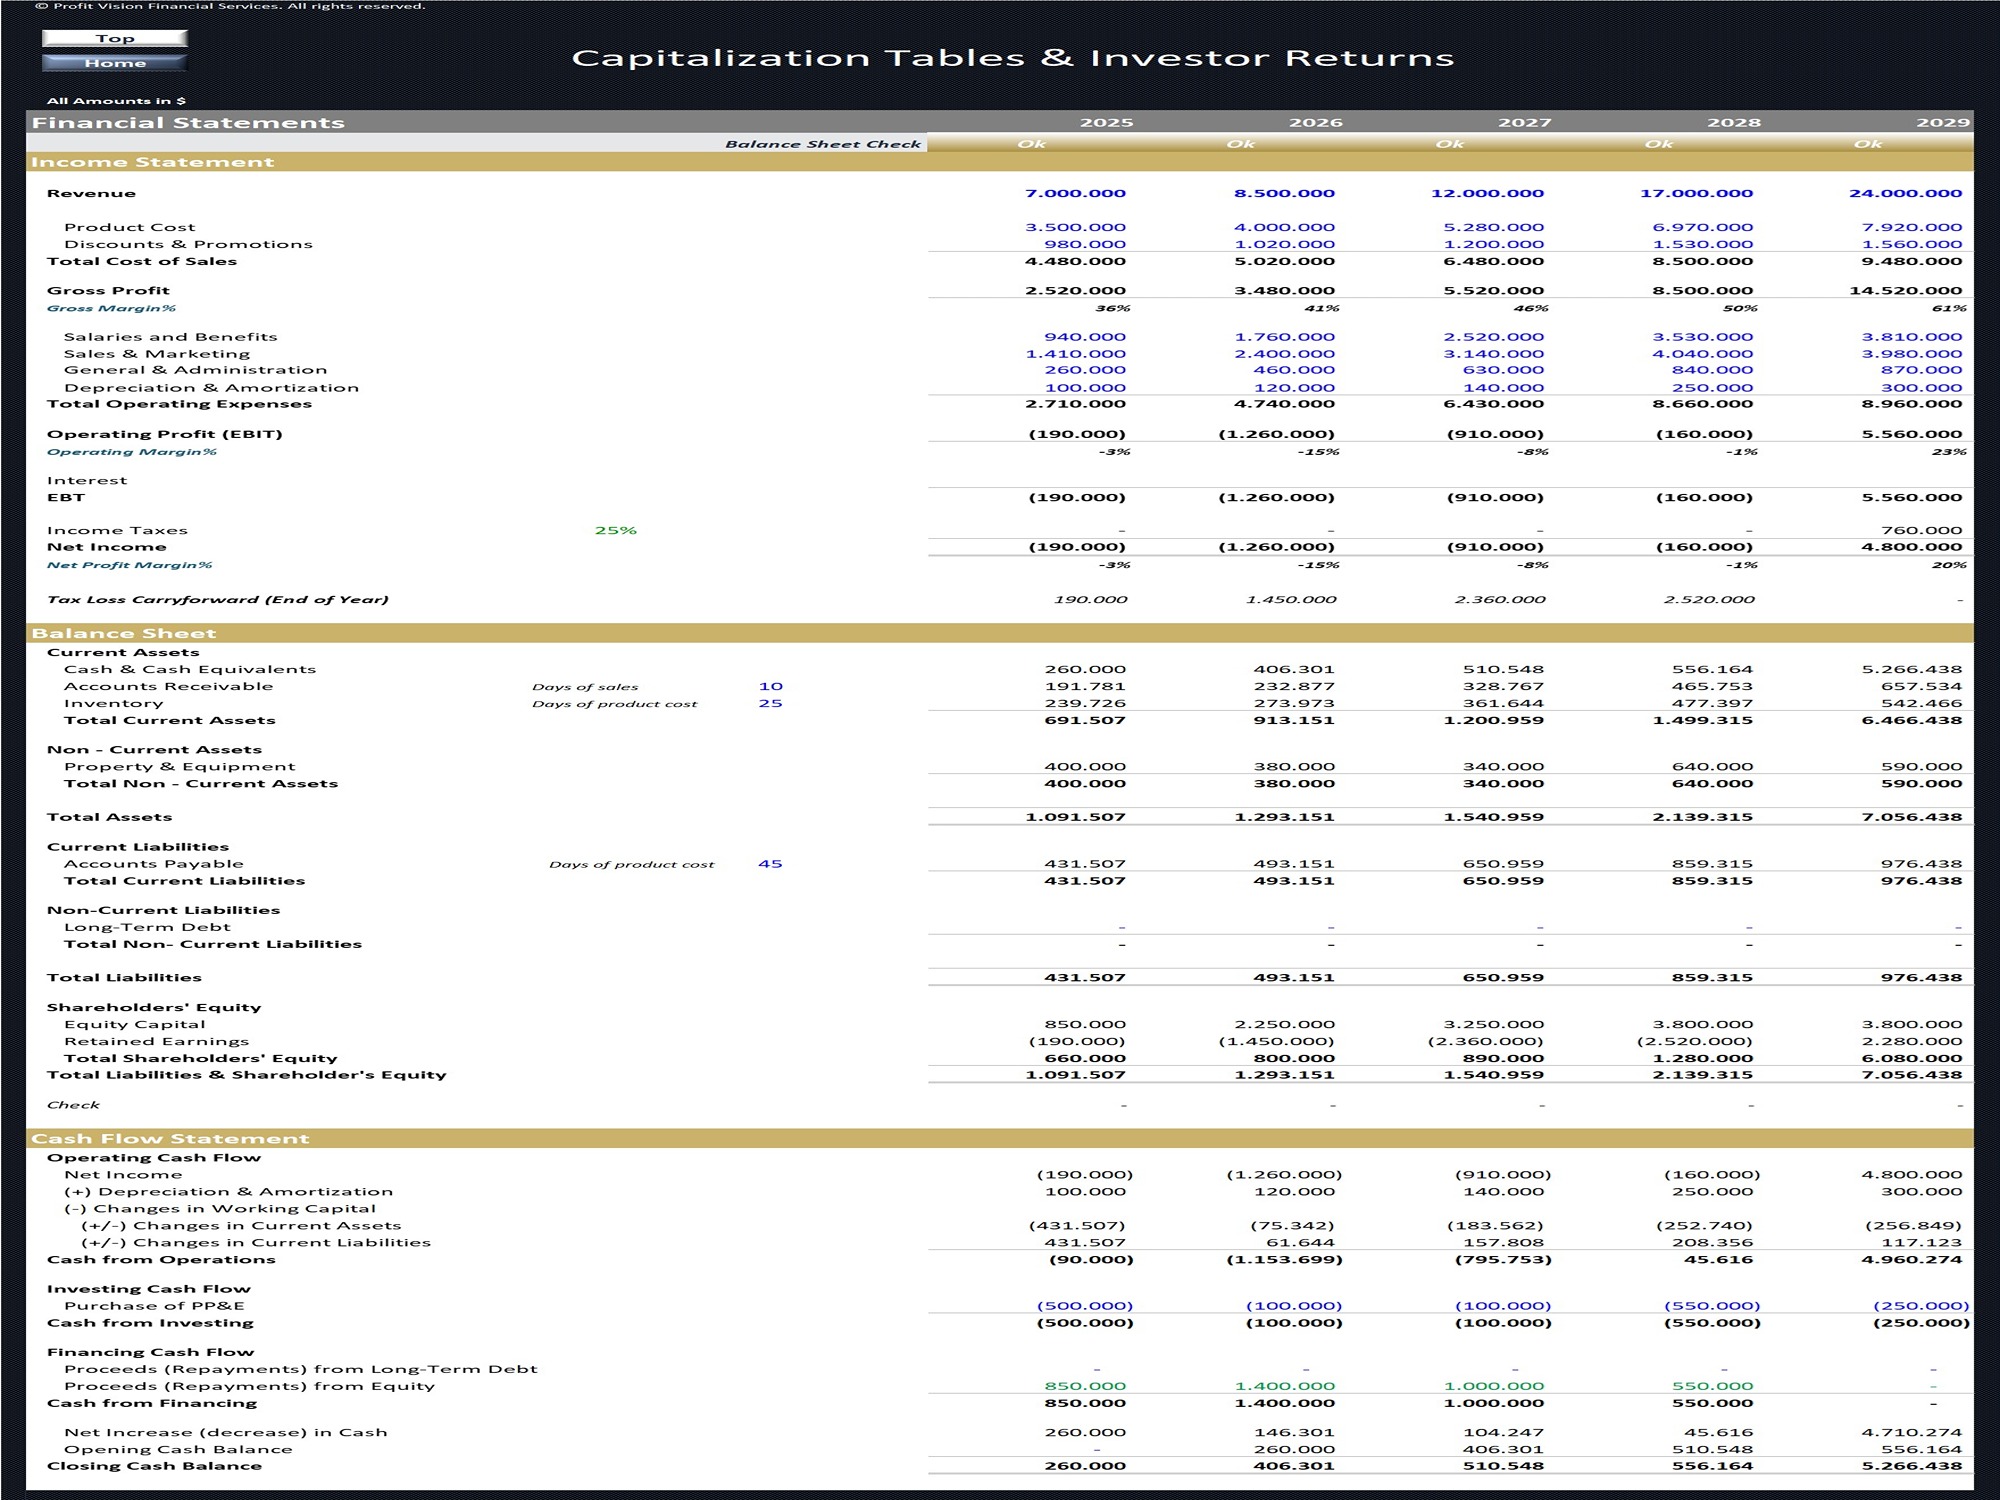
Integrated financial forecast supporting the company’s valuation and financing requirements. The section includes projected Income Statement, Balance Sheet and Cash Flow Statement information used to assess future performance, cash requirements and capital needs.
• DCF & Company Valuation
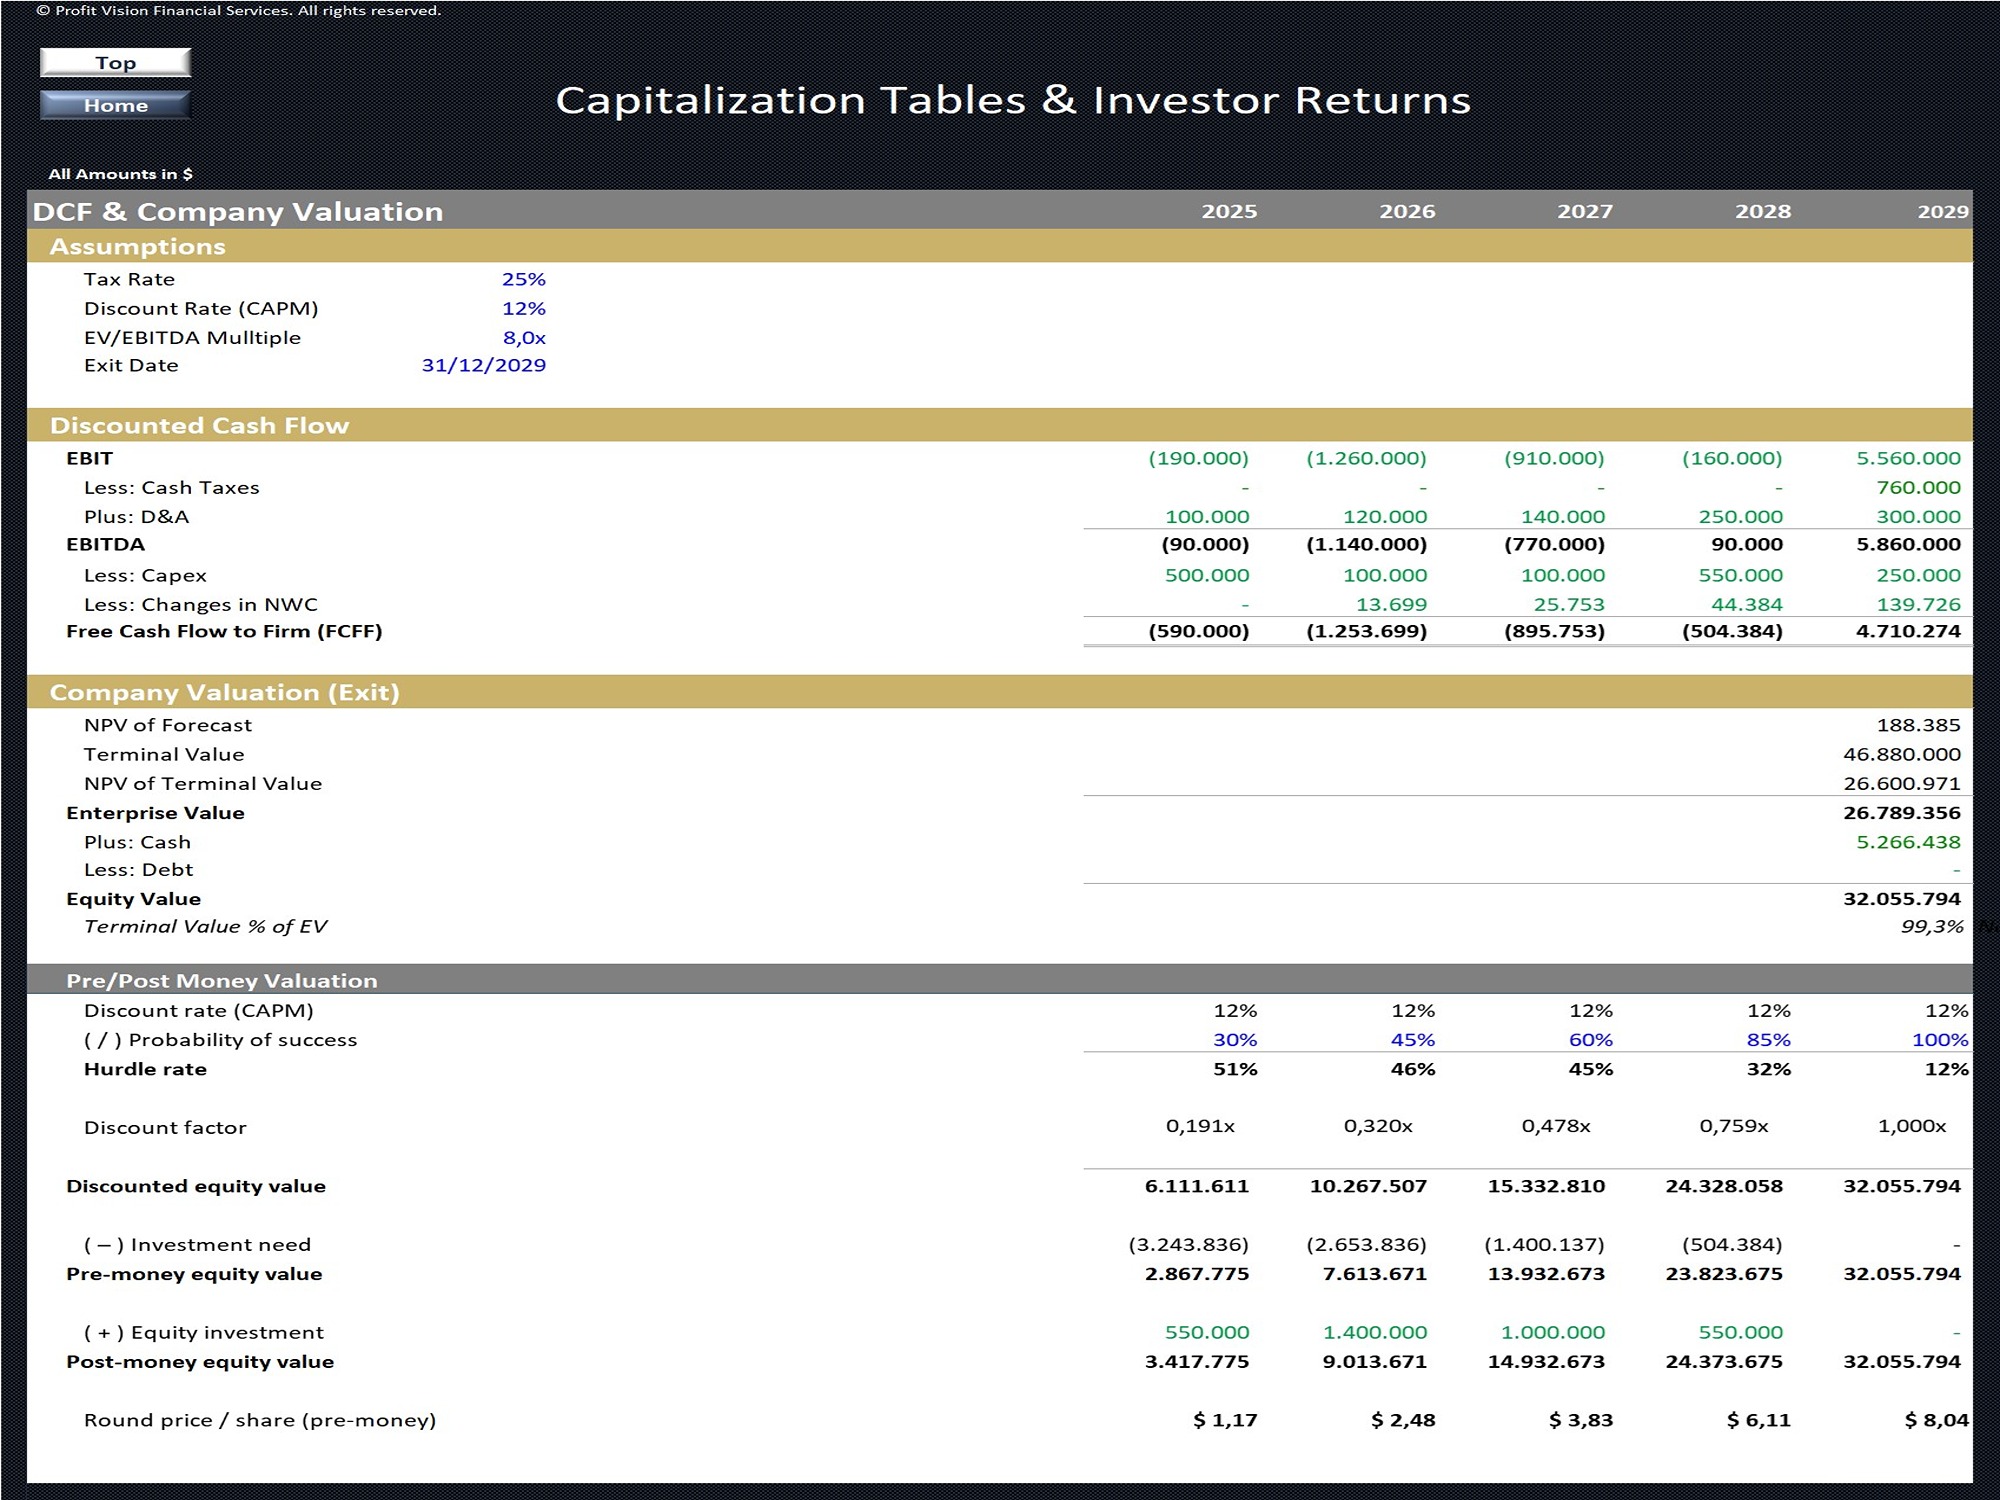
Company valuation analysis based on projected Free Cash Flow and a Discounted Cash Flow methodology. The section also determines pre-money and post-money valuations for the different financing rounds and supports the calculation of implied share prices and equity requirements.
• Pre-Investment Cap Table
Opening capitalization table before external financing. The section details the ownership of founders, management, employees, board members and advisors, including common shares and options, and establishes the fully diluted share count used as the starting point for subsequent funding rounds.
• Seed Cap Table
Seed financing analysis incorporating angel investors and convertible note mechanics. The model calculates note conversion, preferred shares issued, investment amounts, post-money capitalization and the resulting fully diluted ownership of existing and new shareholders following the Seed round.
• Series A Cap Table
Series A financing model showing the round’s pre-money valuation, investment requirements, implied share price and preferred shares issued to Lead and Other Investors. The section updates the capitalization table and calculates post-Series A ownership and dilution for all existing shareholders.
• Series B Cap Table
Series B financing model incorporating additional institutional investment and the resulting issuance of preferred shares. The section calculates the Series B share price, post-money valuation, updated fully diluted share count and ownership percentages following the financing.
• Series C Cap Table
Series C financing analysis representing the final modeled funding round. The section combines all previous share classes and investments with the new Series C issuance to calculate the company’s fully diluted capitalization and the final ownership position of founders, employees, angel investors and institutional investors before exit.
• Investor Returns
Comprehensive investor return analysis consolidating equity contributions and securities held across all financing rounds. The section incorporates preferred dividend accrual, liquidation and participation features and calculates the allocation of exit proceeds among shareholder classes. It also evaluates investor-level returns using metrics such as IRR and cash-on-cash return across different exit valuation scenarios.
Help & Support
Committed to high quality and customer satisfaction, all our templates follow best-practice financial modeling principles and are thoughtfully and carefully designed, keeping the user’s needs and comfort in mind.
Whether you have no experience or are well-versed in finance, accounting, and the use of Microsoft Excel, our professional financial models are the right tools to boost your business operations!
If you experience any difficulty while using this template and cannot find the appropriate guidance in the provided instructions, please feel free to contact us for assistance.
If you need a template customized for your business requirements, please e-mail us and provide a brief explanation of your specific needs.
Similar ProductsOther customers were also interested in...



 Giorgos
Startup Company Financial Model – 5 Year Fin...
Highly-sophisticated and user-friendly financial model for Startup Companies providing a 5-Year adva... Read more

Advanced Financial Model with DCF and Valuation
Dynamic 10-Year Financial Model, suitable for any type of business, supporting strategic planning, i... Read more

Mergers & Acquisitions (M&A) Financial Mod...
M&A financial model providing transaction analysis, valuation, deal financing, synergies, and ac... Read more

Leveraged Buyout (LBO) Financial Model
Leveraged Buyout (LBO) financial model providing acquisition financing, debt analysis, exit valuatio... Read more

General Financial Models – All-in-One Bundle
A collection of templates suitable for various types of businesses/industries, covering major accoun... Read more

Initial Public Offering (IPO) – Valuation &a...
IPO financial model providing financial forecasts, company valuation, share pricing, dilution analys... Read more

Budgeting & Forecasting Model Template
Budgeting & Forecasting Template suitable for either a Trade or Service company in any type of i... Read more

Investment Financial Models Bundle (7 templates)
A collection of templates suitable for investment decisions in various types of businesses/industrie... Read more
Annual Operating Plan – Actual vs Budget Tem...
User friendly template enabling user to prepare an operating budget to project company’s performan... Read more
From Trial Balance to Business Valuation – M...
Management Accounts Template, providing full reporting cycle and mapping between accounting and fina... Read more
You must log in to submit a review.