
0 ITEMS

Calf Fattening (Beef Feedlot) Financial Model – 5-Year Monthly Projections, Unit Economics, 3 Statements, IRR & DCF (Excel)
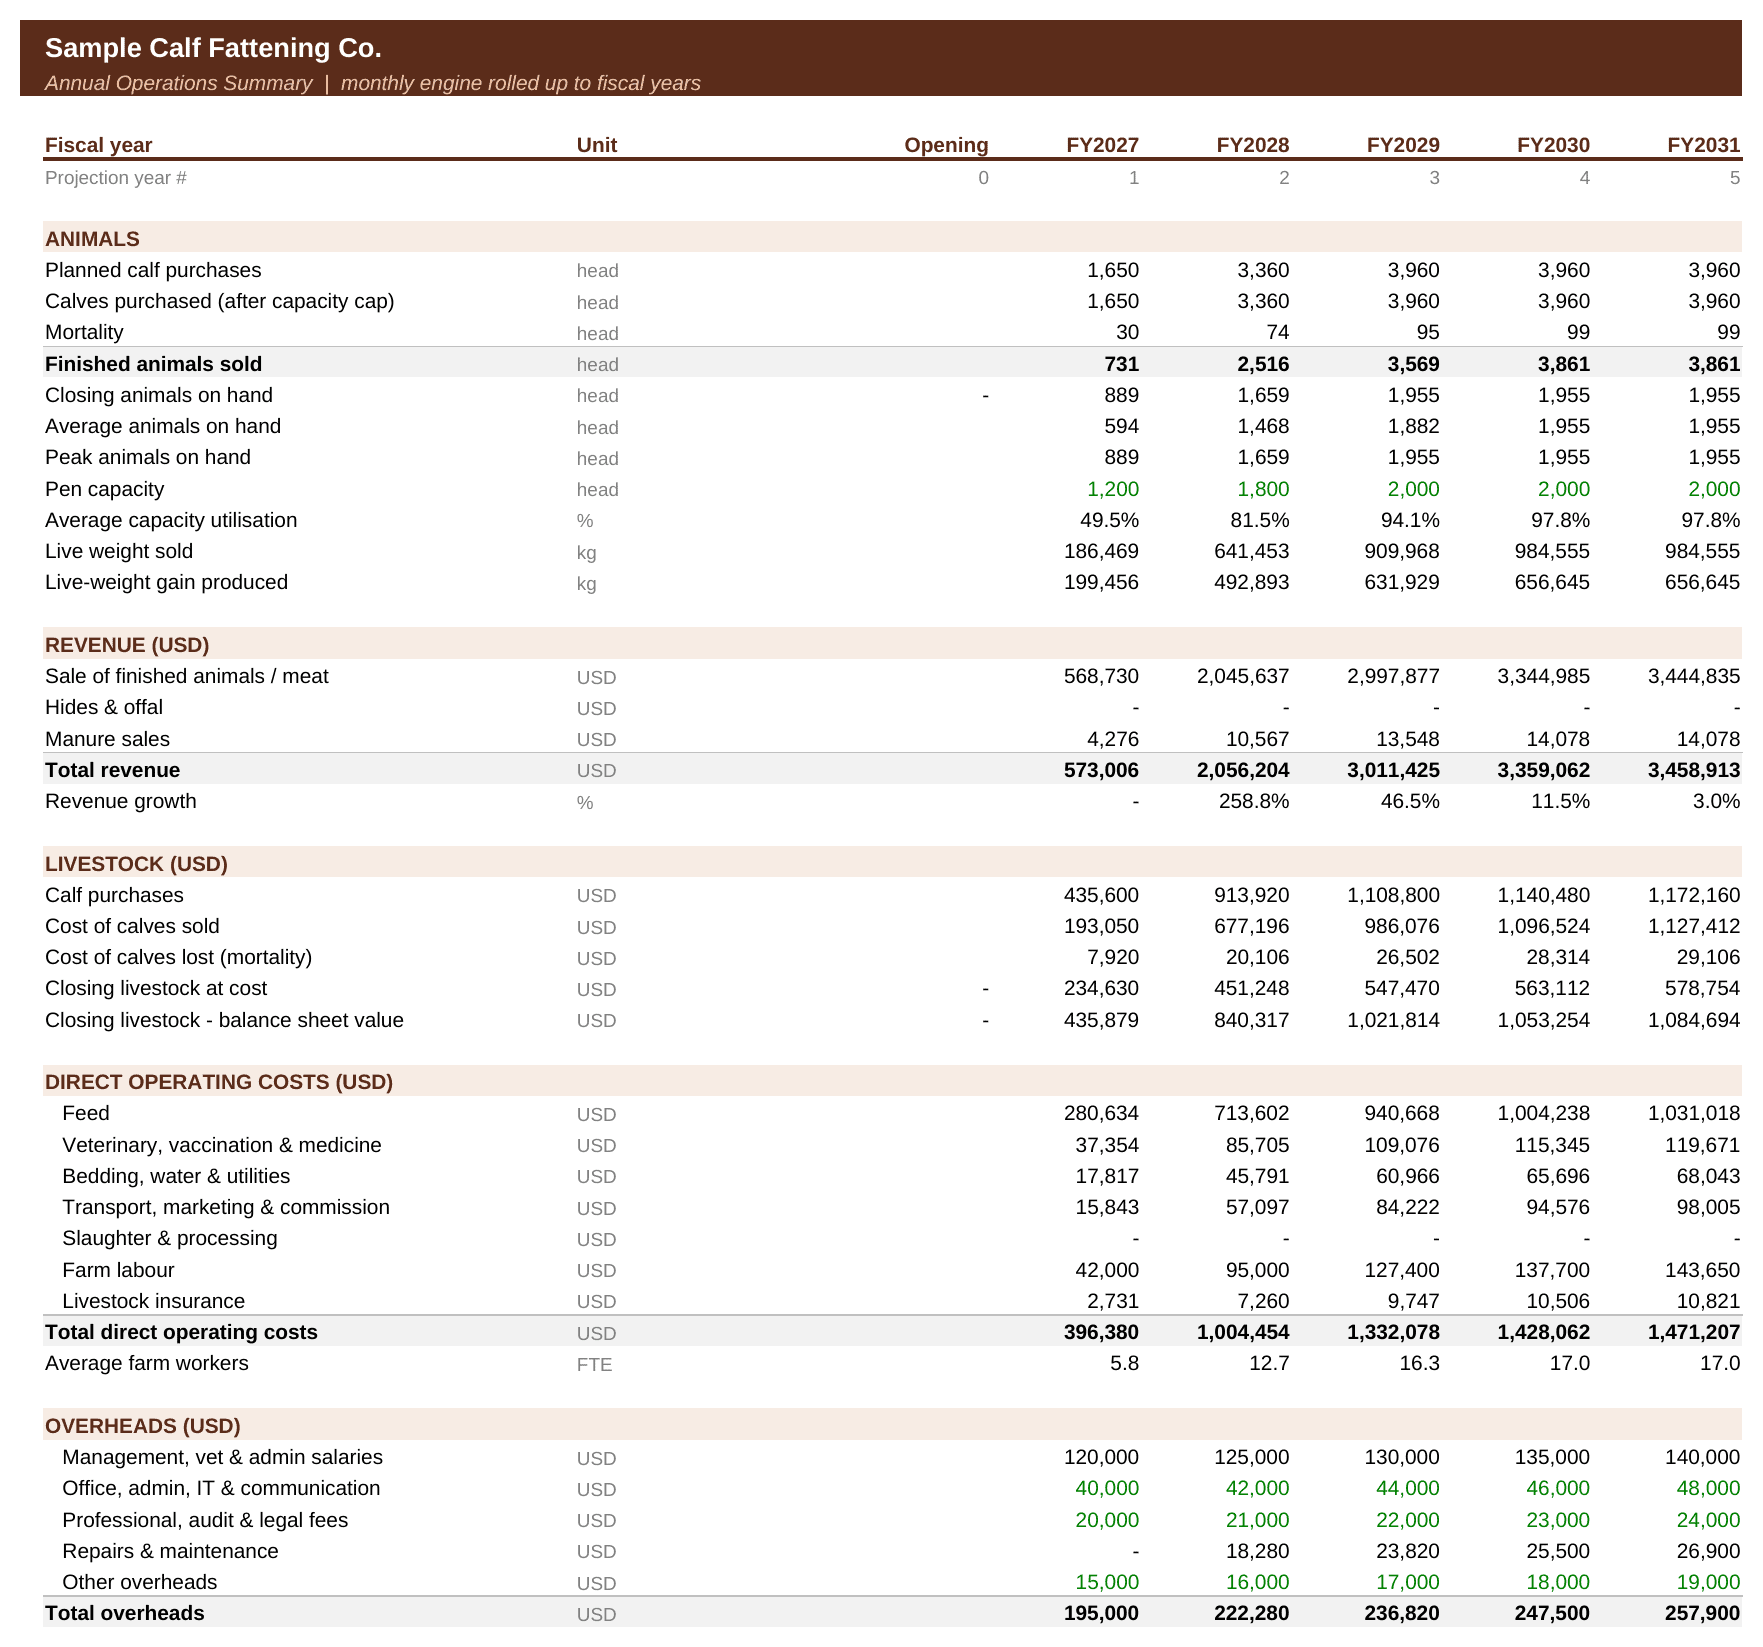
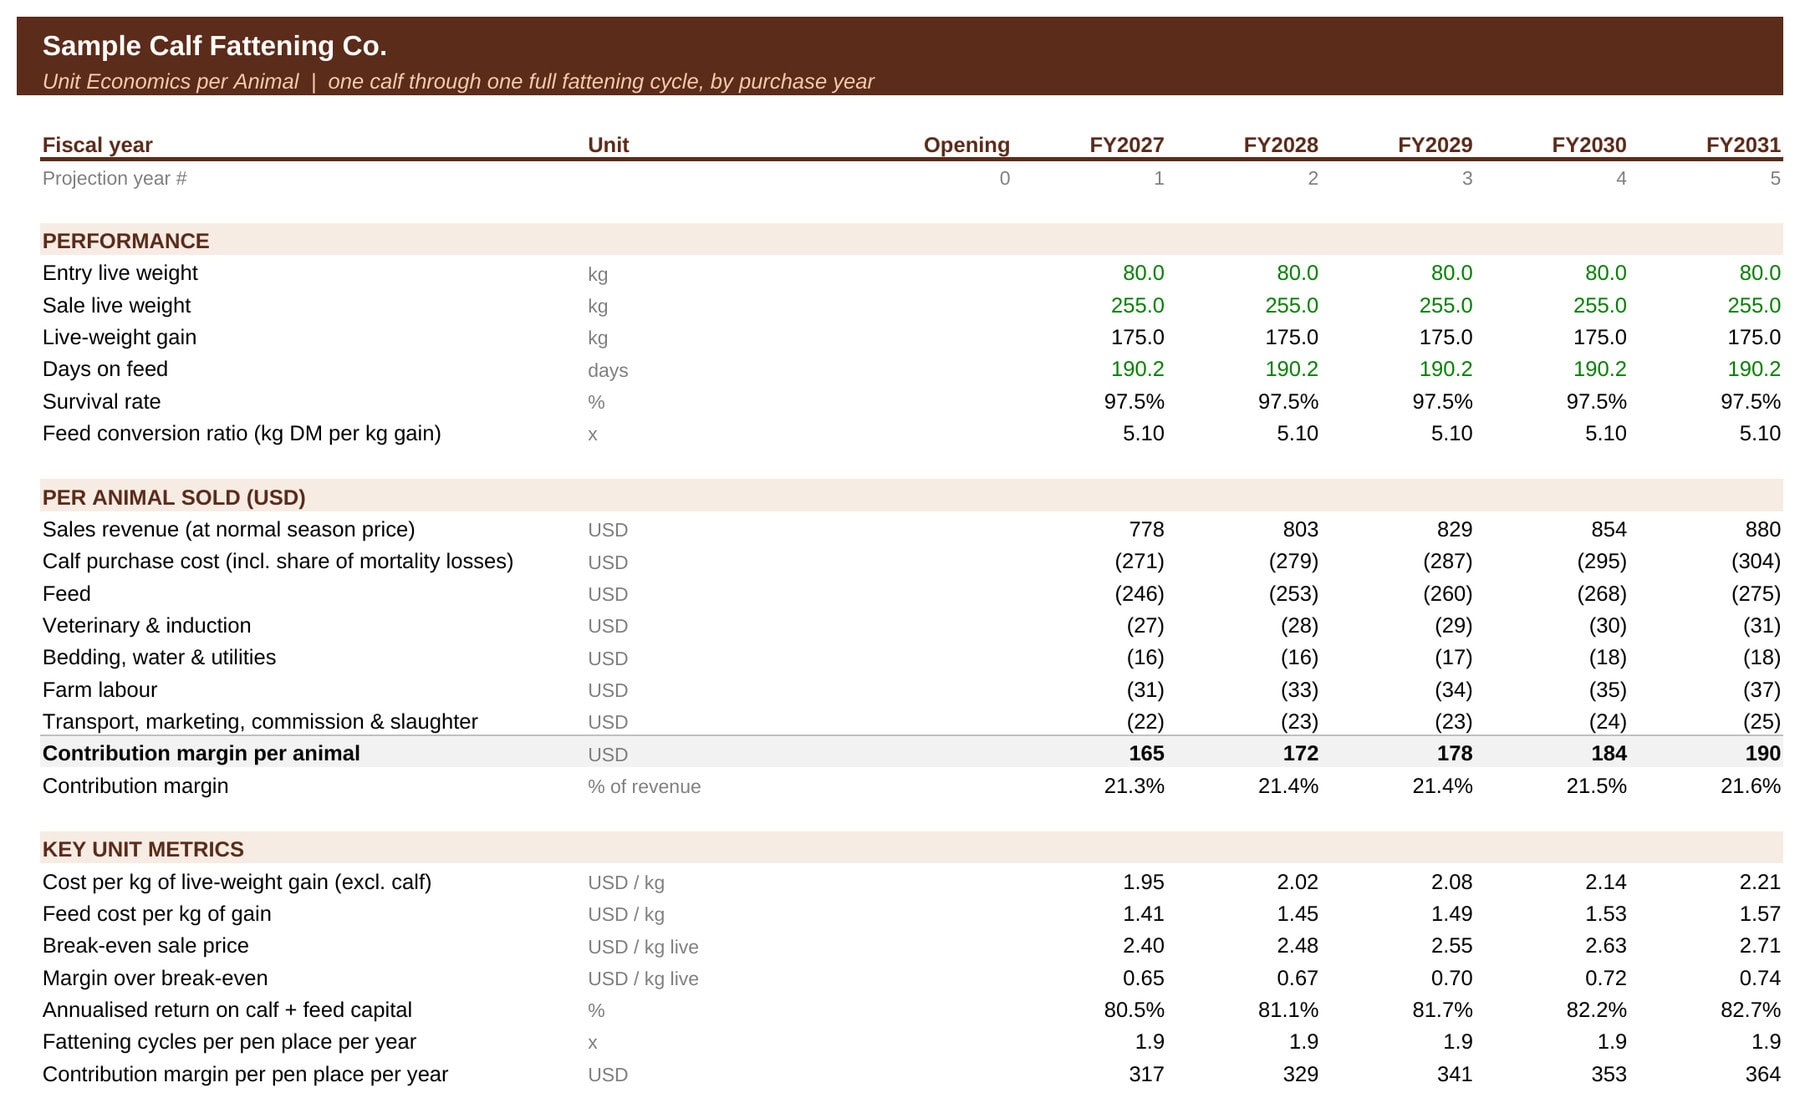
A detailed 5-year Excel financial model for a calf fattening (beef feedlot) business. The business buys young male calves, raises them to a target live weight of 250–260 kg, and sells them live or as meat. A monthly batch engine covering 60 months tracks every intake of calves: mortality, days on feed, finished animals sold and animals on hand. It also checks pen capacity, so purchases never exceed the available pen space. The cycle length is calculated from entry weight, target weight and average daily gain. Feed cost is based on dry-matter intake and a concentrate/roughage ration. Sale prices follow a seasonal price index, for example to capture a festive-season premium. A Unit Economics sheet shows the profit and loss for one animal, including feed conversion ratio, cost per kg of gain, break-even sale price and margin per pen place. All of this feeds a fully linked income statement, balance sheet and cash flow statement. Livestock is valued under IAS 41. The model includes a term loan, an automatic working capital line, tax losses and deferred tax, plus project and equity IRR, NPV, payback and three sensitivity tables. A dashboard with 6 charts and a Base / Upside / Downside scenario switch complete it. Assumptions sit in clearly separated constant and year-by-year input columns. Comes with sample data in USD.
What is this Calf Fattening Financial Model used for?
This template is built for entrepreneurs, livestock farmers, agri-investors, banks and consultants who are evaluating a calf fattening or beef feedlot project. The business model is simple: buy young male calves, typically surplus male calves from dairy farms, feed them to a target weight of about 250–260 kg, then sell them live or as carcass meat. The template converts that cycle into a bankable 5-year financial plan. You can use it for a feasibility study, a bank loan application, an investor pitch or annual budgeting.
Key features and highlights
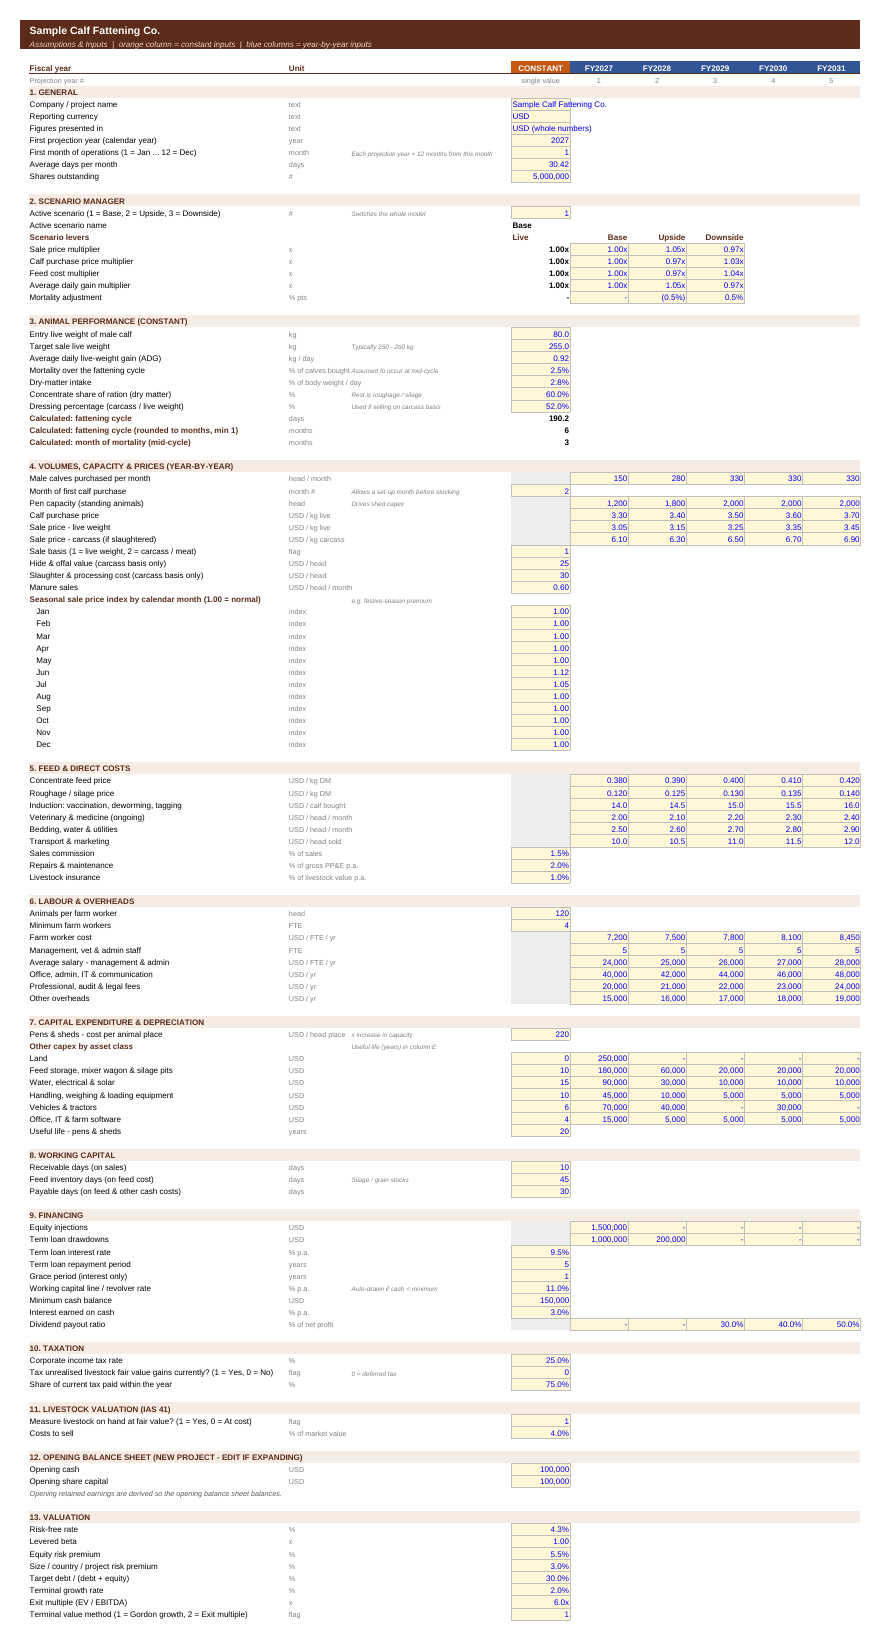
- Clearly separated inputs: one Inputs sheet with an orange CONSTANT column for single-value assumptions and blue year-by-year columns for assumptions that change over the 5 years. All inputs are in blue font on a yellow background.
- Animal performance: entry weight, target sale weight, average daily gain, mortality, dry-matter intake, ration mix and dressing %. The fattening cycle (days and months) is calculated automatically.
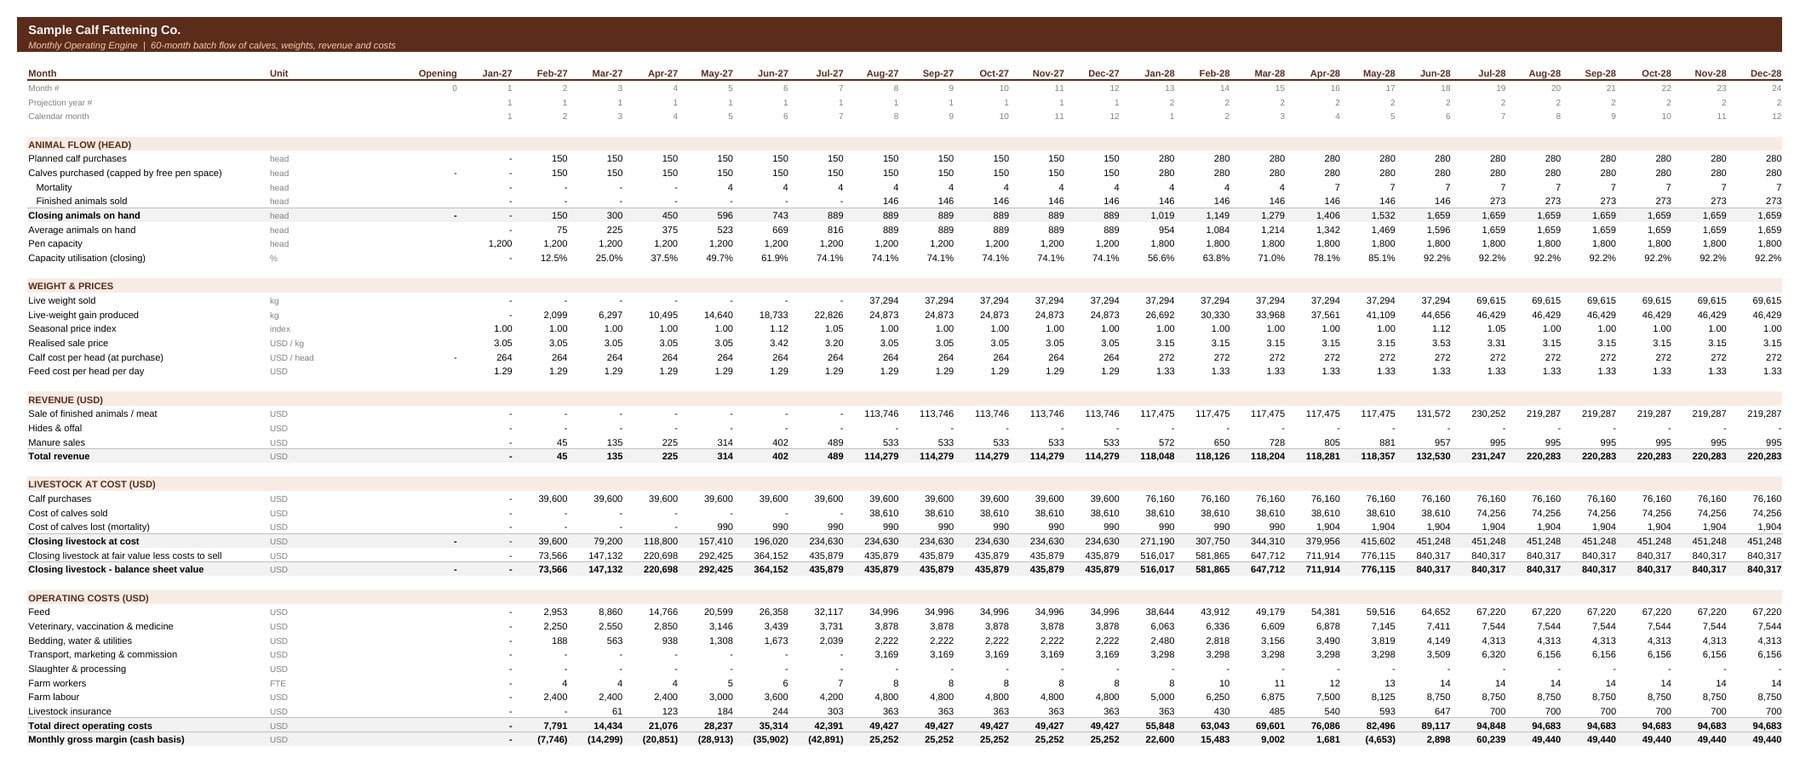
- 60-month batch engine: monthly calf purchases, mortality at mid-cycle, finished animals sold after the cycle, animals on hand, average stock and capacity utilisation. Purchases are automatically capped by free pen space.
- Flexible revenue: sale on a live-weight or carcass (meat) basis, with hides & offal, manure income and a 12-month seasonal price index.
- Detailed costs: feed from dry-matter intake × concentrate and roughage prices, induction (vaccination, deworming, tagging), ongoing vet, bedding and utilities, transport, commission, slaughter & processing, labour driven by animals per worker, insurance, R&M and overheads.
- Unit economics per animal: revenue, calf cost including mortality, feed, vet, labour and other costs, contribution margin, FCR, cost per kg of gain, break-even sale price, annualised return and margin per pen place.
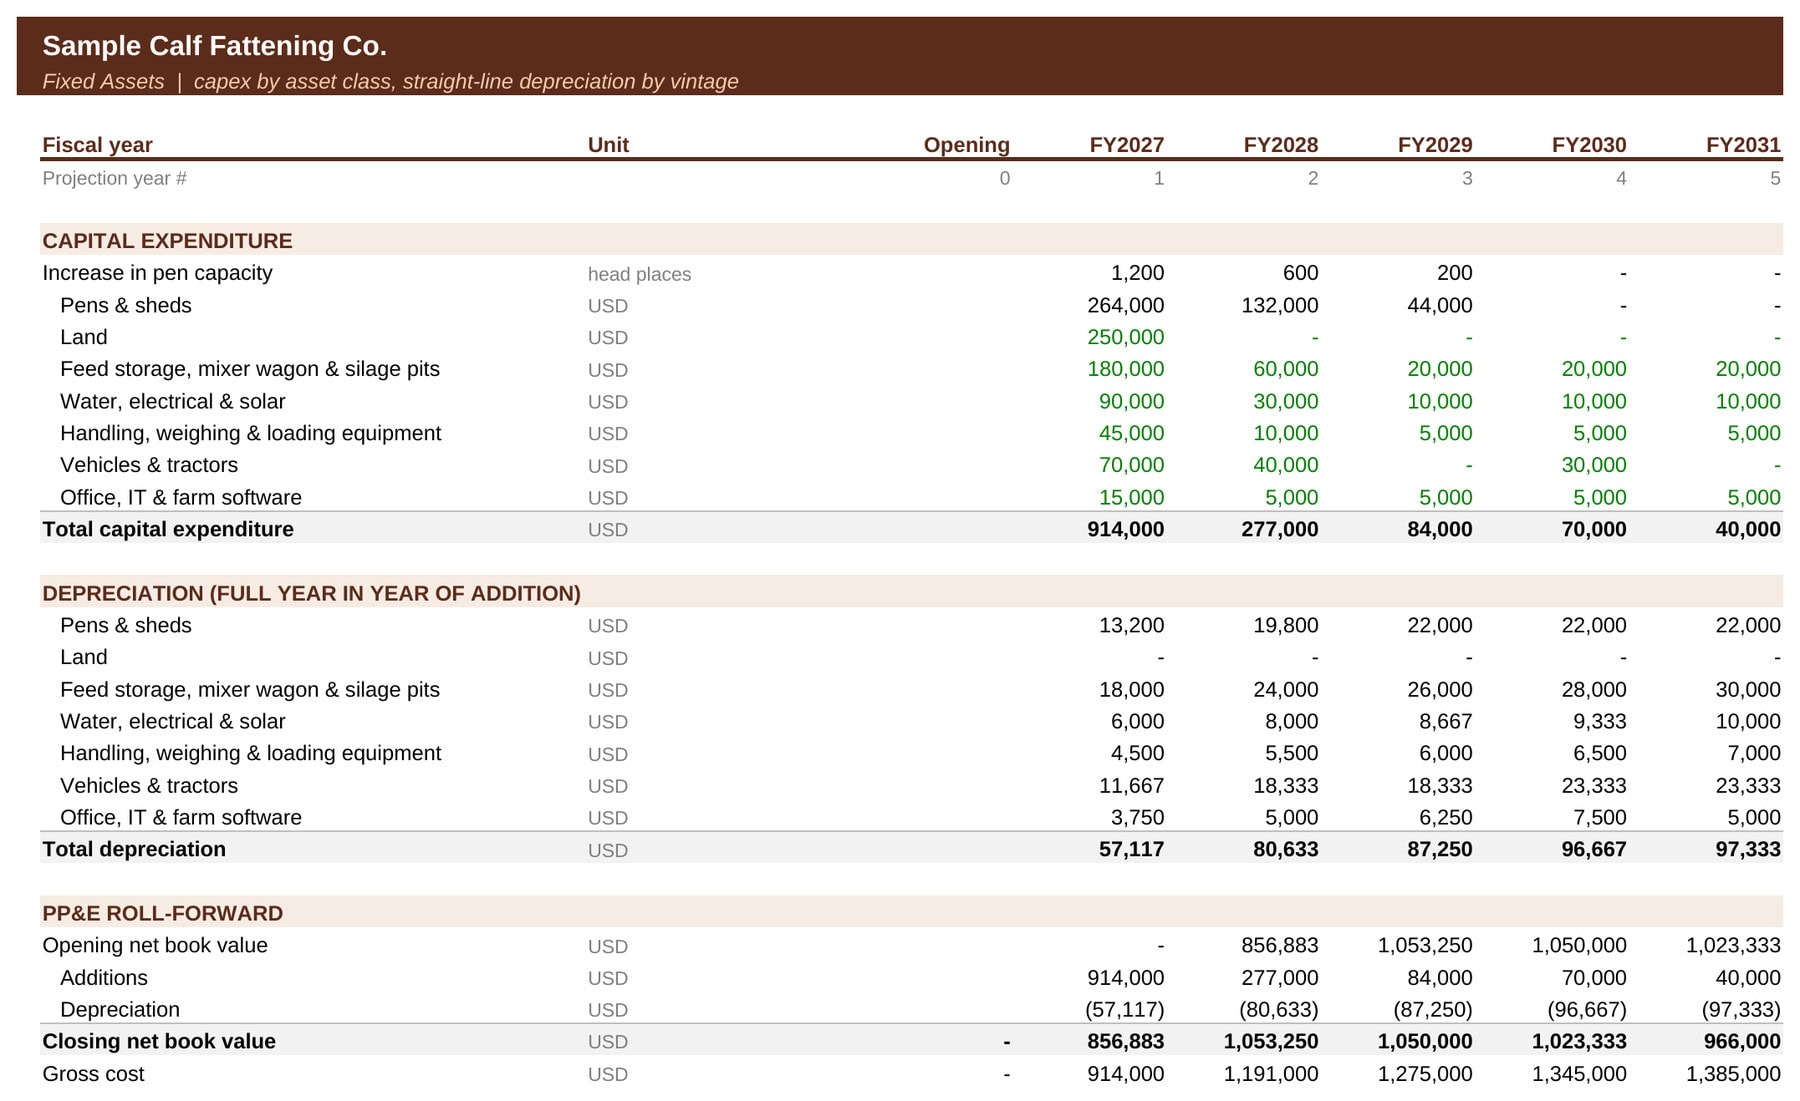
- Capex: pens and sheds sized from the capacity increase × cost per head place, plus feed storage, water/solar, handling equipment, vehicles and IT, with vintage-based depreciation.
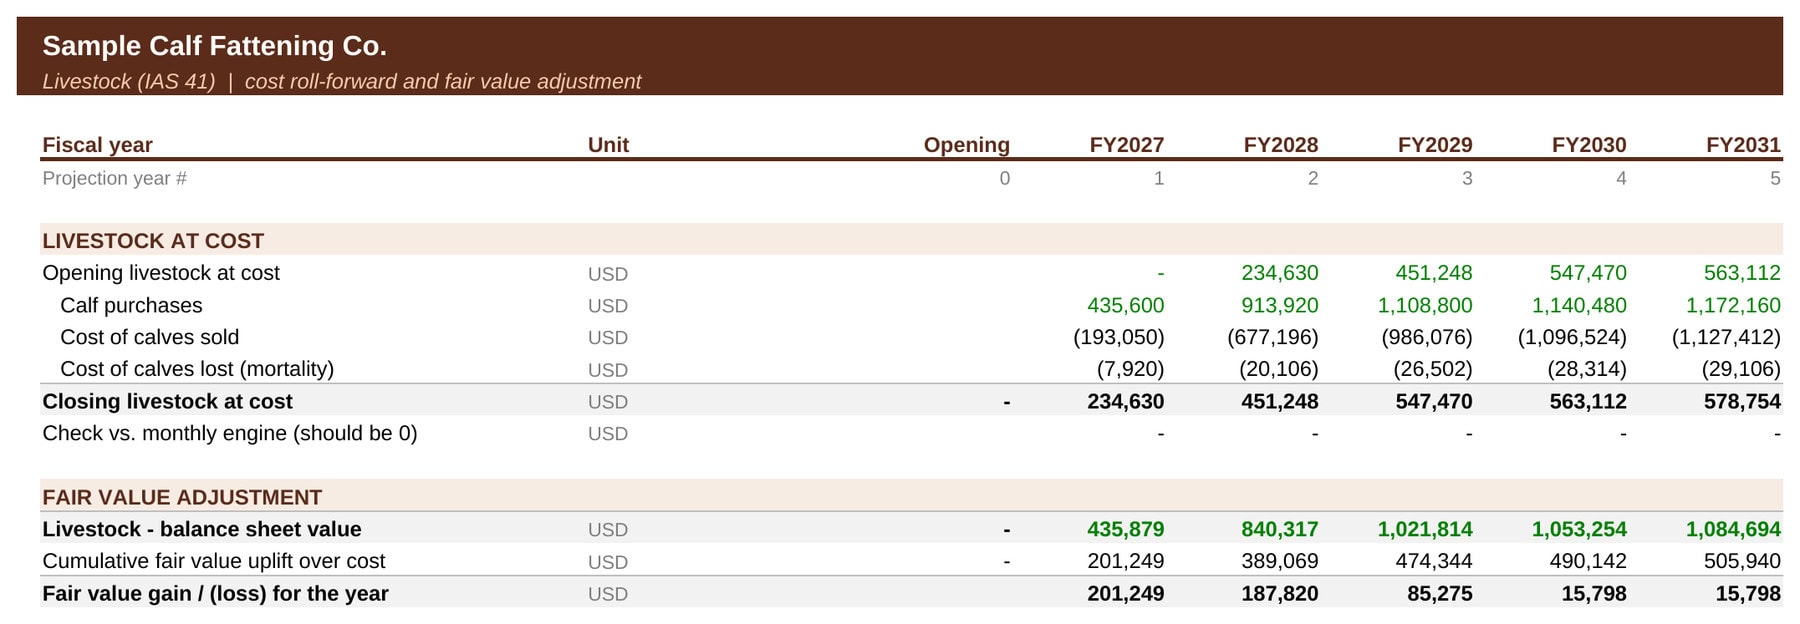
- IAS 41 livestock: a cost roll-forward plus a fair value uplift. You can switch to valuing livestock at cost instead.
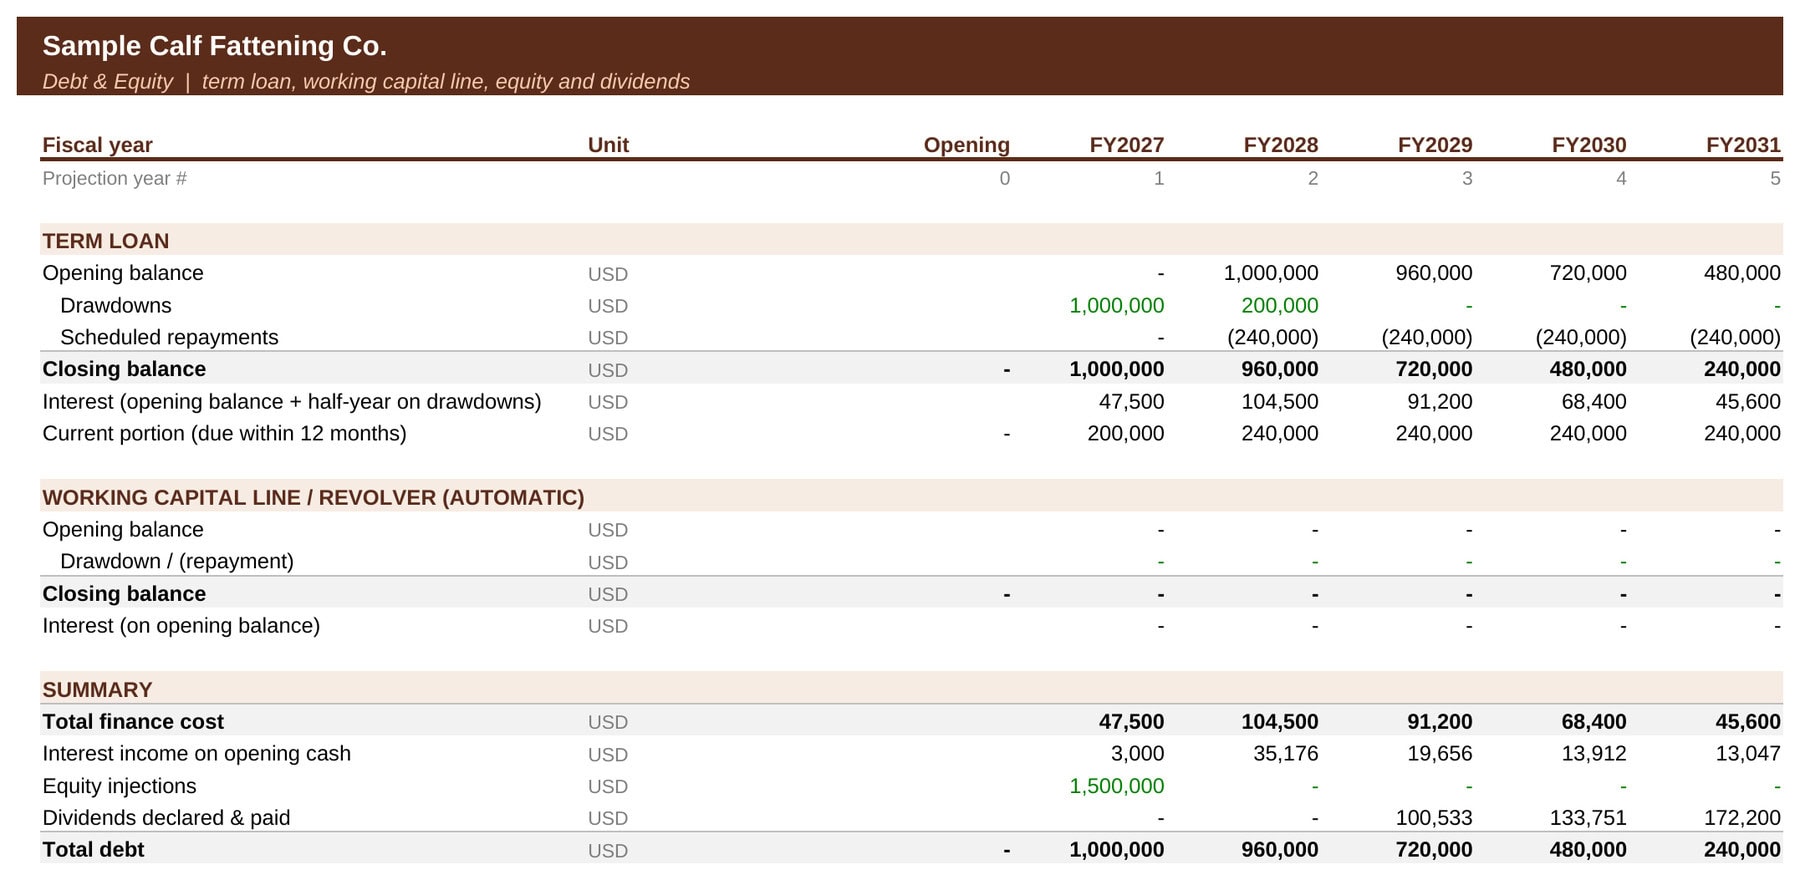
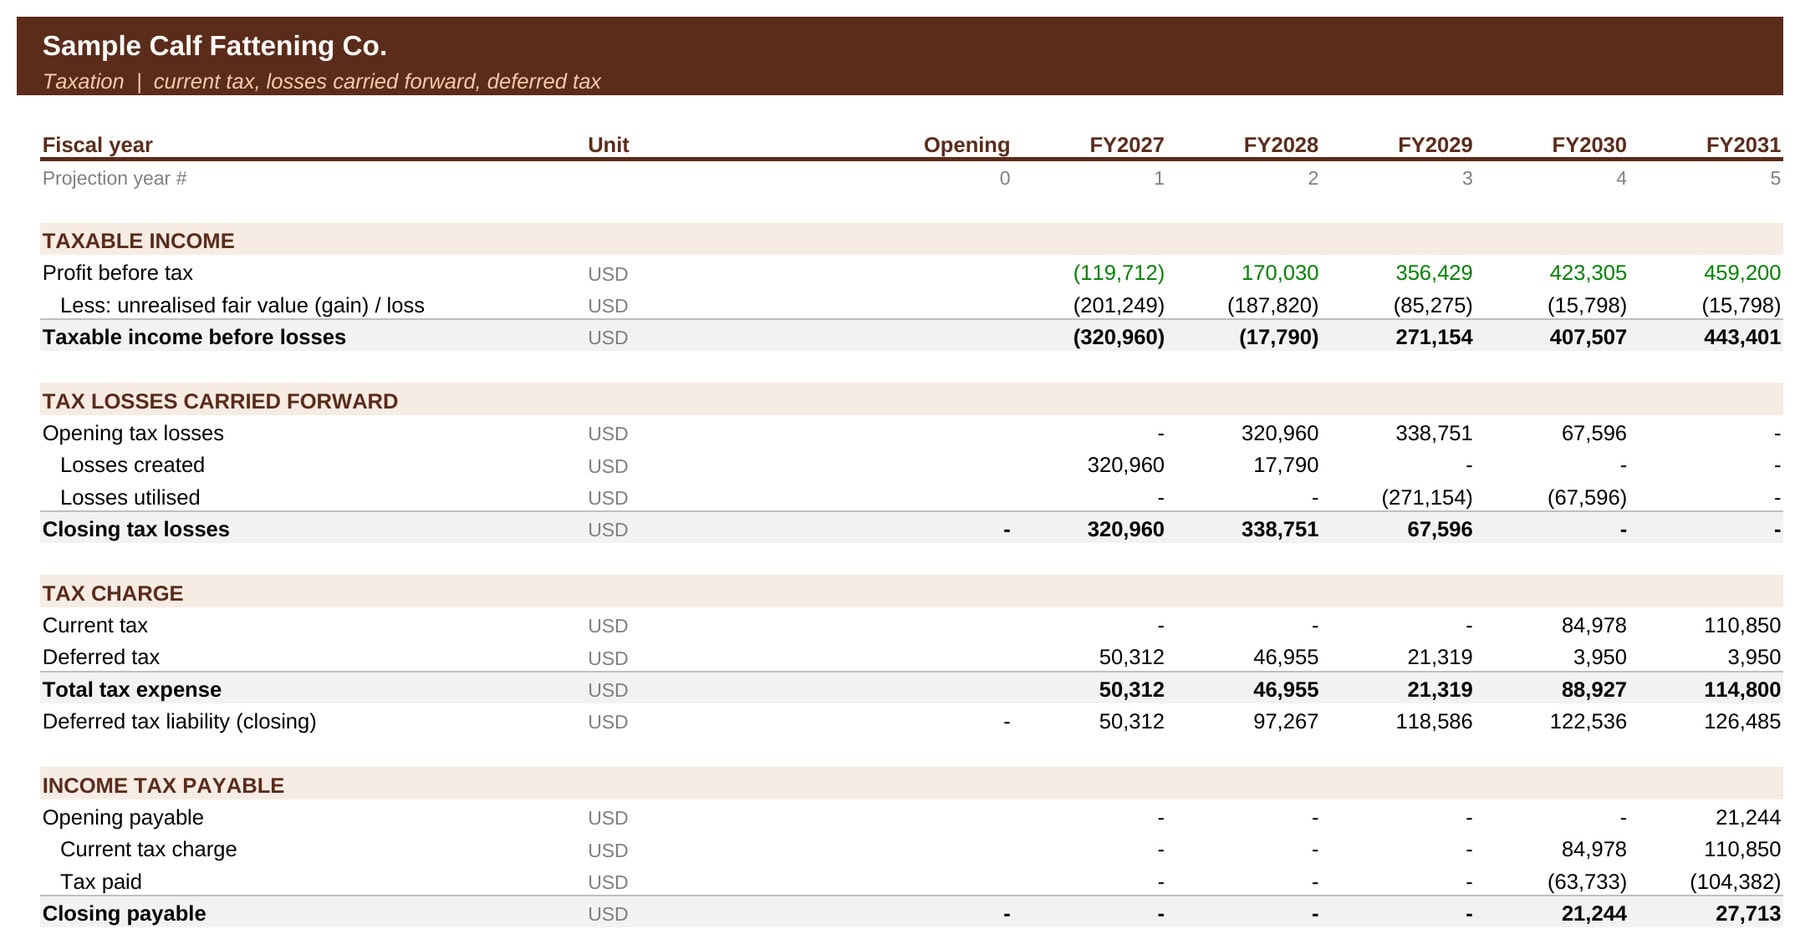
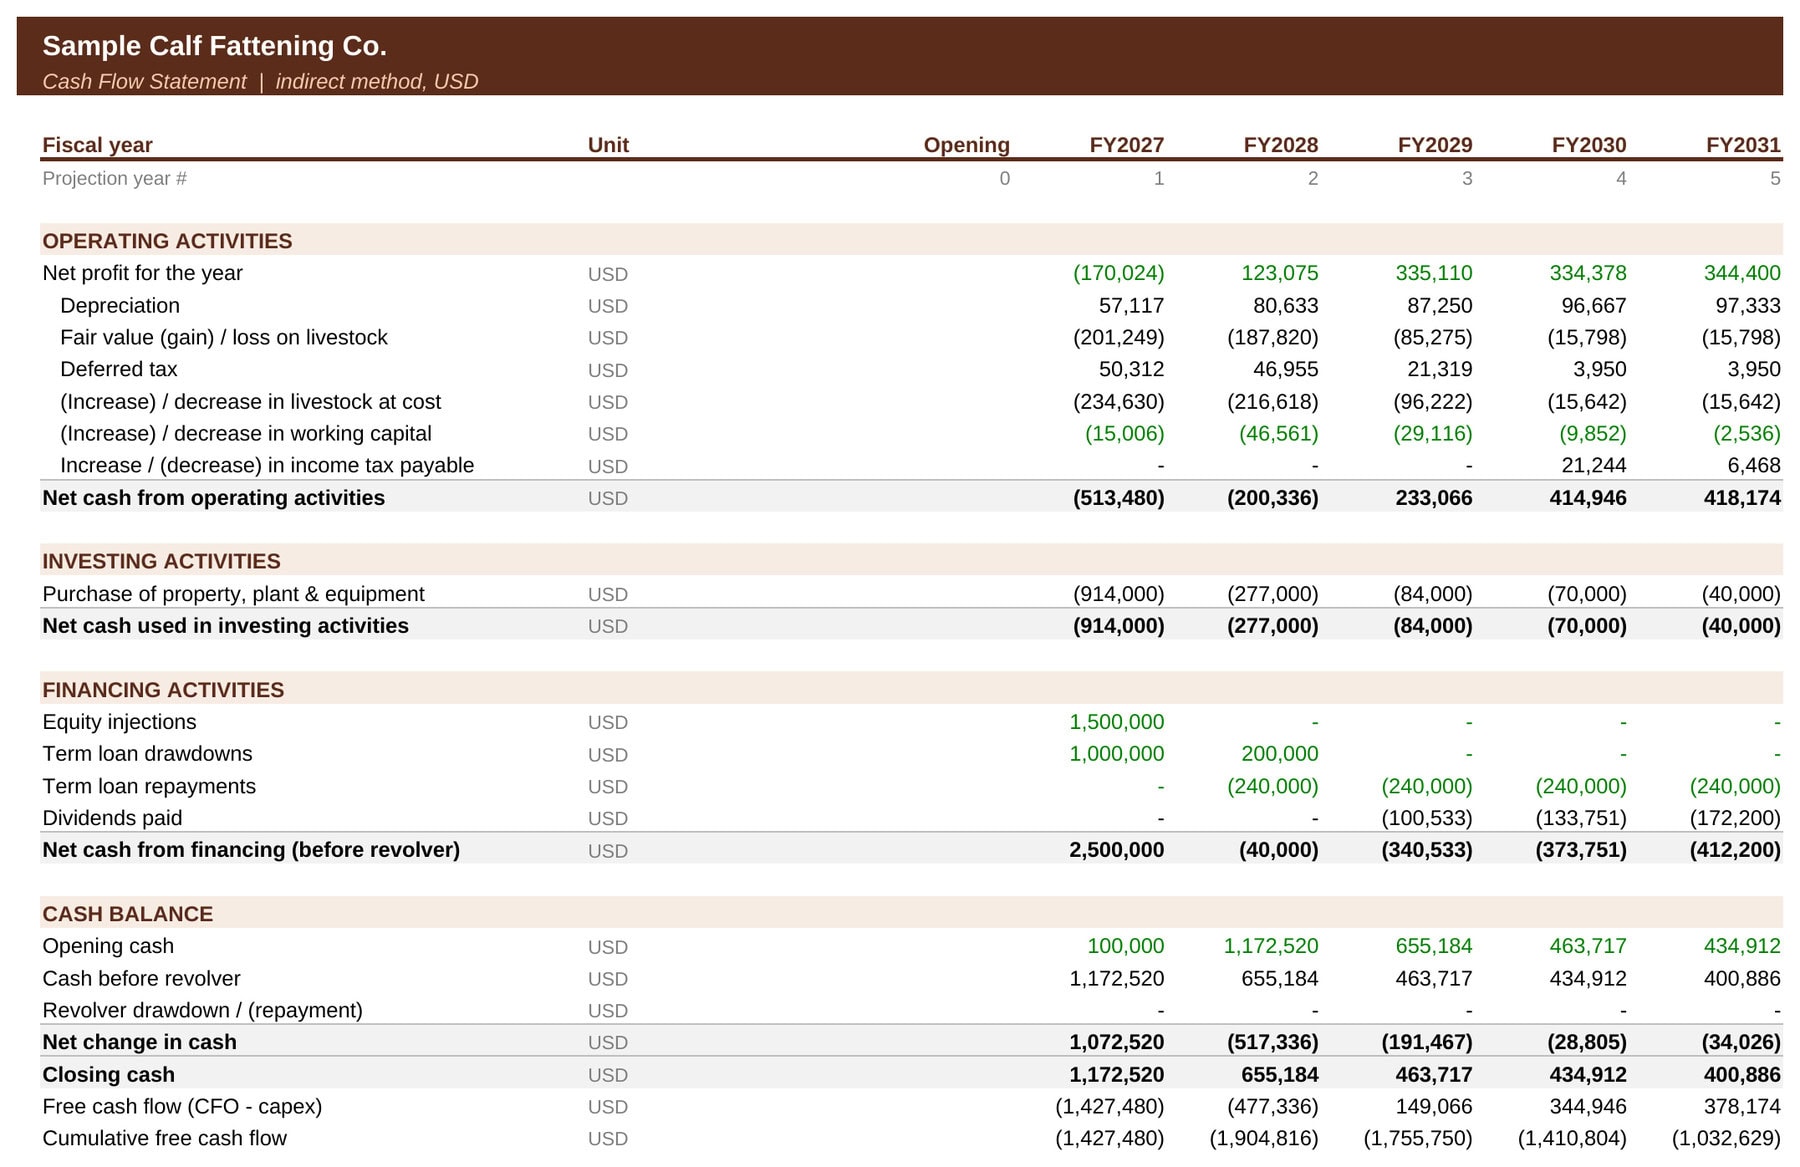
- Financing & tax: equity, a term loan with grace period, an automatic working capital line that keeps a minimum cash balance, dividends, tax losses carried forward and deferred tax.
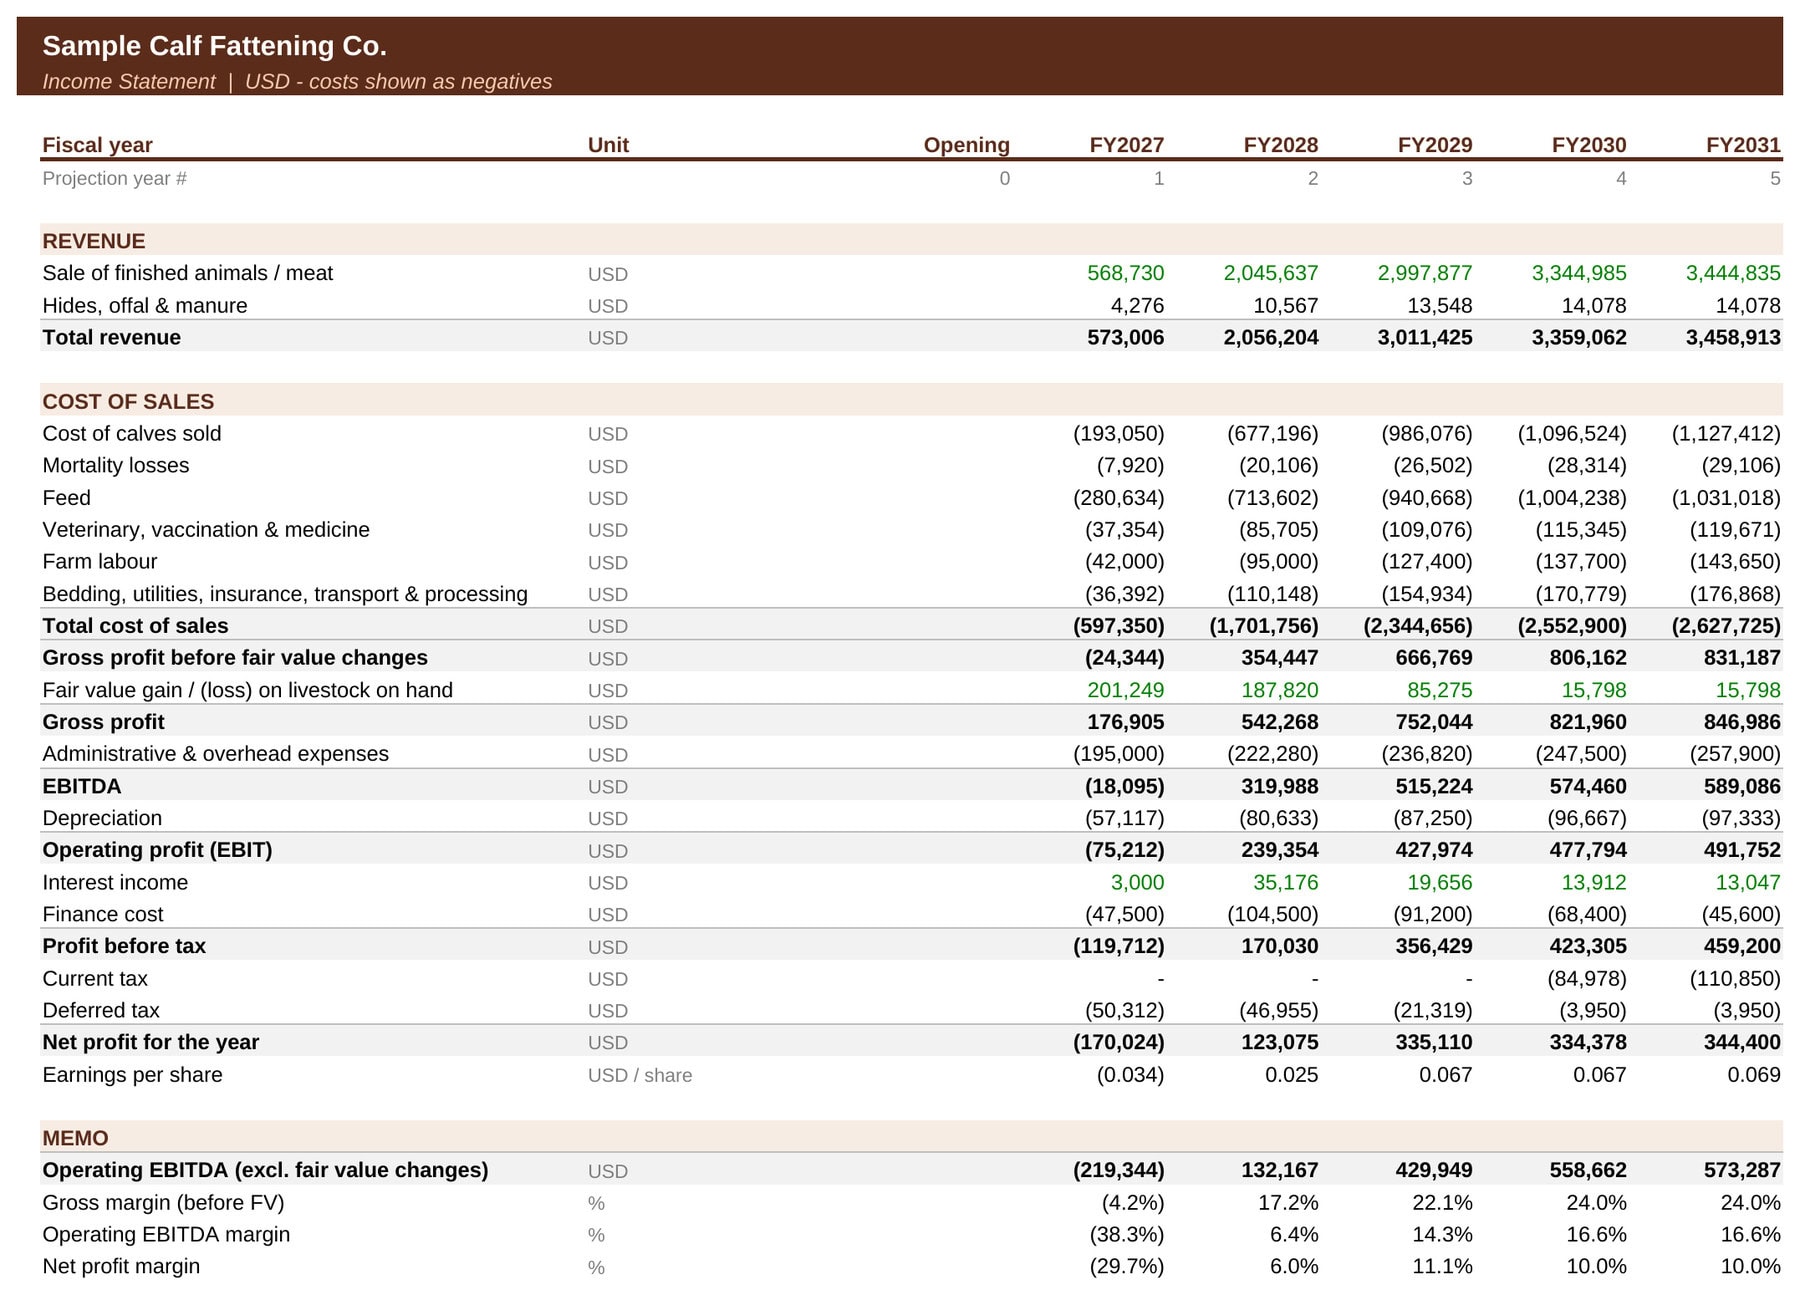
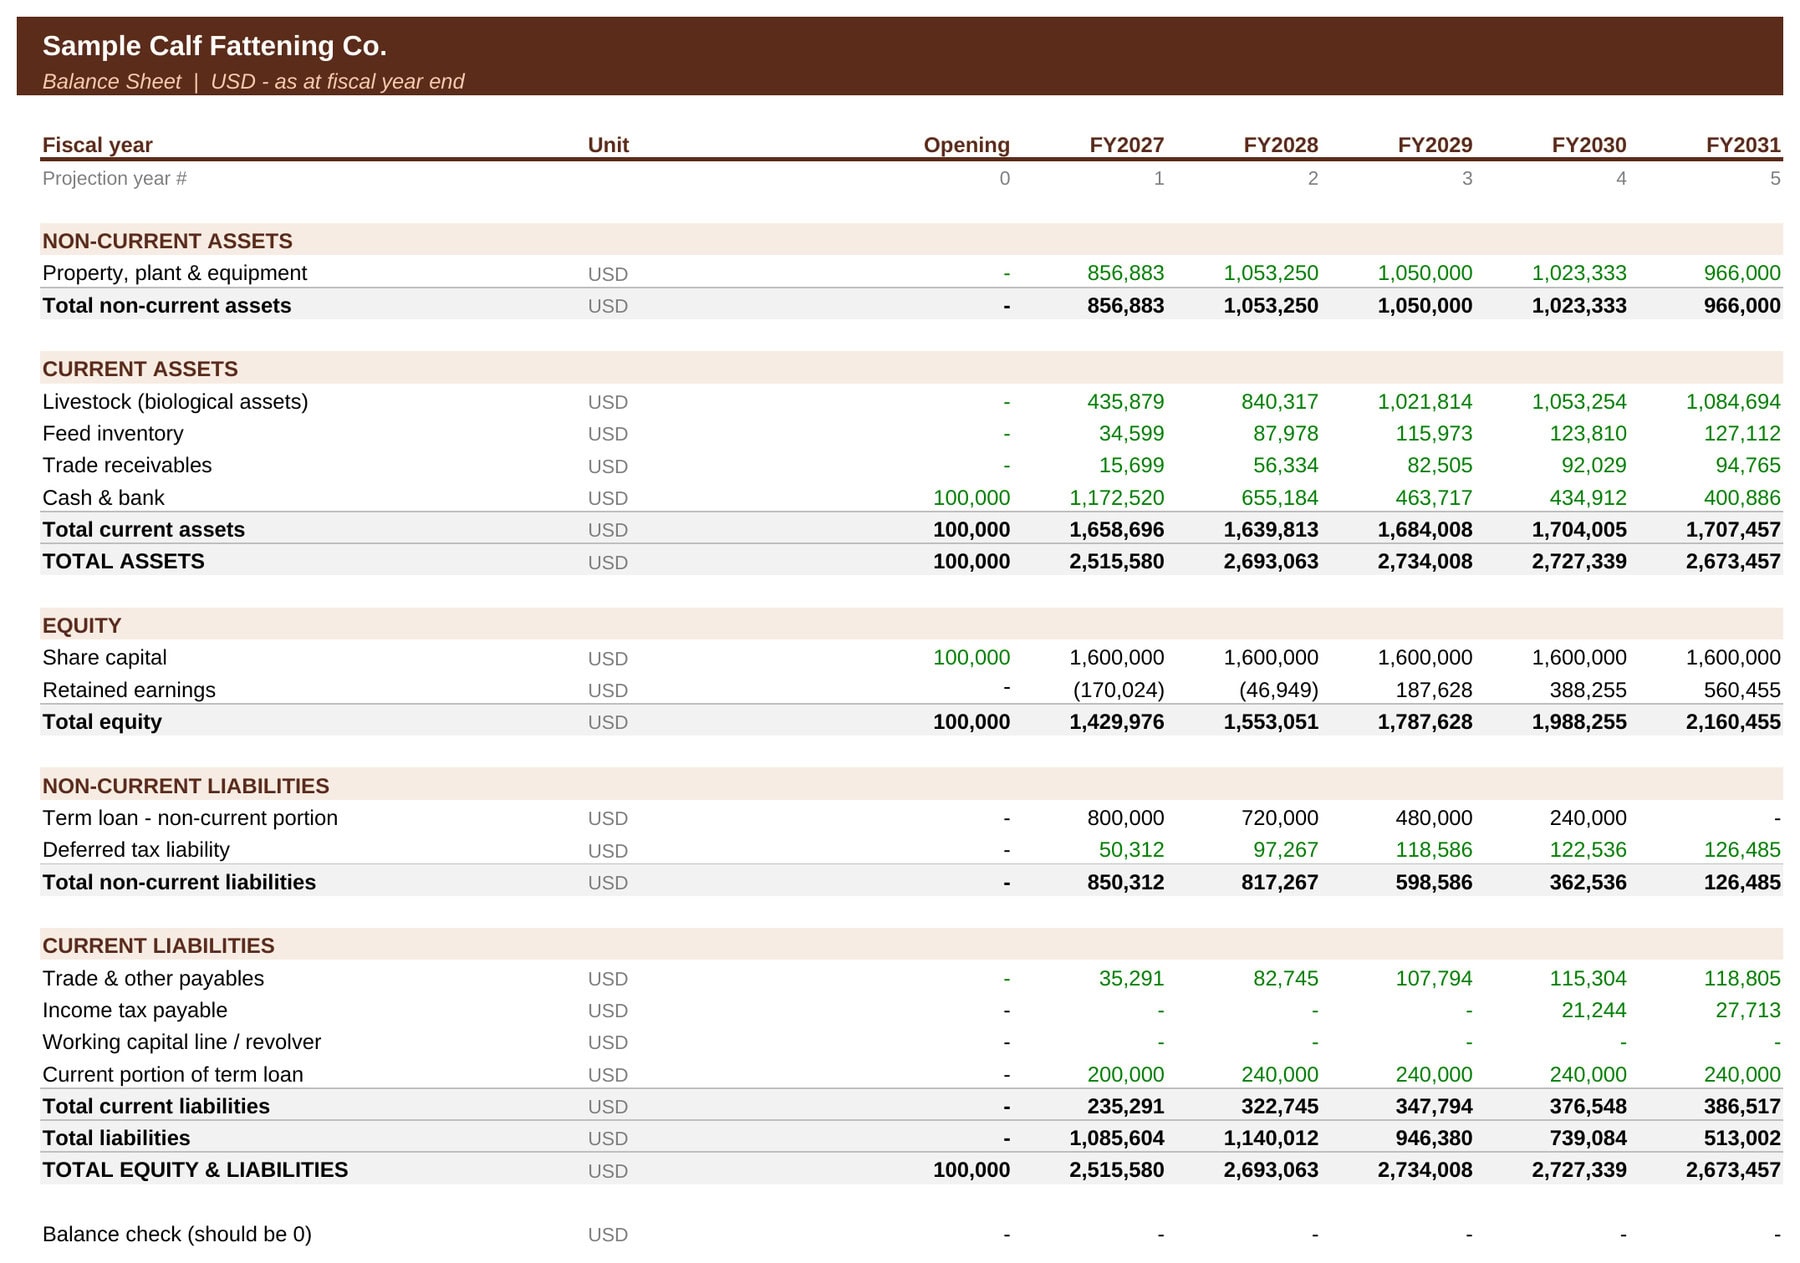
- Three fully linked financial statements: income statement, balance sheet and cash flow statement, with balance checks.
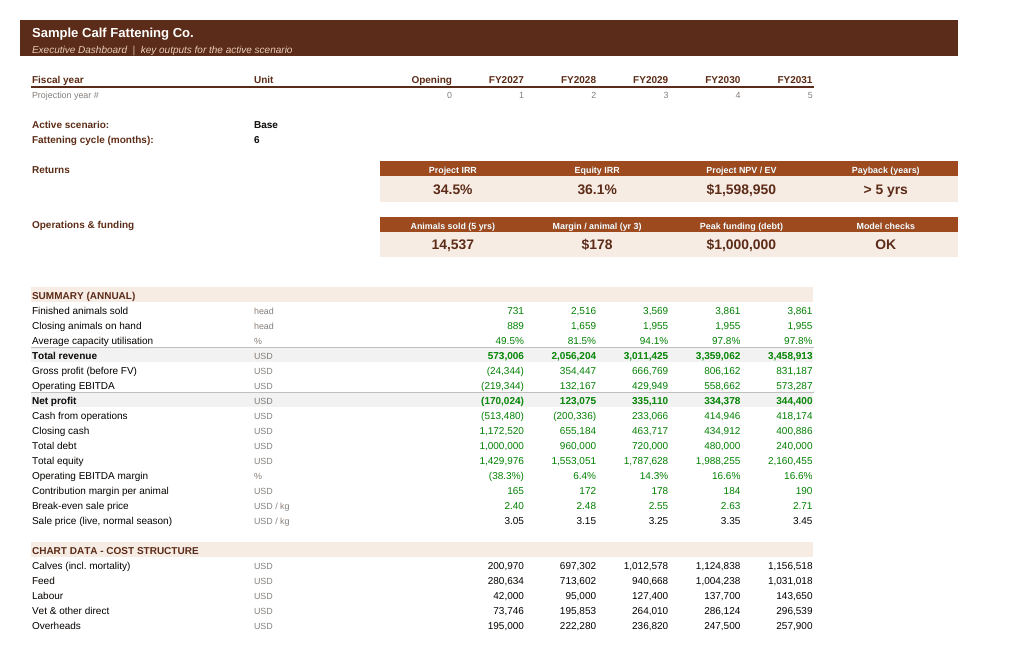
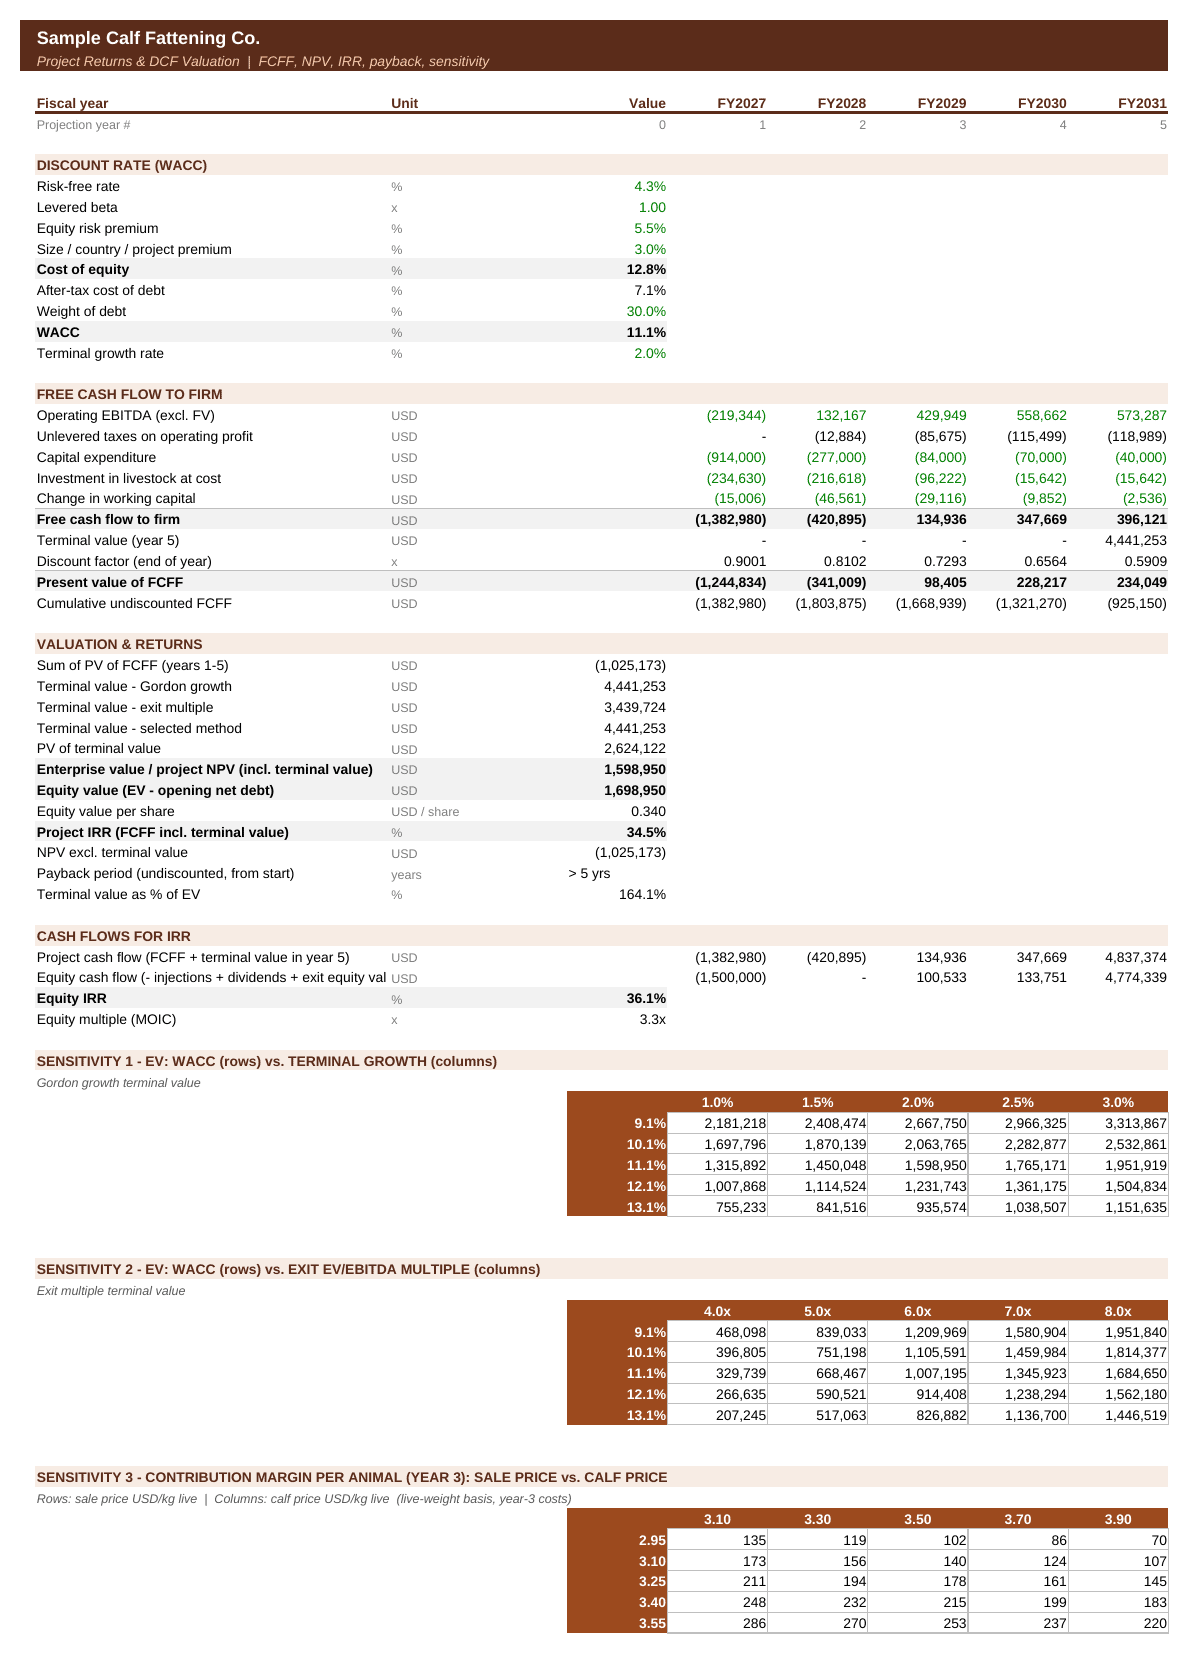
- Returns & valuation: WACC, free cash flow to firm, NPV, project IRR, equity IRR, MOIC, payback, Gordon growth or exit-multiple terminal value.
- Sensitivities: EV for WACC vs. growth and WACC vs. exit multiple, plus margin per animal for sale price vs. calf price.
- Scenario manager: Base / Upside / Downside levers for sale price, calf price, feed cost, daily gain and mortality.
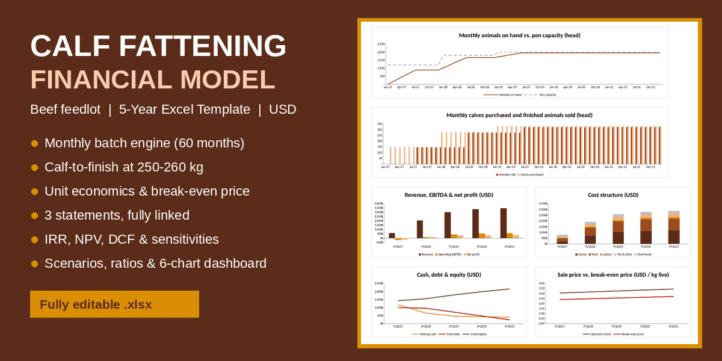
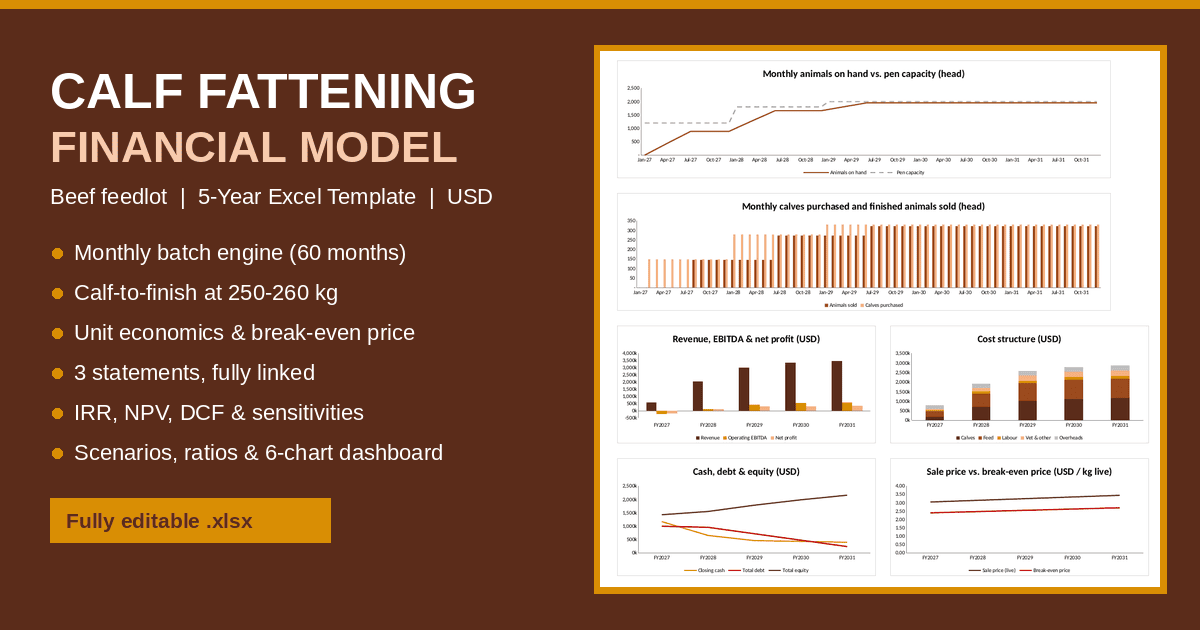
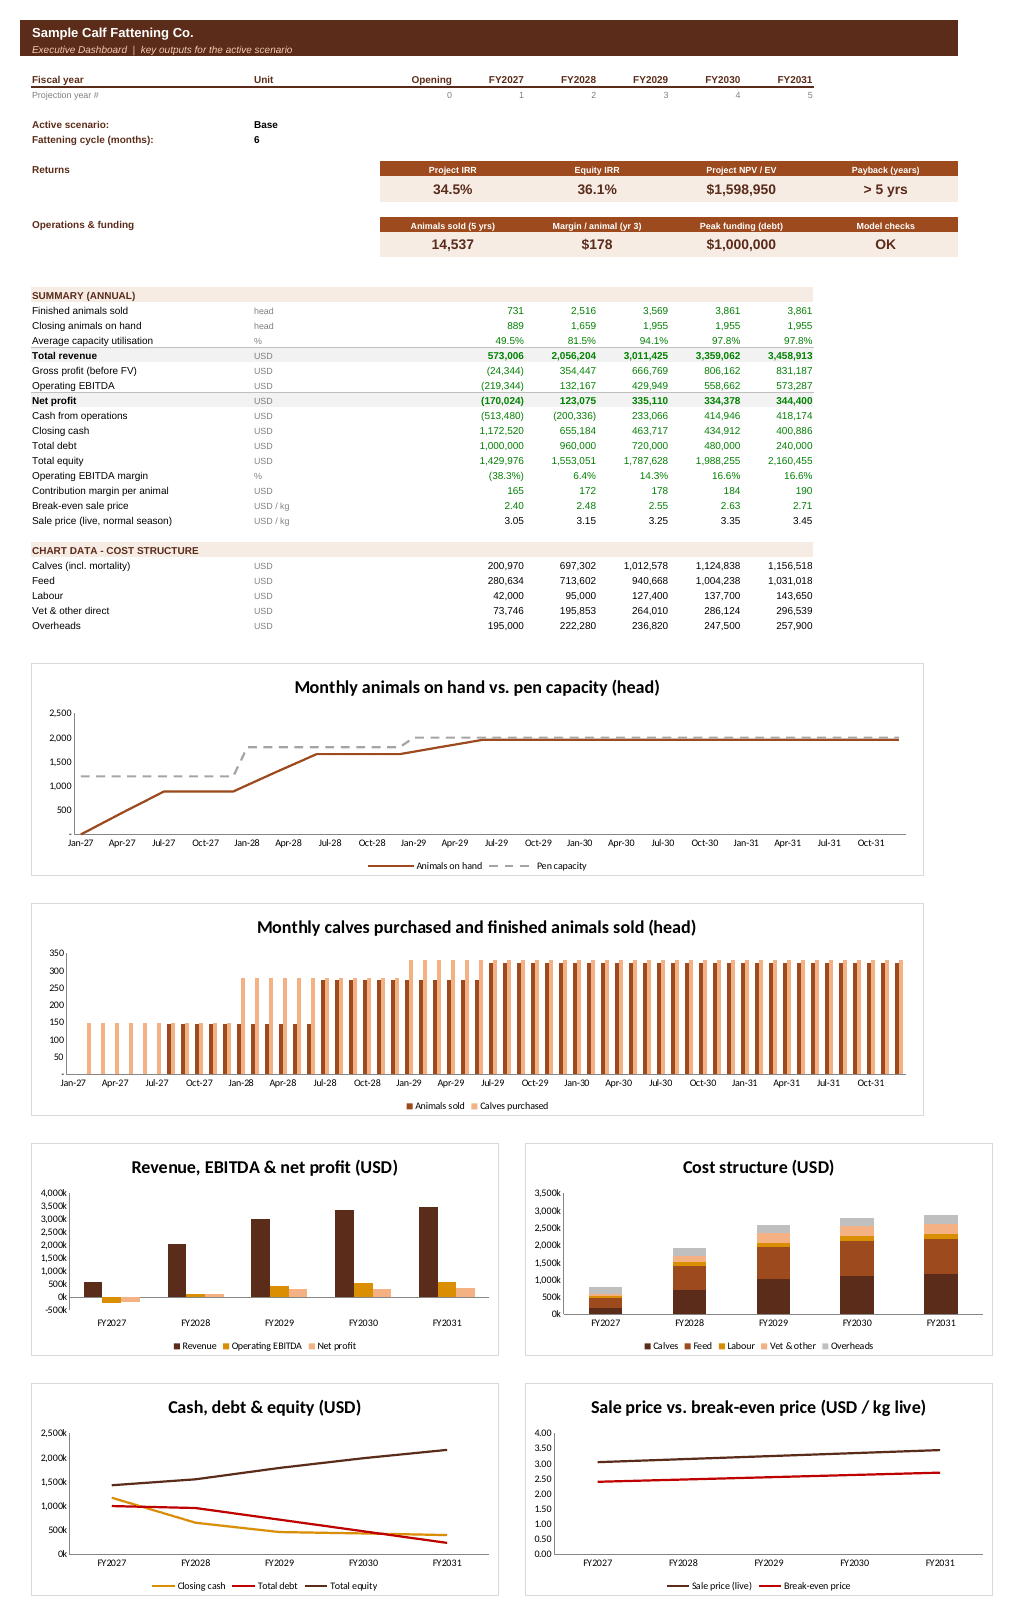
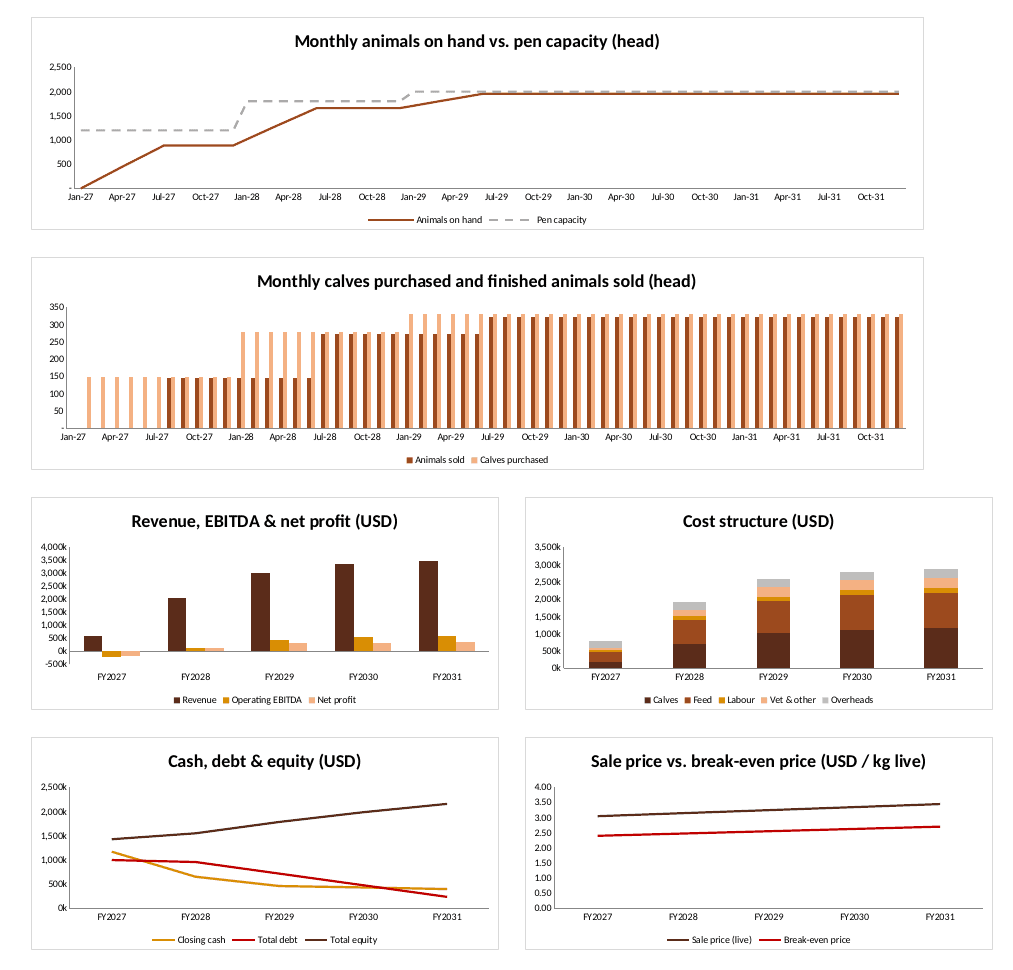
- Dashboard: 8 KPI tiles, an annual summary and 6 charts. The charts cover monthly stock vs. capacity, monthly purchases and sales, revenue/EBITDA/net profit, cost structure, cash/debt/equity, and sale price vs. break-even price.
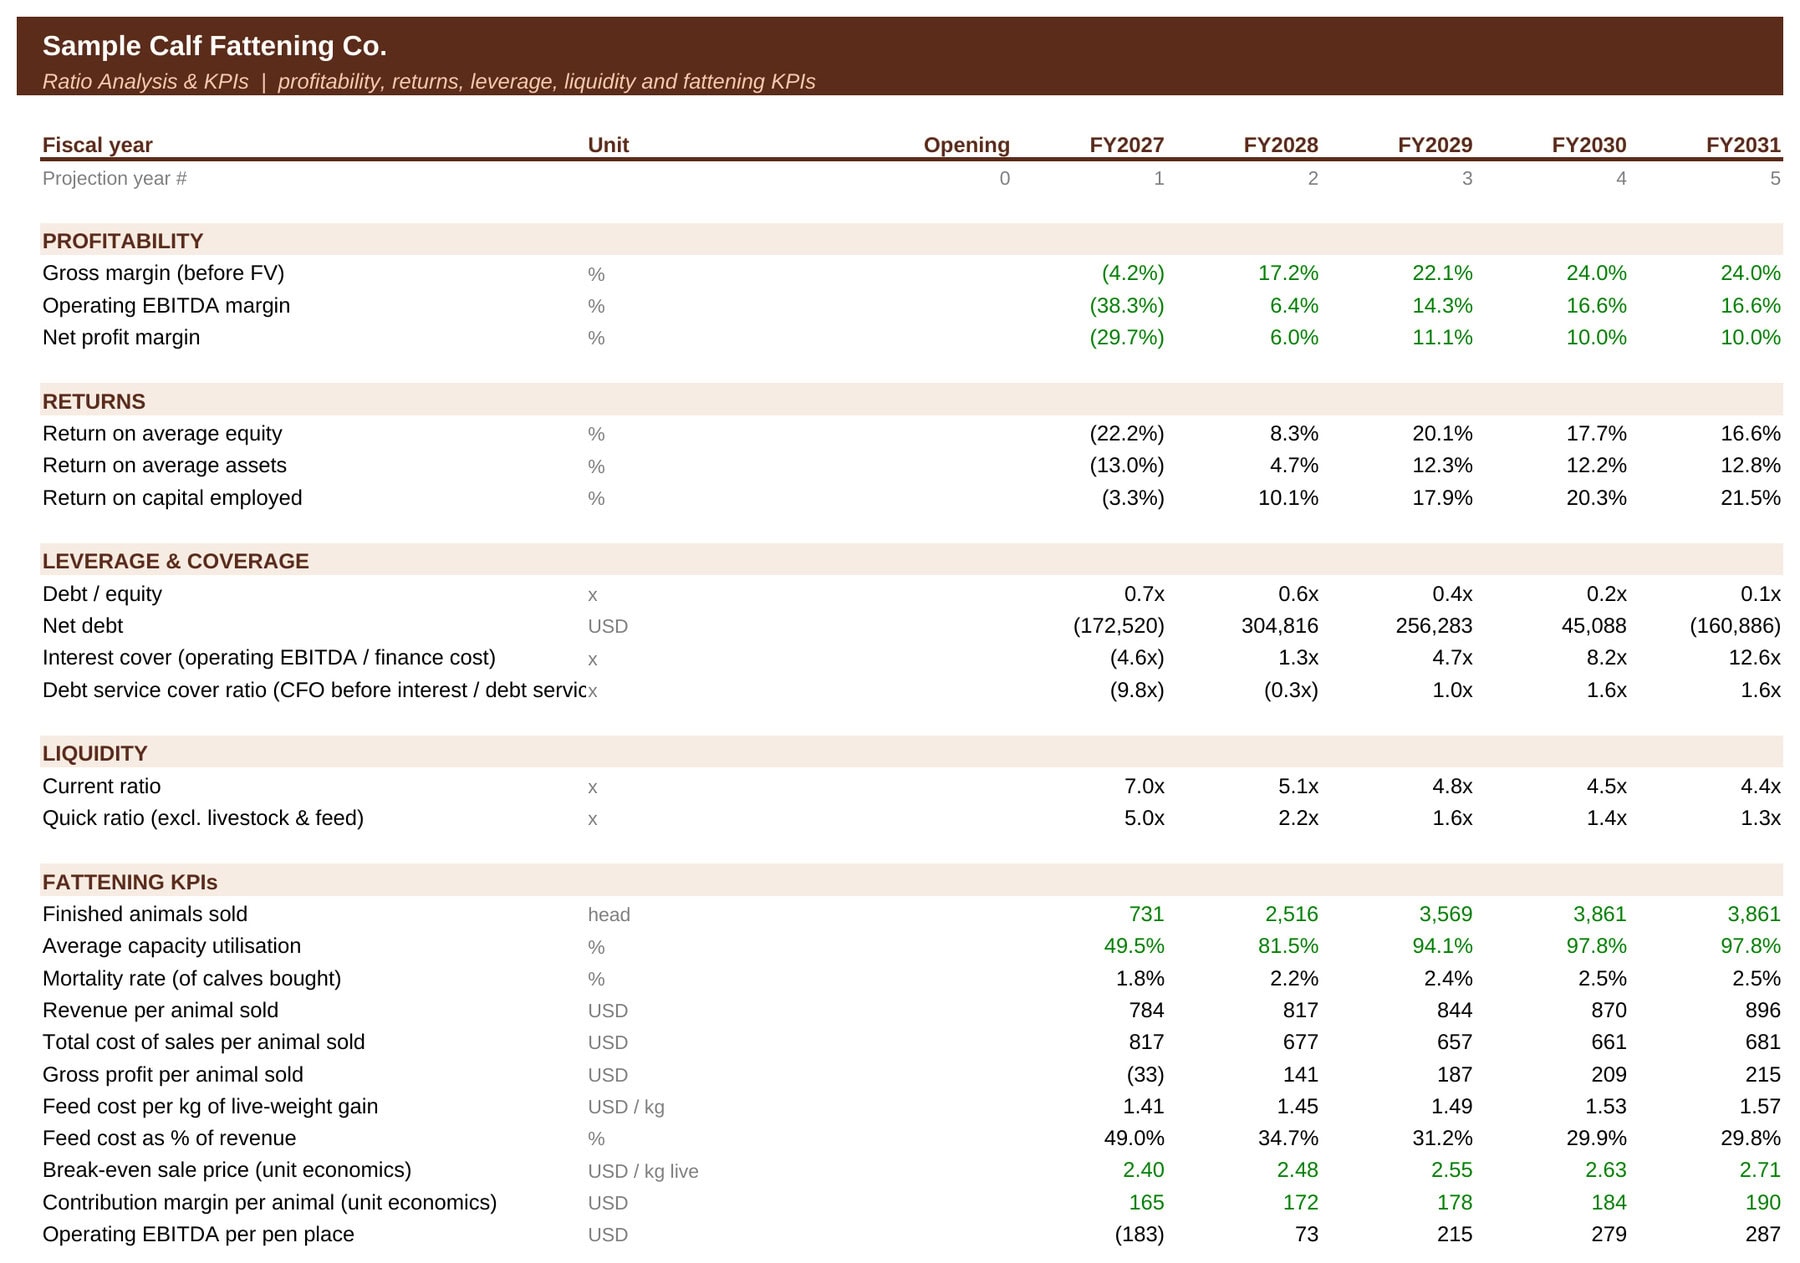
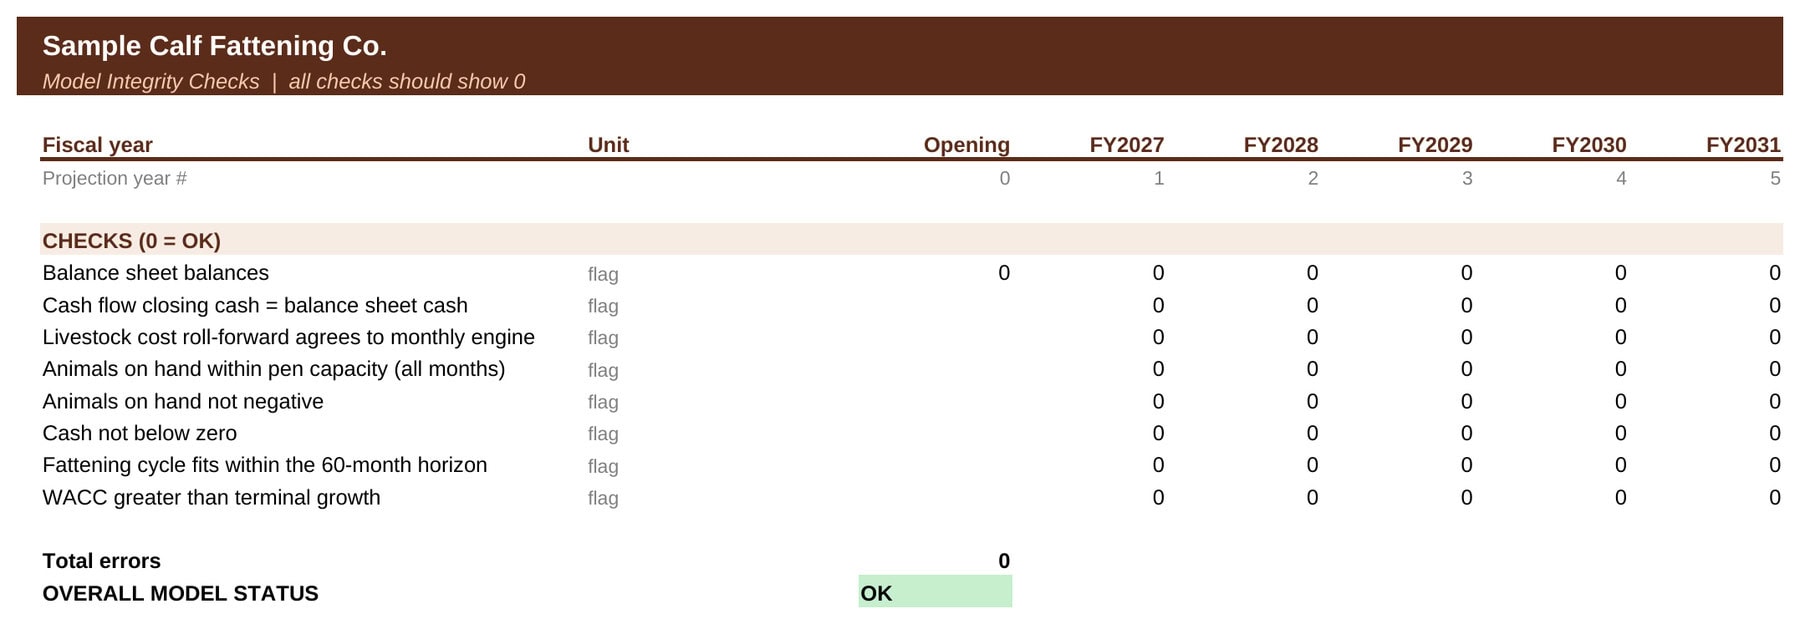
- Ratios & checks: profitability, ROE, ROCE, DSCR, liquidity and fattening KPIs. Integrity checks feed an overall OK / ERROR status.
How to work with this template
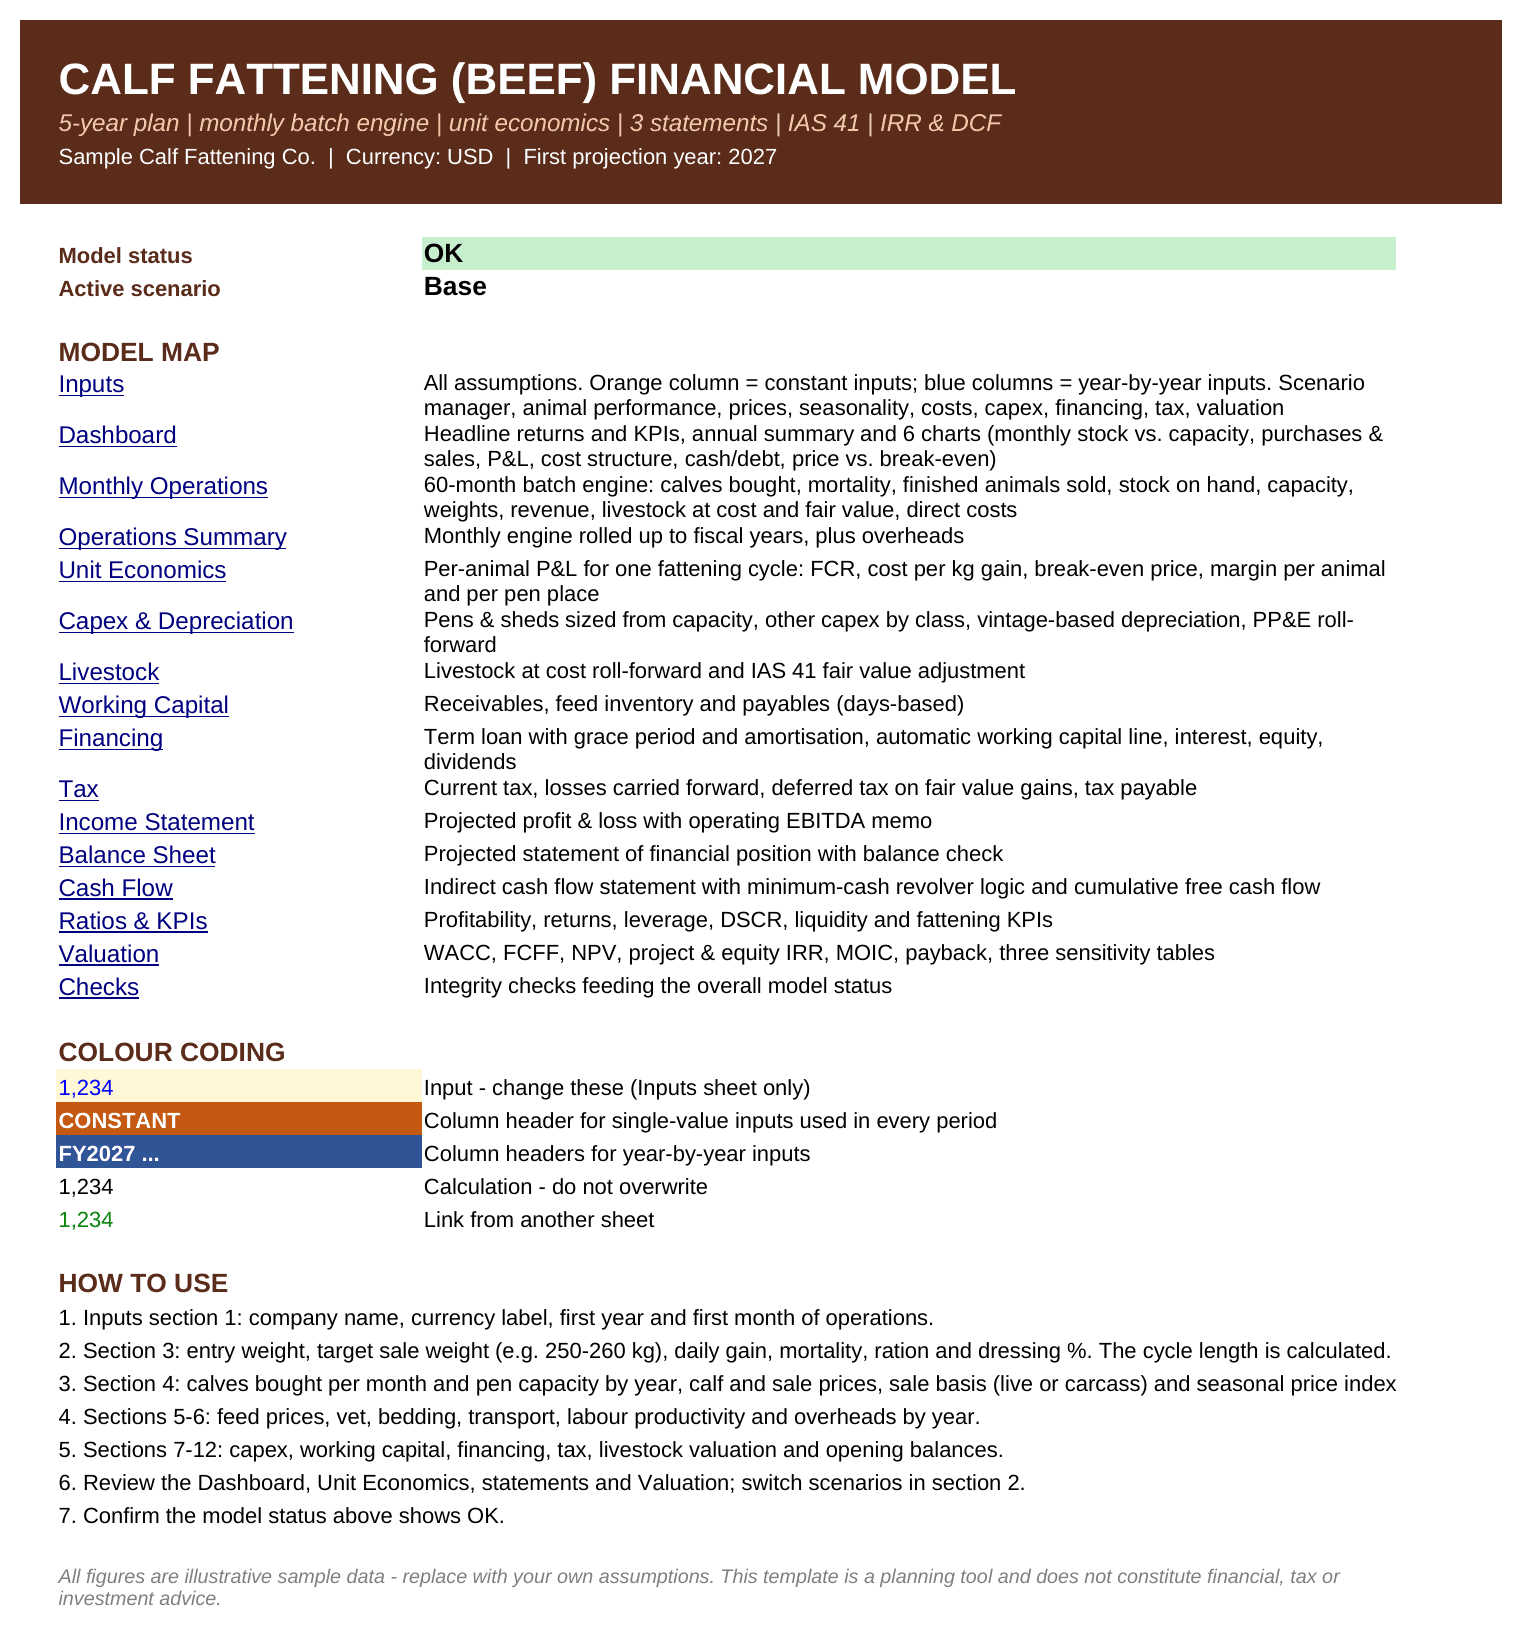
- In Inputs, enter the company name, first year and first month of operations.
- Set the animal performance assumptions. The cycle length updates automatically.
- Enter calves purchased per month, pen capacity and prices by year, then choose live or carcass sale basis and adjust the seasonal index.
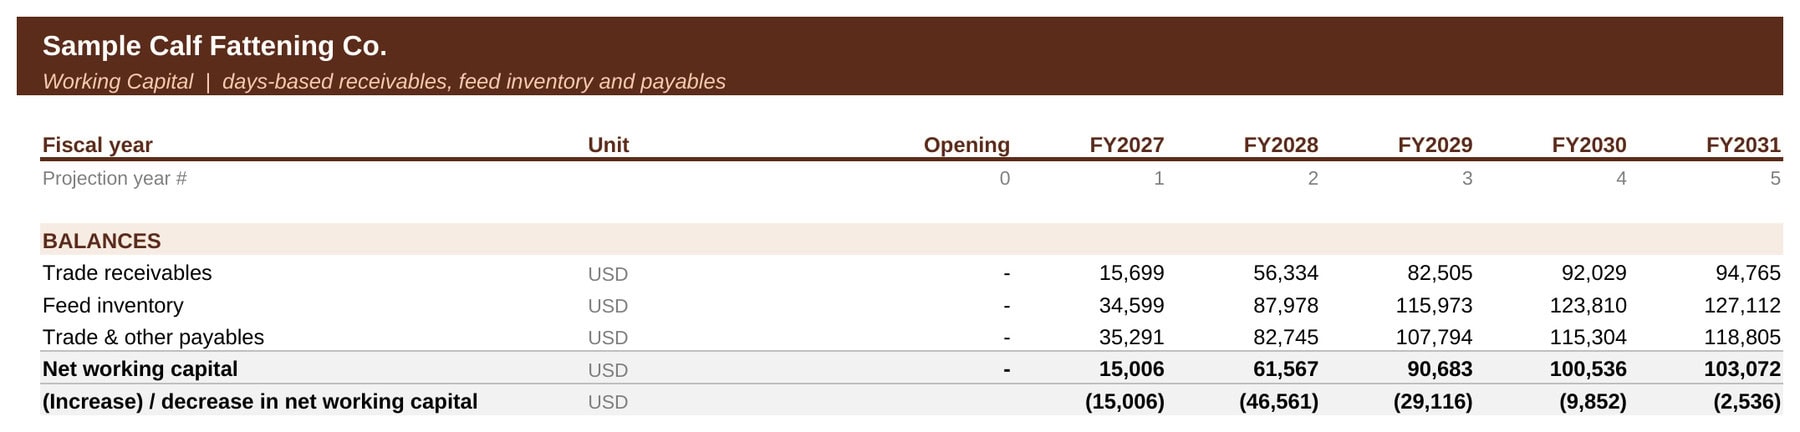
- Enter costs, overheads, capex, working capital, financing and tax.
- Review the Dashboard, Unit Economics, financial statements and Valuation. Switch scenarios to stress-test the plan.
- Make sure the model status on the Cover sheet shows OK.
The model has no macros: it contains 3,800+ live formulas across 17 sheets and uses a consistent colour code. It works in Excel, Google Sheets and LibreOffice.
Why you need this template
Feedlot profitability depends on a few variables that interact over time: the calf-to-meat price spread, daily weight gain, feed cost, mortality and how full the pens are. This model shows how each of them affects margin per animal, cash needs and returns month by month. That lets you size the project, plan funding and present a credible case to lenders and investors.
All figures are illustrative sample data. Replace them with your own assumptions.
Similar ProductsOther customers were also interested in...



 eFinancialModels
Electric Vehicle (EV) Charging Station Financial M...
With this comprehensive 5- or 10-year monthly tool, investors can assess the viability of setting up... Read more

Financial Model for Mobile App | Mobile App Busine...
The Mobile App Financial Plan Template in Excel allows you to develop financial projections when lau... Read more

 HenrySheykin
Food Truck Financial Model Excel Template
The Food Truck Financial Model helps entrepreneurs, founders, business owners, consultants, and anal... Read more

Green Hydrogen Production from Wind Energy Financi...
The Green Hydrogen from Wind Financial Model aims to comprehensively forecast a horizon of 40 years ... Read more

Simple Mutual Non-Disclosure Agreement Template
Protect your business secrets with ease using our Simple Mutual Non-Disclosure Agreement Template. S... Read more

Solar Energy Financial Model
The Solar Energy Financial Model Spreadsheet Template in Excel assists you in preparing a sophistica... Read more

 Peter Graf
The Customer-Centric Financial Model for Restauran...
Starting a restaurant without a financial plan is like driving a car blindfolded. You wouldn´t do i... Read more
You must log in to submit a review.