
0 ITEMS

Bingo Hall Business Plan Financial Model Excel Template
The Bingo Hall Financial Model helps users turn a bingo venue concept into a structured, editable financial forecast for launch, funding, or expansion planning. It is built for entrepreneurs, business owners, consultants, analysts, founders, and anyone preparing a bingo hall business plan, lender package, investor presentation, or internal budget. Instead of starting with a blank spreadsheet, users can work from a ready-to-use model that connects revenue assumptions, startup costs, operating expenses, payroll, cash flow, profitability, and financial outputs in one organized framework. This template is designed around the real economics of a bingo hall, including session attendance, average ticket prices, snack bar sales, merchandise, private events, sponsorships, prize payouts, venue costs, staffing, and other operating assumptions. Users can update the inputs to reflect their local market, planned capacity, event calendar, pricing strategy, and cost structure. The model then helps translate those assumptions into practical projections that show how the business may perform over time, where margins are created, and which drivers have the strongest impact on results. For funding and decision-making, the Bingo Hall Financial Model provides a professional way to estimate initial capital needs, forecast monthly and annual results, review cash flow, test Low, Base, and High scenarios, and understand the path to profitability. It supports planning questions such as how many visitors are needed, how much should be charged per session, how food and beverage sales affect total revenue, what level of payroll is sustainable, and when the venue may reach break-even. This makes it useful for both new bingo halls and existing entertainment venues evaluating a new gaming or community event format. The model is fully customizable and compatible with Excel and Google Sheets, allowing users to adapt assumptions, refine projections, and share results with partners, advisors, lenders, or investors. With pre-built dashboards, charts, reports, revenue breakdowns, KPI tracking, return metrics, and financial statement outputs, it gives users a clearer view of business performance before committing capital. Whether used to validate a concept, prepare a funding request, compare strategic options, or manage growth, this financial model template helps make bingo hall planning more organized, transparent, and decision-ready.
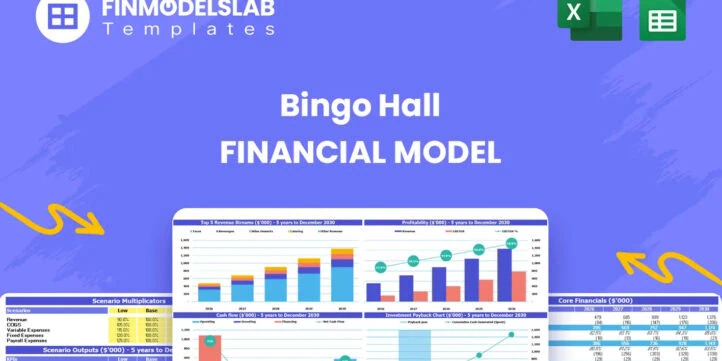


Financial Model Overview
The Bingo Hall Financial Model is a ready-to-use financial model template created for planning, launching, funding, or expanding a bingo hall business. It gives entrepreneurs, business owners, consultants, analysts, and planning teams a structured way to estimate revenue, startup investment, operating costs, staffing needs, cash flow, profitability, and investor returns without building a spreadsheet from scratch. A bingo hall has several moving parts, including session ticket sales, food and beverage revenue, private event bookings, sponsorships, prize payouts, venue expenses, equipment, payroll, and marketing. This model brings those assumptions into one connected framework so users can understand how the business may perform over a five-year forecast period. By updating the editable inputs, users can test different visitor volumes, pricing strategies, cost structures, launch budgets, and growth plans, then review the resulting financial statements, dashboards, charts, and decision-making metrics. It is useful for preparing business plans, lender submissions, investor discussions, internal budgets, and operational forecasts.
All-in-One Dashboard
The all-in-one dashboard gives users a central view of the most important inputs and outputs in the Bingo Hall Financial Model. This component is designed to make the model easier to navigate by bringing together core assumptions, summary results, and high-level performance indicators in one place. Users can review key drivers such as attendance, ticket pricing, snack bar activity, event bookings, operating costs, payroll, startup capital, revenue growth, EBITDA, net income, and cash position without searching through every worksheet. The dashboard helps translate detailed spreadsheet calculations into a practical business summary, making it especially useful for founders and decision-makers who need a quick understanding of whether the bingo hall plan is financially viable. It can also support conversations with lenders, investors, partners, and advisors by presenting the overall forecast in a clear format. Because the model is editable, the dashboard updates as users change assumptions, allowing them to immediately see how different decisions may affect revenue, expenses, cash flow, profitability, and funding needs.
Low, Base, and High Scenario Analysis
The Low, Base, and High scenario analysis component helps users compare different possible outcomes for the bingo hall rather than relying on one fixed forecast. This section allows users to stress-test the business plan by adjusting assumptions such as visitor growth, average ticket price, snack bar spend, event booking volume, sponsorship income, prize payout percentages, rent, staffing levels, and marketing costs. The Low scenario can be used to model a slower launch, weaker attendance, or higher cost environment, while the Base scenario can represent the expected operating plan and the High scenario can show upside potential if attendance, pricing, and ancillary revenue outperform expectations. The outputs help users compare revenue, gross margin, EBITDA, cash flow, profitability, and ending cash balances under different conditions. This is valuable for planning because a bingo hall is affected by local demand, seasonality, customer loyalty, event programming, and operating discipline. Scenario analysis gives users a more resilient forecast and helps identify which assumptions carry the most risk before committing capital or presenting the plan to stakeholders.
Professional Charts
The professional charts component turns key financial results into visual reports that are easier to understand, present, and discuss. Instead of reviewing only rows of numbers, users can use charts to show revenue growth, expense trends, profitability, cash flow movement, margin development, and other important performance patterns across the forecast period. For a bingo hall, this is especially useful because the business may depend on a combination of recurring bingo sessions, snack bar activity, private events, merchandise, ATM fees, and sponsorship revenue. Charts can help show how each part of the business contributes to growth and how operating leverage improves as attendance increases. This component is useful for investor presentations, lender meetings, business plan documents, internal reviews, and management discussions. It helps users communicate complex financial projections in a more accessible way, making it easier for non-financial stakeholders to understand the business model. As assumptions are updated, the visual outputs can reflect the new forecast, allowing users to compare strategies and present a polished financial story.
ROE Components and DuPont Analysis
The ROE components and DuPont analysis section helps users evaluate return on equity by breaking performance into the underlying drivers that shape investor returns. Rather than looking only at final profit, this component can separate the impact of profitability, asset efficiency, and financial leverage, giving users a deeper understanding of how the bingo hall generates returns. Inputs and outputs may include net income, revenue, total assets, equity, margins, asset turnover, and leverage-related metrics. For a bingo hall, this can help users understand whether returns are being driven mainly by strong operating margins, efficient use of venue assets and equipment, or the way the business is financed. This is useful for investors and owners because it connects operational decisions to capital performance. For example, improving snack bar margins, increasing session attendance, managing renovation costs, or controlling debt levels can all influence return metrics. DuPont analysis gives the financial model a more analytical layer and helps users explain not only what the projected return is, but why that return is expected.
Revenue Inputs
The revenue inputs component is where users define the commercial assumptions that drive the bingo hall forecast. This section may include expected bingo session visits, average ticket price, session frequency, snack bar customer counts, average food and beverage spend, merchandise sales, private event bookings, sponsorship income, ATM fees, and other ancillary revenue streams. For a bingo hall, revenue is not usually generated from one source alone, so this section helps users build a more complete view of how the venue earns money. The model may include researched or pre-populated assumptions that can be edited to reflect the user’s specific location, venue size, customer base, pricing strategy, and launch plan. Once entered, these inputs flow into revenue projections, cash flow forecasts, profitability calculations, and summary reports. This component is important because small changes in attendance, pricing, repeat visits, or average spend per visitor can have a major effect on results. By clearly documenting revenue assumptions, users can create a more credible and defensible forecast for planning, funding, and operational decision-making.
Bank-Ready Reports
The bank-ready reports component provides lender-friendly financial outputs that help users present the bingo hall plan in a professional and organized format. This section may include projected profit and loss statements, cash flow forecasts, balance sheet summaries, debt-related schedules, profitability measures, and key financial indicators that banks and financing partners typically review. For a bingo hall seeking funding, lenders will want to understand how startup costs are funded, how revenue is generated, whether monthly cash flow can support operating needs, and whether the business can meet repayment obligations. This component helps convert detailed assumptions into formal financial reports that can be shared as part of a loan application, funding package, or business plan. It is also useful for internal review because it shows how the business performs over time and whether the planned capital structure is realistic. With editable inputs and automated calculations, users can update assumptions and quickly produce revised reports, making it easier to respond to lender questions or compare financing alternatives.
Revenue Breakdown
The revenue breakdown component provides a detailed view of each revenue stream in the bingo hall business model. Instead of showing only total revenue, this section helps users see how much income may come from bingo session tickets, snack bar and beverage sales, merchandise, private events, sponsorships, ATM fees, and other supplemental sources. This level of detail is valuable because it allows users to evaluate the mix of revenue and identify which areas deserve the most attention. For example, a venue may discover that snack bar revenue improves overall margins, private events add profitable off-peak income, or sponsorships create additional upside without the same level of variable cost. Inputs may include volume, pricing, growth rates, utilization, average order values, event frequency, and customer participation assumptions. Outputs can include monthly and annual revenue by category, percentage contribution by stream, and growth trends across the forecast period. This component supports pricing strategy, marketing planning, staffing decisions, inventory planning, and investor communication by showing exactly how the bingo hall is expected to generate sales.
KPI Dashboard
The KPI dashboard component focuses on the operating and financial metrics that help users monitor performance against plan. A bingo hall can be measured through indicators such as session attendance, average ticket price, revenue per visitor, snack bar conversion, average food and beverage spend, event booking volume, gross margin, EBITDA margin, cash balance, payroll as a percentage of revenue, prize payouts as a percentage of ticket sales, and break-even progress. This section helps users move beyond total revenue and profit by tracking the drivers behind those results. It can also include performance benchmarks that allow users to compare assumptions against industry expectations or internal targets. The KPI dashboard is useful for both pre-launch planning and ongoing management because it highlights whether the business is moving in the right direction. If attendance is below plan, margins are narrowing, or payroll is growing too quickly, the dashboard can help users identify the issue early. For stakeholders, it provides a concise performance summary that supports clearer decision-making and accountability.
Startup Cost Breakdown
The startup cost breakdown component organizes the initial capital required to prepare the bingo hall for opening. This section can include venue buildout and renovation, bingo equipment, kitchen or snack bar equipment, furniture, fixtures, signage, point-of-sale systems, licensing, permits, deposits, pre-opening payroll, initial marketing, insurance, professional fees, technology setup, and working capital reserves. For a bingo hall, startup costs can be significant because the venue may require specialized equipment, seating arrangements, lighting, sound systems, kitchen preparation areas, compliance-related expenses, and customer-facing improvements before operations begin. This component helps users estimate how much funding is needed before revenue starts and separates one-time launch expenses from ongoing operating costs. Outputs may include total startup capital required, category-level cost summaries, funding gaps, and assumptions that flow into cash flow and financing plans. This is important for business planning and funding because it helps prevent undercapitalization, supports more accurate loan or investor requests, and gives founders a clearer understanding of the cash needed to reach opening day.
Break-Even Analysis
The break-even analysis component helps users estimate when the bingo hall may generate enough revenue to cover its fixed and variable costs. This section can use inputs such as ticket pricing, visitor volume, snack bar margin, event income, prize payouts, rent, payroll, utilities, marketing, insurance, supplies, and other operating expenses to calculate the point at which the business moves from loss to profitability. For a bingo hall, break-even is a critical planning metric because attendance and average spend must be high enough to support venue costs and staff requirements. The analysis can help users understand how many monthly visits, sessions, or revenue dollars are needed to cover expenses, as well as how changes in pricing or cost structure affect the timeline to profitability. Outputs may include break-even month, required revenue, contribution margin, cumulative cash position, and profitability milestones. This component is useful for launch planning, investor communication, and operational decision-making because it clarifies the minimum performance level required for the business to become sustainable.
File types:
Excel – Single-User: .xlsx
Excel – Multi-User: .xlsx
Similar ProductsOther customers were also interested in...





 HenrySheykin
Casino Hotel Financial Model Excel Template
The Casino Hotel Financial Model helps users build a structured five-year forecast for an integrated... Read more
Trampoline Park Business Financial Model Excel Tem...
The Trampoline Park Financial Model helps entrepreneurs, founders, consultants, analysts, and busine... Read more
Game Center Business Plan Financial Model Excel Te...
The Game Center Financial Model Financial Model Template helps entrepreneurs, founders, business own... Read more
Arcade Business Plan Financial Model Excel Templat...
The Arcade Financial Model helps users turn an arcade, game room, or family entertainment center con... Read more
Paintball Financial Model Excel Template
The Paintball Financial Model helps entrepreneurs, founders, consultants, analysts, and business own... Read more
 Giorgos
Golf & Entertainment Center – 5 Year Financi...
Financial Model providing an advanced 5-year financial plan for a startup or operating Golf & En... Read more
Escape Room Financial Model – 5 Year Forecast
Financial Model providing an advanced 5-year financial plan for a startup or operating Escape Room B... Read more
Family Entertainment Center – 5 Year Financial M...
Financial Model providing an advanced 5-year financial plan for a startup or operating Family Entert... Read more
Bowling & Billiards Center – Dynamic 10 Year...
Financial Model providing a dynamic up to 10-year financial forecast for a startup or existing Bowli... Read more
 Jair
Jair
Indoor Golf Business Model
This template is a detailed and user-friendly financial model that takes into account the specifics ... Read more
You must log in to submit a review.