
0 ITEMS

Catering Financial Model Excel Template
The Catering Service Financial Model helps users turn a catering business plan into a structured, editable financial forecast. Instead of relying on rough estimates or disconnected spreadsheets, this template brings the key assumptions of a catering operation into one planning framework, including revenue drivers, event volume, average order value, service mix, startup costs, operating expenses, payroll, cash flow, profitability, and investor-focused outputs. It is designed to help users understand where the numbers come from and how changes in pricing, bookings, staffing, food costs, and overhead can affect the overall financial outlook. This financial model template is useful for entrepreneurs launching a new catering service, existing operators planning expansion, consultants preparing client deliverables, analysts building forecasts, and founders creating business plans or funding documents. Catering businesses often have several moving parts, from private events and food sales to staffing schedules, kitchen equipment, supplier costs, deposits, and working capital needs. The model helps organize these details into a clear forecast so users can evaluate whether the business has enough revenue potential to cover its cost structure and reach sustainable profitability. The template supports practical financial planning and decision-making by connecting assumptions to projected results. Users can adjust revenue assumptions, review cost of goods sold, estimate payroll and operating expenses, track cash flow, and analyze profit performance over time. It can also help identify funding needs, test different planning cases, prepare bank-ready reports, and communicate financial expectations to investors, lenders, partners, or internal stakeholders. Built-in dashboards, charts, KPIs, and financial statements make it easier to review the business from both an operational and investment perspective. Because the Catering Service Financial Model is fully customizable, users can adapt it to different catering formats, pricing strategies, event sizes, service categories, and growth plans. It is suitable for startup planning, fundraising preparation, budget control, performance tracking, and strategic review. Whether the goal is to validate a new catering concept, prepare a loan application, model investor returns, or understand the break-even point, this template provides a ready-to-use structure for building a credible catering business forecast without starting from scratch.


Financial Model Overview
The Catering Service Financial Model is a ready-to-use financial model template built to help entrepreneurs, business owners, consultants, analysts, and founders plan the financial side of a catering business with greater structure and clarity. Catering companies depend on a mix of event volume, average order value, menu pricing, staffing efficiency, food and beverage costs, equipment investment, deposits, and recurring operating expenses, so a reliable forecast needs to connect all of these variables in one place. This template gives users a practical framework for estimating revenue, startup investment, cost of goods sold, payroll, cash flow, profitability, investor returns, and break-even timing over a multi-year forecast period. It is designed for business planning, funding preparation, budgeting, scenario testing, and stakeholder presentations, helping users replace disconnected assumptions with an organized model that can be customized for their specific market, service mix, pricing strategy, and growth plan.
All-in-One Dashboard
The all-in-one dashboard gives users a central view of the most important inputs and outputs in the Catering Service Financial Model. Instead of navigating through multiple disconnected sheets to understand the business, users can review high-level assumptions, forecast results, key metrics, and financial performance indicators in one organized area. This section may include core assumptions such as event volume, covers per day, average order value, revenue mix, gross margin, staffing costs, fixed expenses, startup investment, and funding needs, then connect those assumptions to outputs such as revenue, EBITDA, net profit, cash balance, and payback timing. For planning and decision-making, this dashboard is useful because it allows users to quickly see whether the catering business is financially viable, identify the assumptions that drive results, and communicate the overall business case to investors, lenders, partners, or internal teams without requiring them to review every detailed calculation in the model.
Low, Base, and High Scenario Analysis
The low, base, and high scenario analysis section helps users stress-test the catering business under different operating conditions. A catering plan can change significantly if event bookings are lower than expected, food costs rise, weekend demand grows faster than planned, or pricing needs to be adjusted to match local competition, so the model provides a structured way to compare multiple outcomes. Users can create a conservative case, a realistic base case, and an upside case by adjusting assumptions such as daily covers, average order value, private event volume, sales mix, ingredient cost percentages, staffing levels, marketing spend, and ramp-up speed. The outputs help show how revenue, gross profit, cash flow, EBITDA, and investor returns may change under each case. This is especially useful for funding discussions and management planning because it helps users understand not only the target outcome, but also the risks, downside exposure, and potential upside if the catering service performs better than expected.
Professional Charts
The professional charts section turns the financial model’s calculations into visual outputs that are easier to interpret and present. Catering financial plans often include many variables, including multiple revenue streams, direct costs, payroll, fixed overhead, capital expenditures, and cash movements, so charts help users communicate the story behind the numbers more clearly. This component may visualize revenue growth, profit trends, EBITDA progression, gross margin, cost structure, cash balance, break-even timing, funding requirements, or scenario comparisons. The benefit of these visual reports is that they allow founders and business owners to quickly identify trends and explain financial performance to stakeholders who may not want to review a full spreadsheet. For pitch decks, bank meetings, internal planning sessions, or partner presentations, the charts help make the Catering Service Financial Model more presentation-ready and support faster, more informed decision-making.
ROE Components and DuPont Analysis
The ROE components section uses DuPont-style analysis to help users understand what is driving return on equity in the catering business. Instead of looking at return on equity as a single number, this component breaks performance into underlying drivers such as profitability, asset efficiency, and leverage, allowing users to see whether the business is generating returns through healthy margins, efficient use of assets, or financing structure. Inputs may include net income, revenue, total assets, equity, debt assumptions, capital investment, and operating performance metrics. The outputs help users analyze how changes in pricing, cost control, equipment utilization, working capital, or funding mix may affect shareholder returns. This is particularly valuable for investor-facing planning because it provides a deeper explanation of financial performance and helps show whether the catering service can generate attractive returns from the capital invested in kitchen equipment, leasehold improvements, fixtures, inventory, marketing, and operating setup.
Revenue Inputs
The revenue inputs section is where users define the commercial assumptions that drive the catering service forecast. This component may include assumptions for covers served, number of events, average order value, midweek bookings, weekend events, private parties, food sales, bar or beverage sales, brunch offerings, dinner service, corporate catering, and other revenue categories relevant to the business. Users can adjust these assumptions to reflect local demand, pricing strategy, venue capacity, service model, customer segment, and ramp-up expectations. The section is useful because revenue is one of the most important drivers of the entire model, and small changes in event volume or average order value can materially affect profitability and cash flow. By separating the key revenue assumptions from the financial statements, the model makes it easier to review, validate, and refine the sales forecast before using it for budgeting, fundraising, or operational planning.
Bank-Ready Reports
The bank-ready reports section provides lender-friendly financial outputs that help users prepare for loan applications, funding requests, and formal business planning. Banks and lenders usually want to see clear financial statements, realistic assumptions, repayment capacity, cash flow visibility, and evidence that the business can manage operating expenses while servicing debt. This component may include projected profit and loss statements, cash flow statements, balance sheets, debt schedules, funding requirements, and summary metrics that show profitability, liquidity, and repayment potential. For a catering service, this is especially important because startup capital may be needed for leasehold improvements, kitchen equipment, furniture, fixtures, initial inventory, deposits, licenses, insurance, and working capital. The reports help users present a more credible financial case by organizing the numbers in a professional format, making it easier for lenders, investors, or stakeholders to evaluate the business without relying on informal estimates.
Revenue Breakdown
The revenue breakdown section gives users a detailed view of how total revenue is generated across the catering service’s different income streams. Rather than showing only one revenue line, this component separates the business into categories such as cocktail and bar sales, dinner food sales, brunch food sales, private events, corporate functions, recurring catering clients, seasonal bookings, or other service lines depending on how the user customizes the model. Inputs may include pricing, customer volume, event count, sales mix percentages, average order values, and monthly growth assumptions. Outputs may show monthly and annual revenue by stream, contribution to total sales, year-over-year growth, and the relative importance of each revenue category. This is useful for planning because it helps users identify which services create the most income, which categories may deserve more marketing focus, and how changes in sales mix can affect margins, staffing needs, purchasing decisions, and overall profitability.
KPI Dashboard
The KPI dashboard section tracks the performance metrics that matter most for managing and evaluating a catering service. While financial statements show the accounting view of the business, KPIs help users understand operational and financial efficiency in a more practical way. This section may include metrics such as revenue per event, average order value, gross margin, food cost percentage, beverage cost percentage, labor cost percentage, EBITDA margin, cash balance, burn rate, return on equity, payback period, revenue growth, and break-even progress. It may also allow users to compare forecasted results with benchmark assumptions or target performance levels. For business owners and managers, the KPI dashboard is useful because it highlights whether the catering service is moving in the right direction and where corrective action may be needed. For investors and lenders, it provides a concise view of the model’s most important performance indicators and supports faster evaluation of the business plan.
Startup Cost Breakdown
The startup cost breakdown section helps users estimate the initial capital required before the catering service begins generating steady revenue. A catering business often needs meaningful upfront investment, including leasehold improvements, kitchen and bar equipment, furniture and fixtures, smallwares, delivery equipment, initial inventory, licensing, insurance, deposits, branding, website setup, pre-opening marketing, technology, professional fees, and working capital reserves. This component organizes these costs into a clear launch budget so users can understand how much funding may be needed and where the money will be spent. The outputs may include total startup investment, funding gap, capital expenditure summary, pre-opening expense totals, and cash reserve requirements. This is valuable for fundraising and budgeting because it reduces the risk of underestimating launch needs, helps users prepare more realistic funding requests, and gives investors or lenders a clearer view of how startup capital will support the opening and early operation of the catering service.
Break-Even Analysis
The break-even analysis section helps users identify when the catering service may reach the point where total revenue covers total costs. This component connects revenue assumptions, direct costs, payroll, fixed operating expenses, and contribution margins to estimate the sales level or time period required to become profitable. Users may evaluate break-even timing based on monthly revenue, number of events, covers served, average order value, gross margin, and overhead structure. The outputs can show the expected break-even month, the revenue required to cover costs, and how changes in pricing, sales volume, food costs, or staffing levels affect the path to profitability. This is important for decision-making because it helps founders understand how much operating runway they need, how aggressively they must book events, and whether their pricing and cost structure can support a sustainable business. For funding documents, the break-even analysis also provides a clear milestone that investors, lenders, and stakeholders can use to assess the risk and viability of the catering plan.
File types:
Excel – Single-User: .xlsx
Excel – Multi-User: .xlsx
Similar ProductsOther customers were also interested in...


 Giorgos
Cloud Kitchen Financial Model – 5 Year Financial...
A Cloud Kitchen—also referred to as a “ghost kitchen” or “virtual kitchen”—is a commerci... Read more
 anthony
Bundle – Business Financial Forecasting Mode...
The purpose of this Bundle of Business Forecasting and Financial Models is to assist Business Owners... Read more
 HenrySheykin
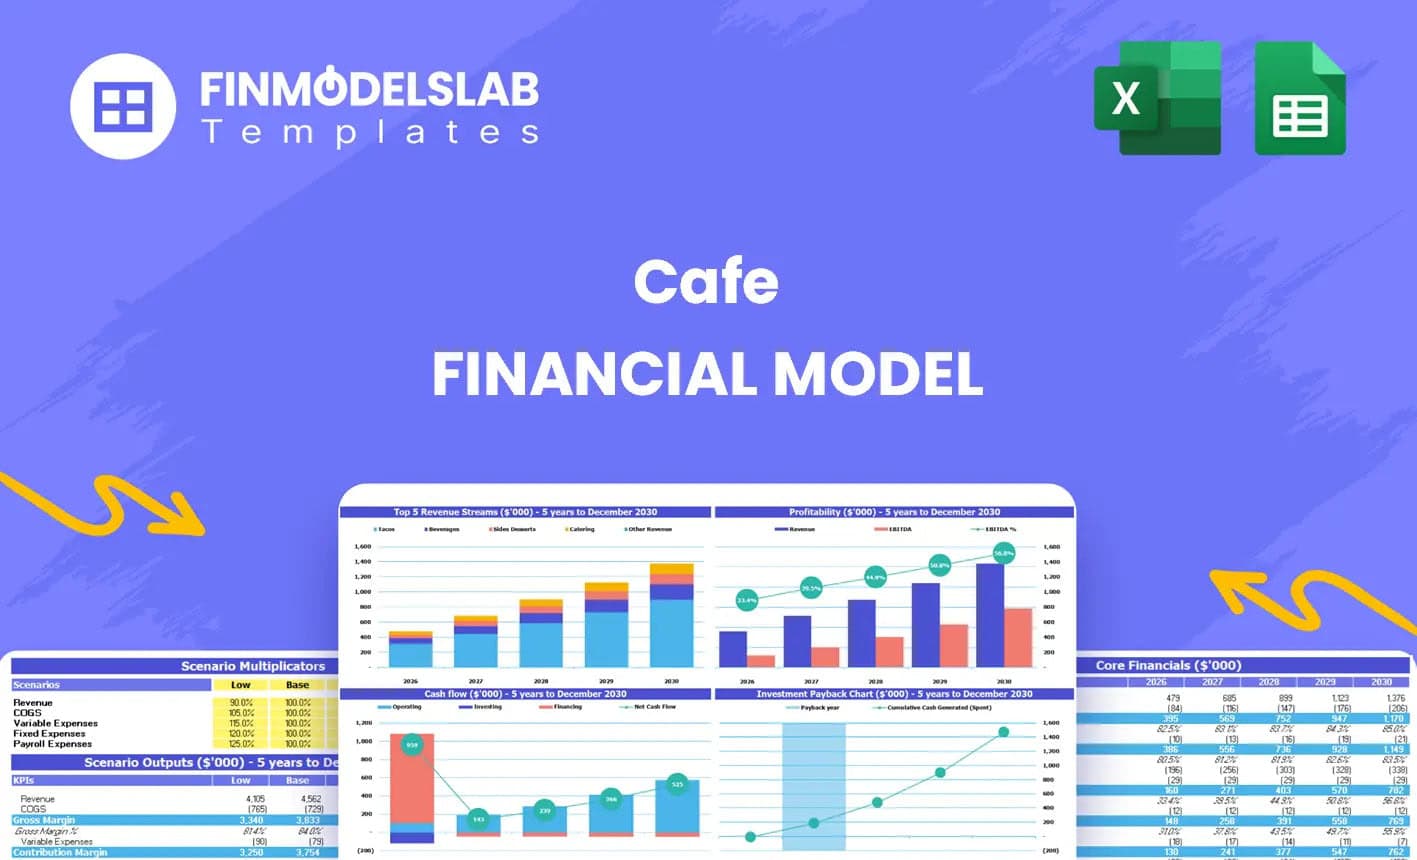
Cafe Financial Model Excel Template
The Cafe Financial Model is a ready-to-use financial model template designed to help entrepreneurs, ... Read more
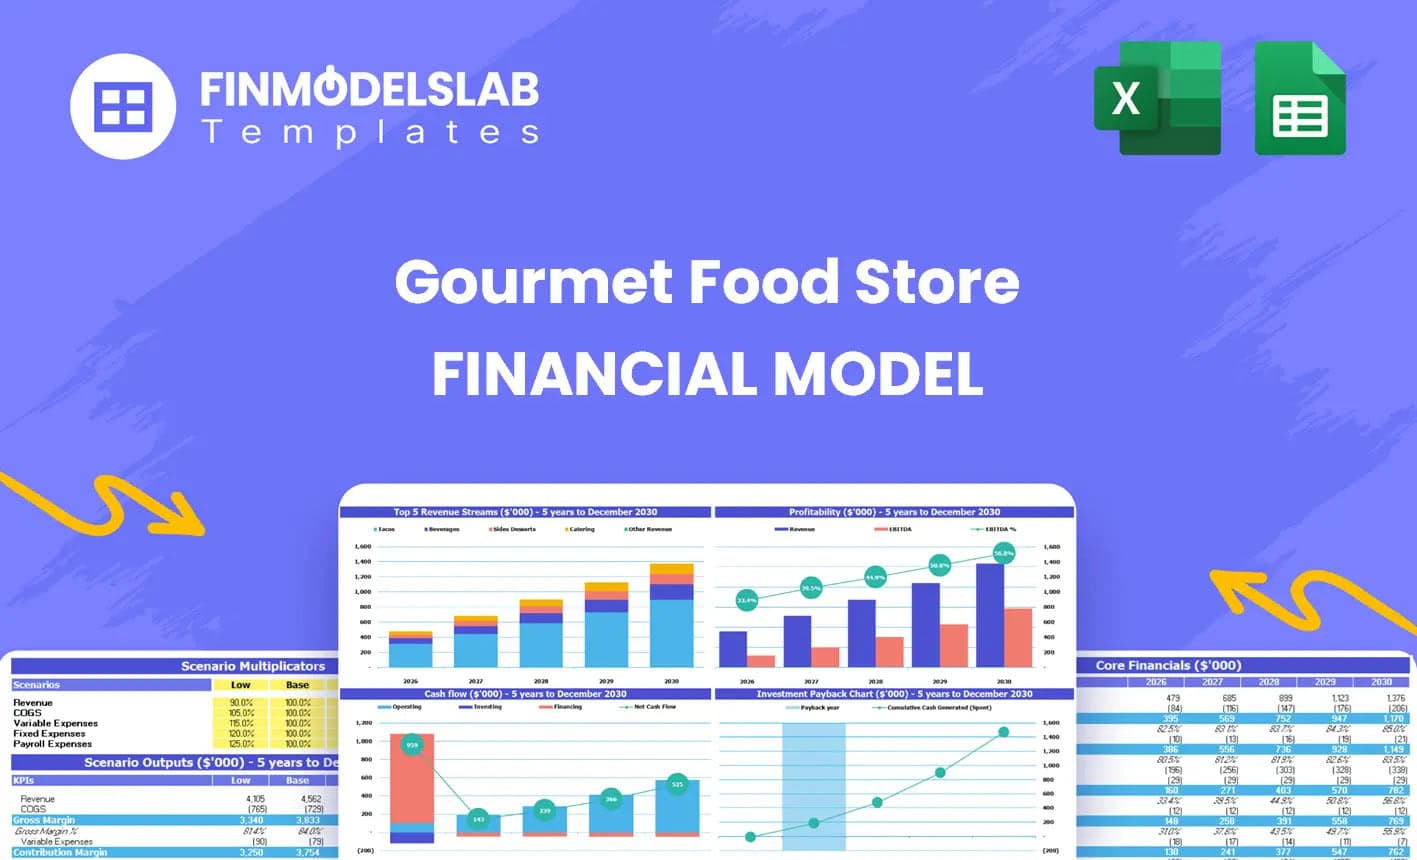
Gourmet Food Store Financial Model Excel Template
The Gourmet Food Store Financial Model helps entrepreneurs, founders, business owners, consultants, ... Read more
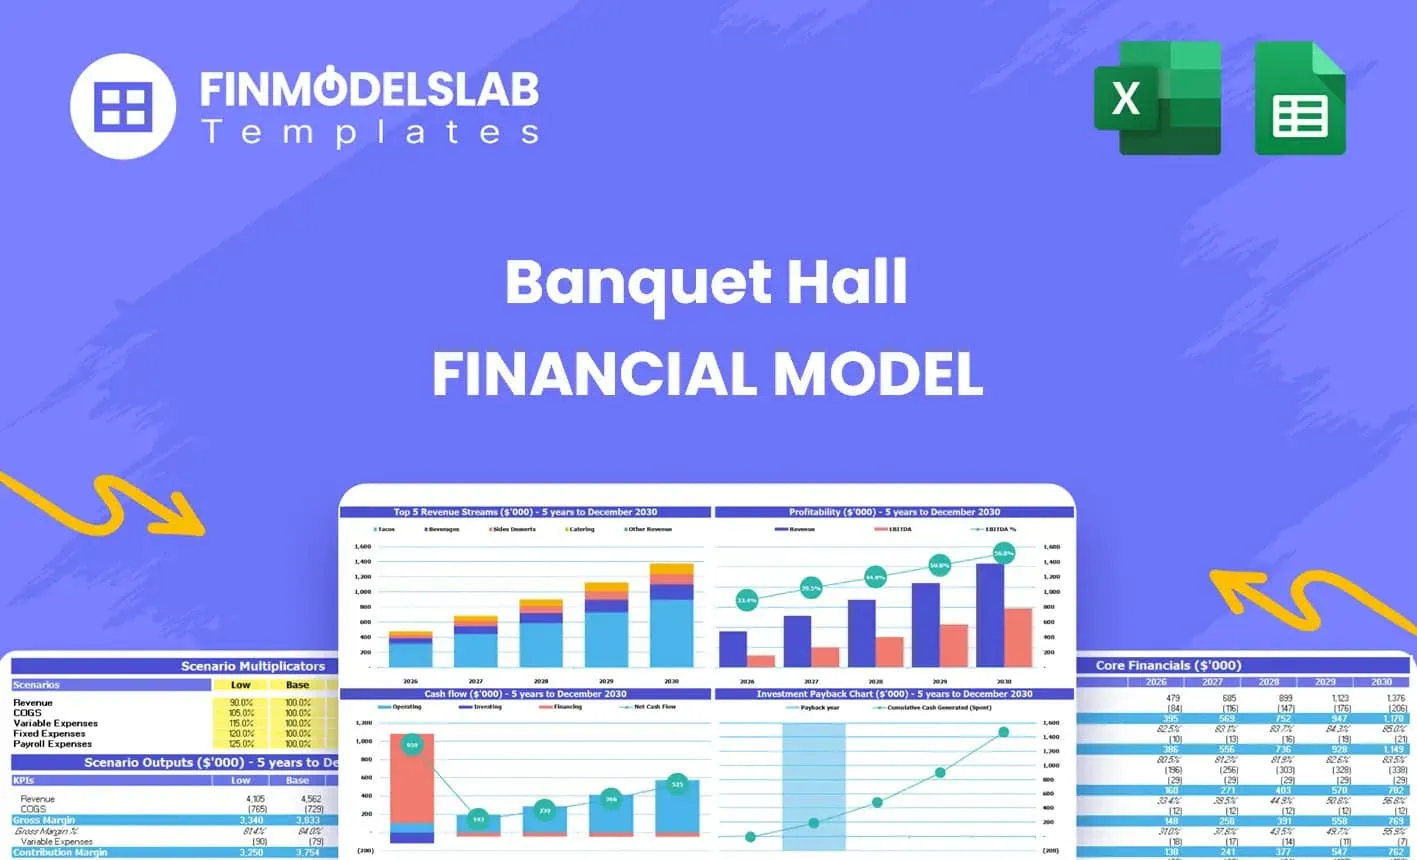
Banquet Hall Financial Model Excel Template
The Banquet Hall Financial Model helps entrepreneurs, venue owners, consultants, analysts, and busin... Read more

Buffet Financial Model Excel Template
The Buffet Restaurant Financial Model helps turn a buffet restaurant concept into a structured, edit... Read more
 Andreas
Catering Services Business Financial Model (10+ Yr...
The catering services business financial model is a comprehensive tool designed to analyze the finan... Read more
 Pushkar
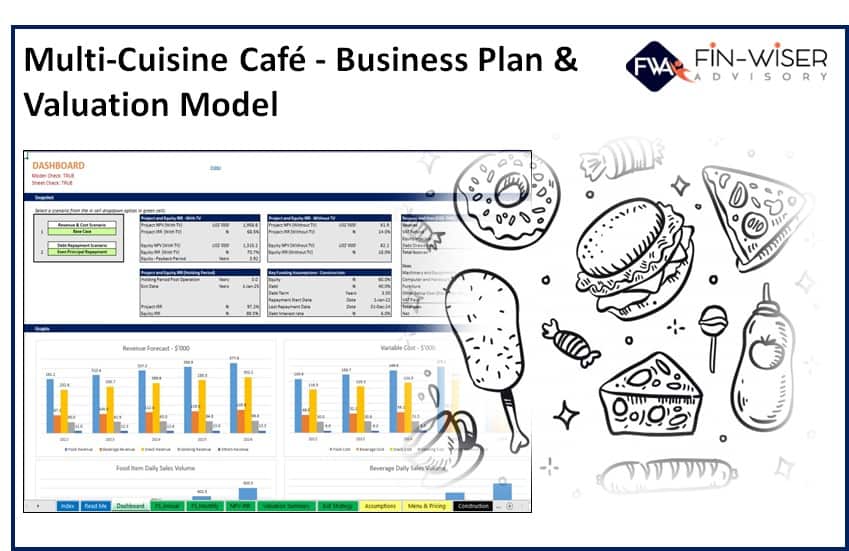
Multi Cuisine Cafe – 3 Statement Financial M...
This Multi-Cuisine Café business Plan Model is a perfect tool for a financial feasibility study on ... Read more

Golf & Entertainment Center – 5 Year Financi...
Financial Model providing an advanced 5-year financial plan for a startup or operating Golf & En... Read more
Food Truck Financial Model – 5 Year Financial Fo...
This Financial Model presents an advanced 5-year financial plan for a startup or operating Food Truc... Read more
You must log in to submit a review.