
0 ITEMS

Budget vs Actual, Rolling Forecast & Scenario Planning Model — FP&A Engine for Excel
A complete monthly financial planning system for SMEs and finance teams: driver-based budget, actuals import, budget vs actual variance, rolling forecast, three scenarios, cash flow, and a management dashboard, with 42 built-in integrity checks. No macros. Excel 2016 or later.
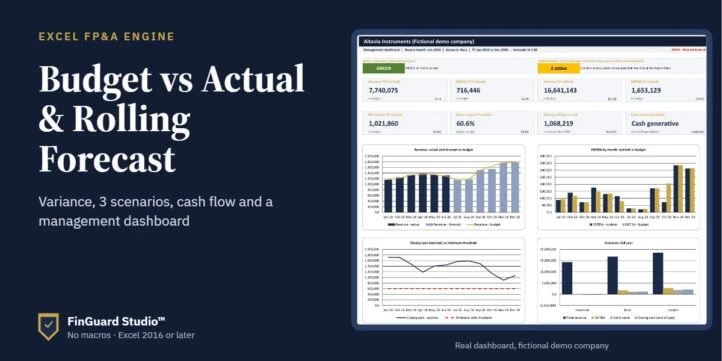
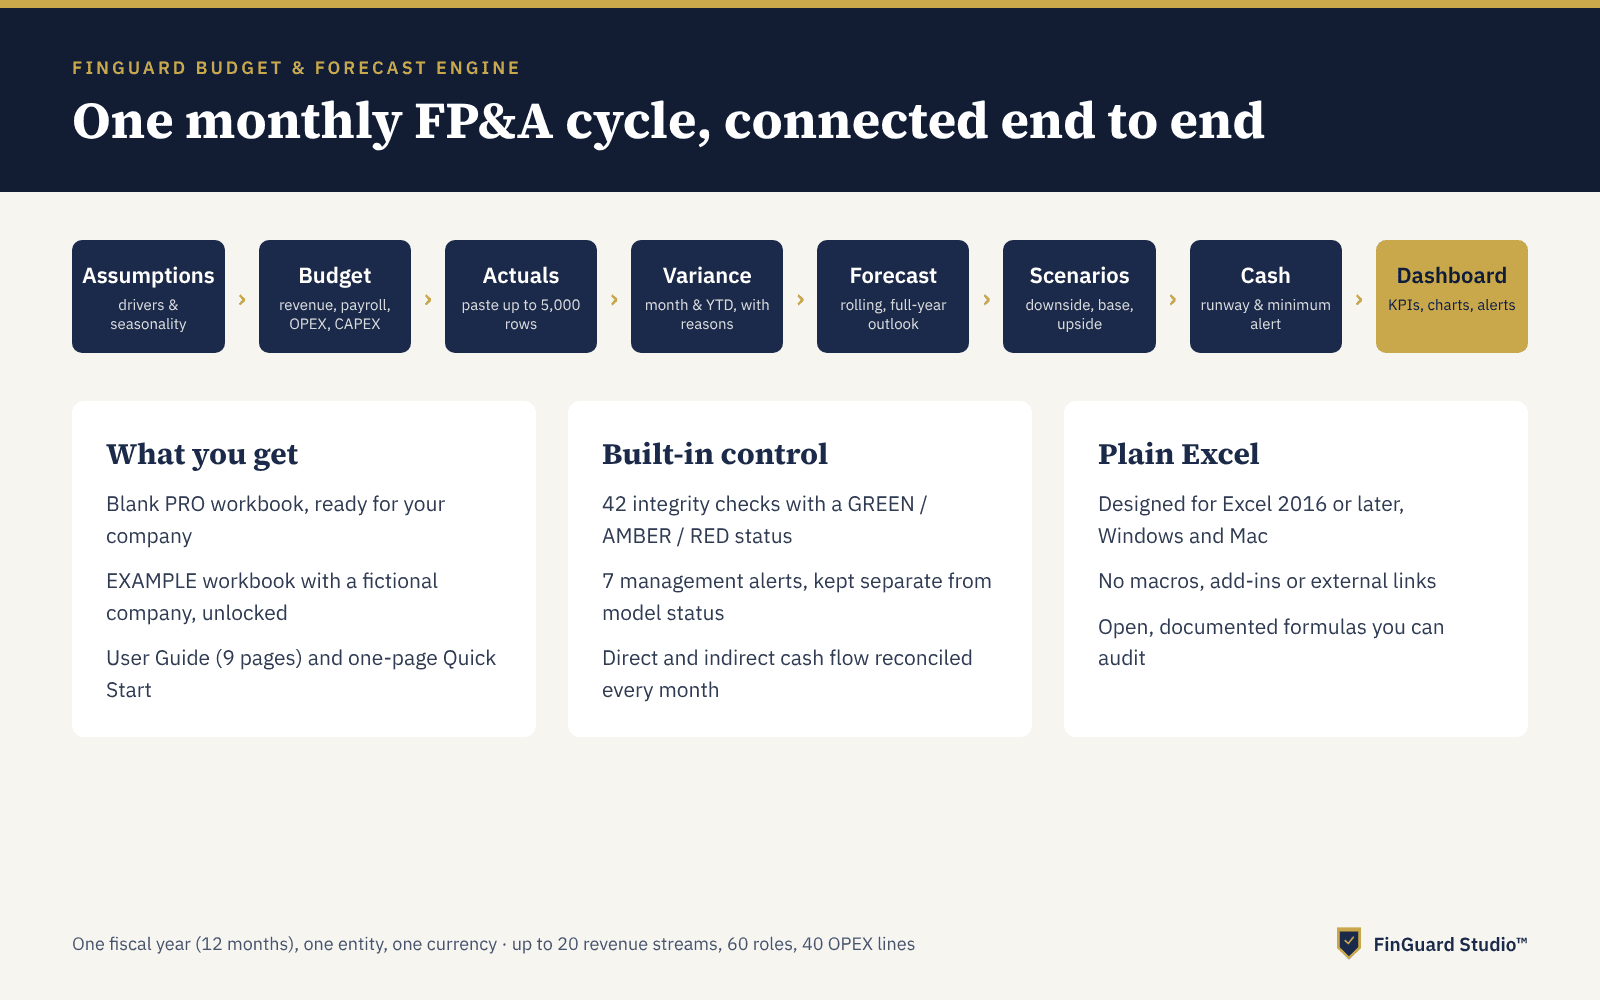
FinGuard Budget & Forecast Engine is a monthly FP&A system in Excel. It takes a finance team from assumptions to a management dashboard in one connected workflow:
Assumptions → Budget → Actuals → Variance → Rolling Forecast → Scenarios → Cash Flow → Dashboard → Actions
It is built for small and medium-sized businesses, startups, finance managers, FP&A analysts, controllers, and consultants who need more than a budget template, without paying for planning software.
What the model does
Driver-based budget. Revenue is built from volume and price per stream, with growth, seasonality, and price increases. Payroll comes from a headcount plan by department, with hires, leavers, benefits, employer costs, and a salary increase month. Operating expenses can be fixed or variable, with inflation and monthly phasing. CAPEX items carry their own useful life and straight-line depreciation.
Actuals import. Paste up to 5,000 rows exported from any accounting system (month, department, account, amount). An account map links your chart of accounts to the model’s P&L lines. Unmapped accounts, invalid dates, duplicates, and months outside the fiscal year are flagged automatically, and a sign-convention setting handles systems that export revenue as negative numbers.
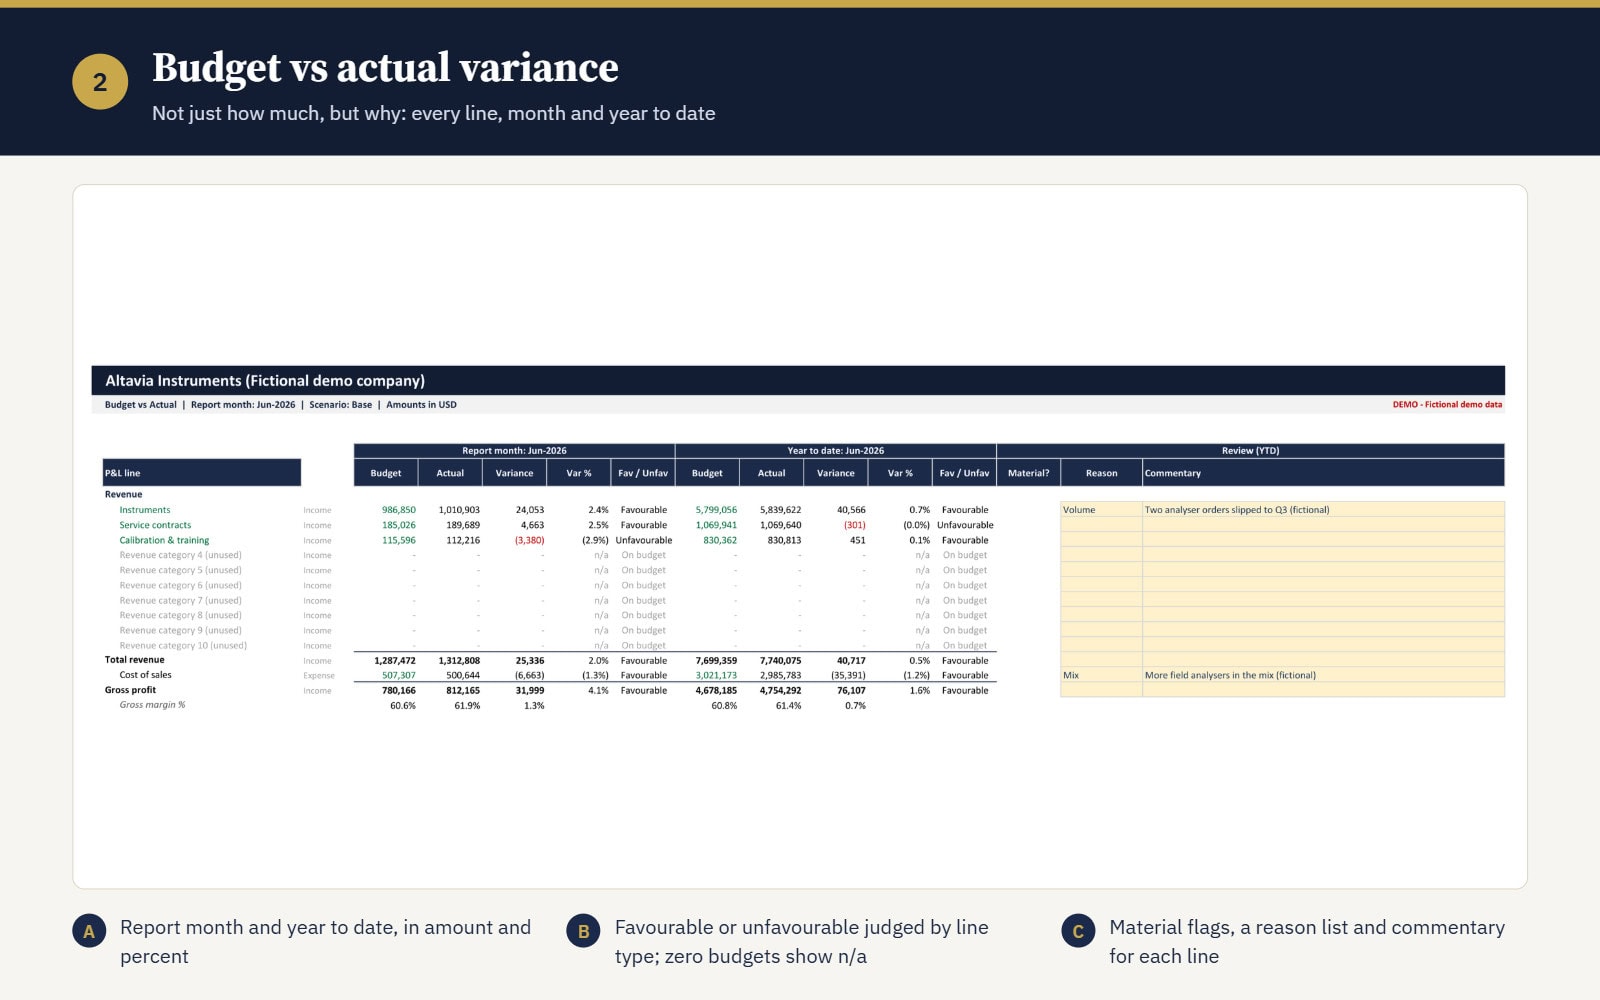
Budget vs. actual variance. Month and year-to-date variance for every P&L line, in amount and percent. Favorable or unfavorable is judged correctly for revenue and cost lines, and zero-budget lines show “n/a” instead of an error. Material variances are flagged against your own thresholds, with a reason list (volume, price, mix, timing, one-off, and more) and a commentary column.
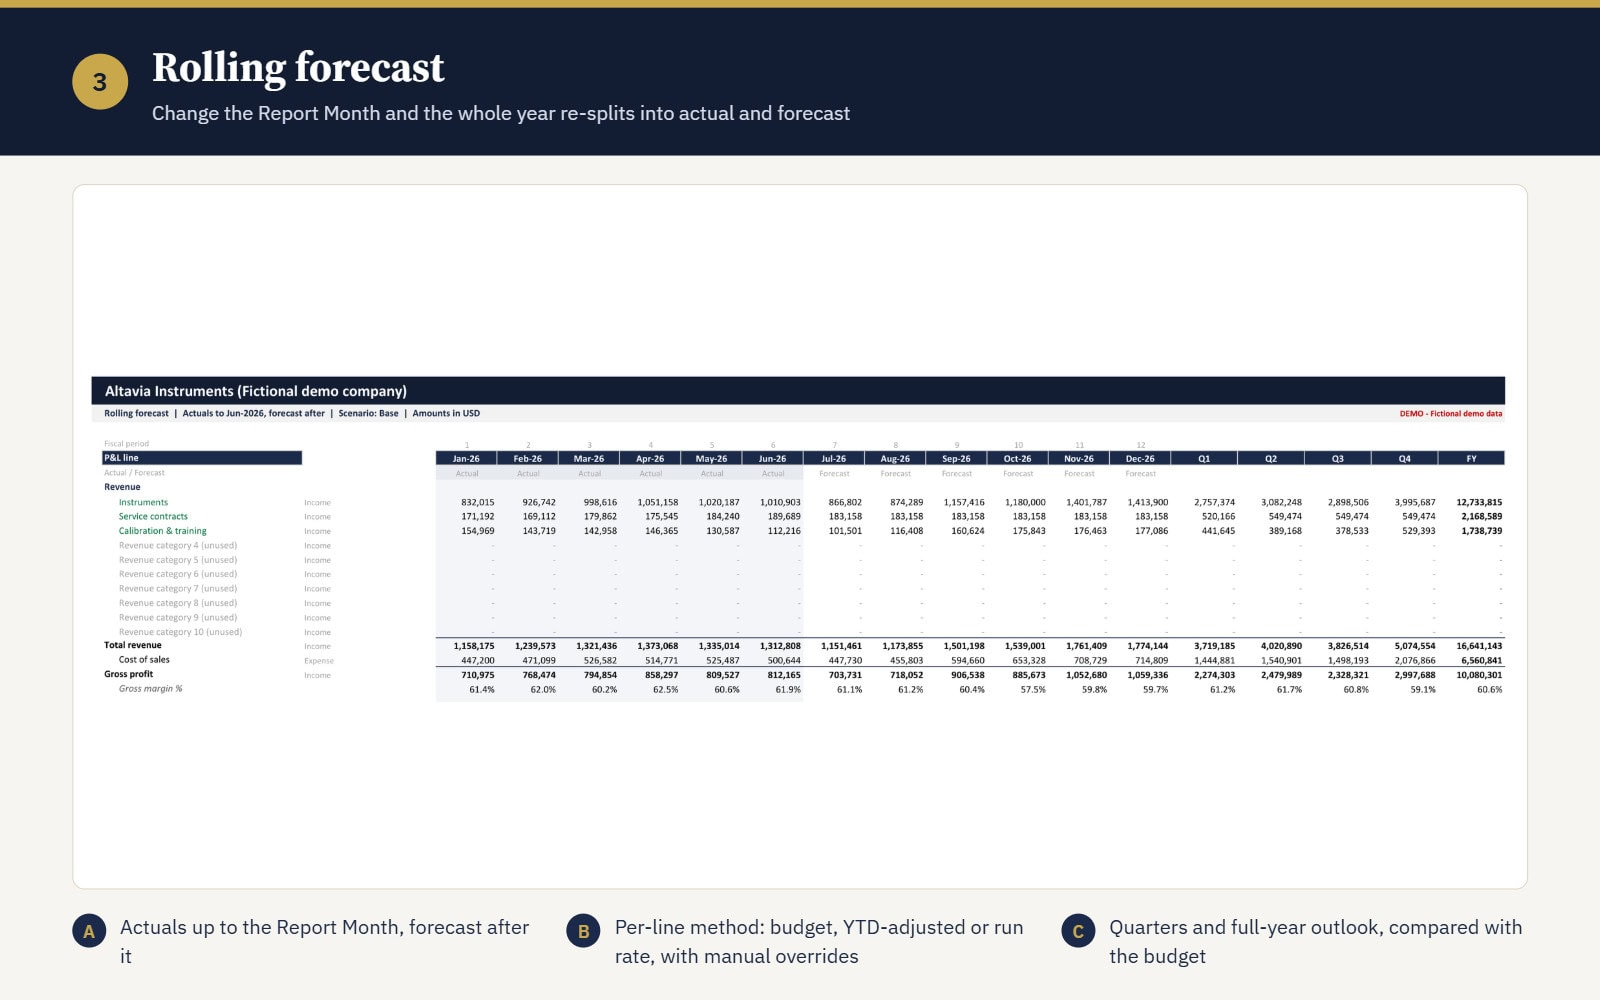
Rolling forecast. Set the report month, and the model splits the year automatically: closed months use actuals, and open months use the forecast. Each line can follow the budget, the budget adjusted by year-to-date performance, or a run rate, and manual overrides always take priority. Full-year outlook = YTD actual + remaining forecast, compared with the budget.
Version snapshots and forecast accuracy. Five snapshot columns (Original Budget, Revised Budget, Forecast Q1, Q2, and Q3) let you compare the original budget with the latest outlook. Forecast accuracy (variance, percentage, and MAPE) is shown only once; at least three months can be measured, so you never see a misleading figure.
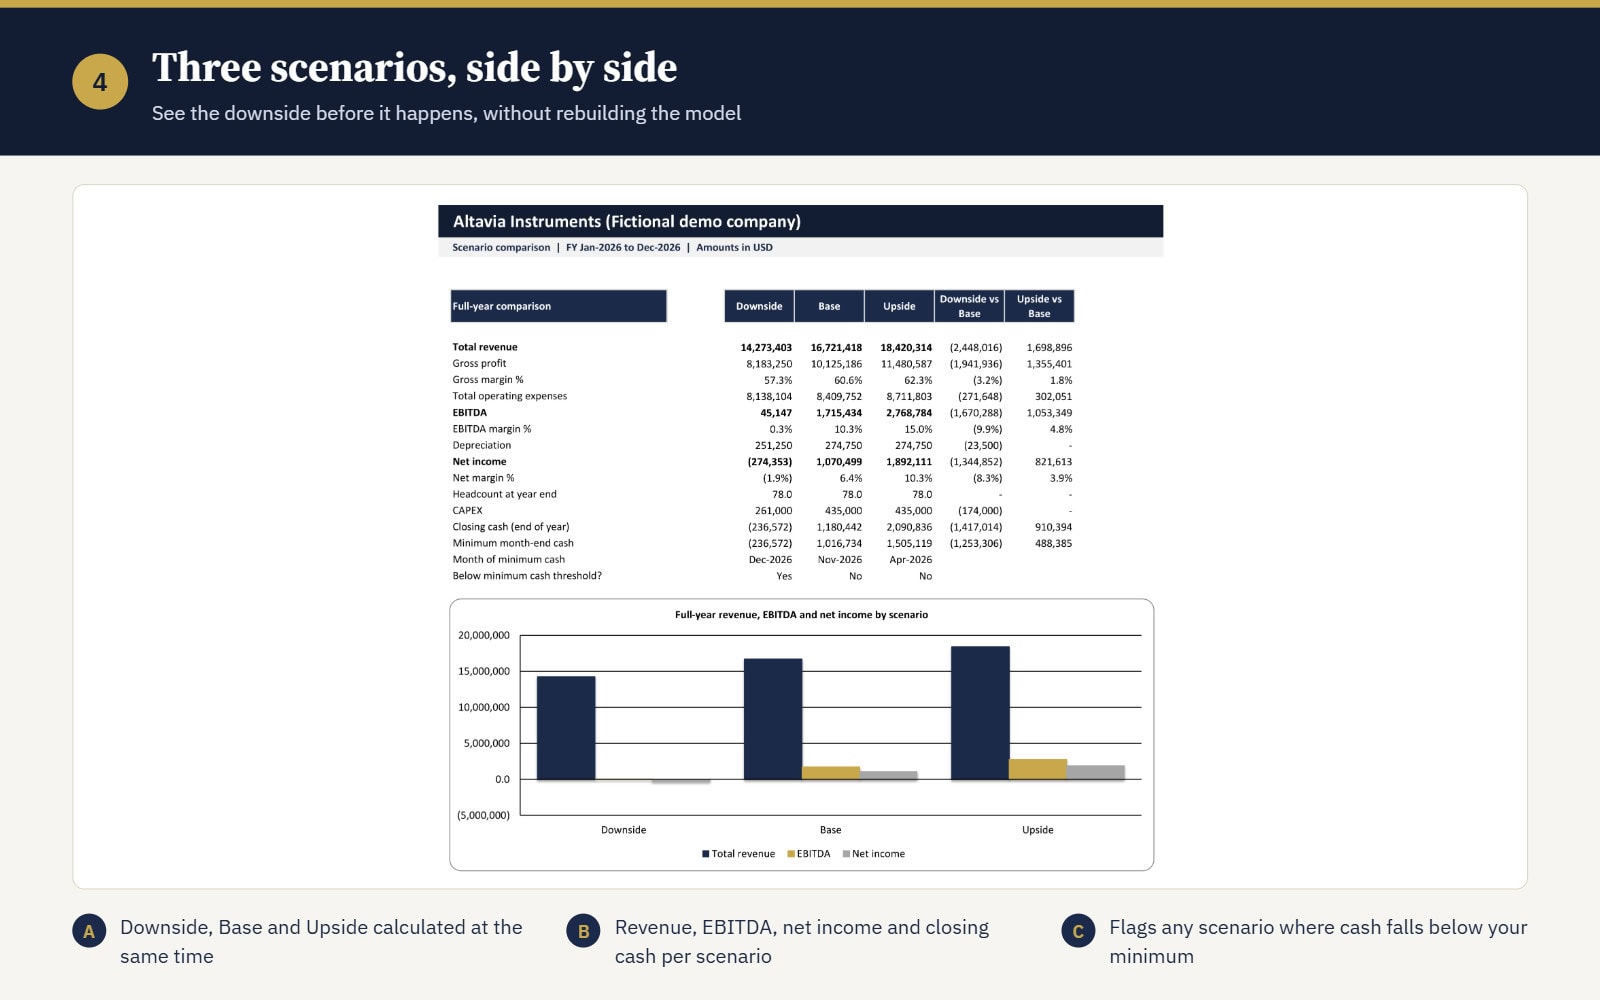
Three scenarios. Downside, Base, and Upside are calculated in parallel through drivers for volume, price, COGS, payroll, OPEX, CAPEX, and collection days. A comparison table shows revenue, EBITDA, net income, and closing cash for all three at once.
Cash flow. A monthly management cash flow driven by DSO, DPO, inventory days, CAPEX, debt, and tax payment timing. The direct and indirect methods are reconciled every month. You can anchor the forecast to your actual bank balance, and the model shows minimum cash, its month, cash runway, and an alert when cash falls below your threshold.
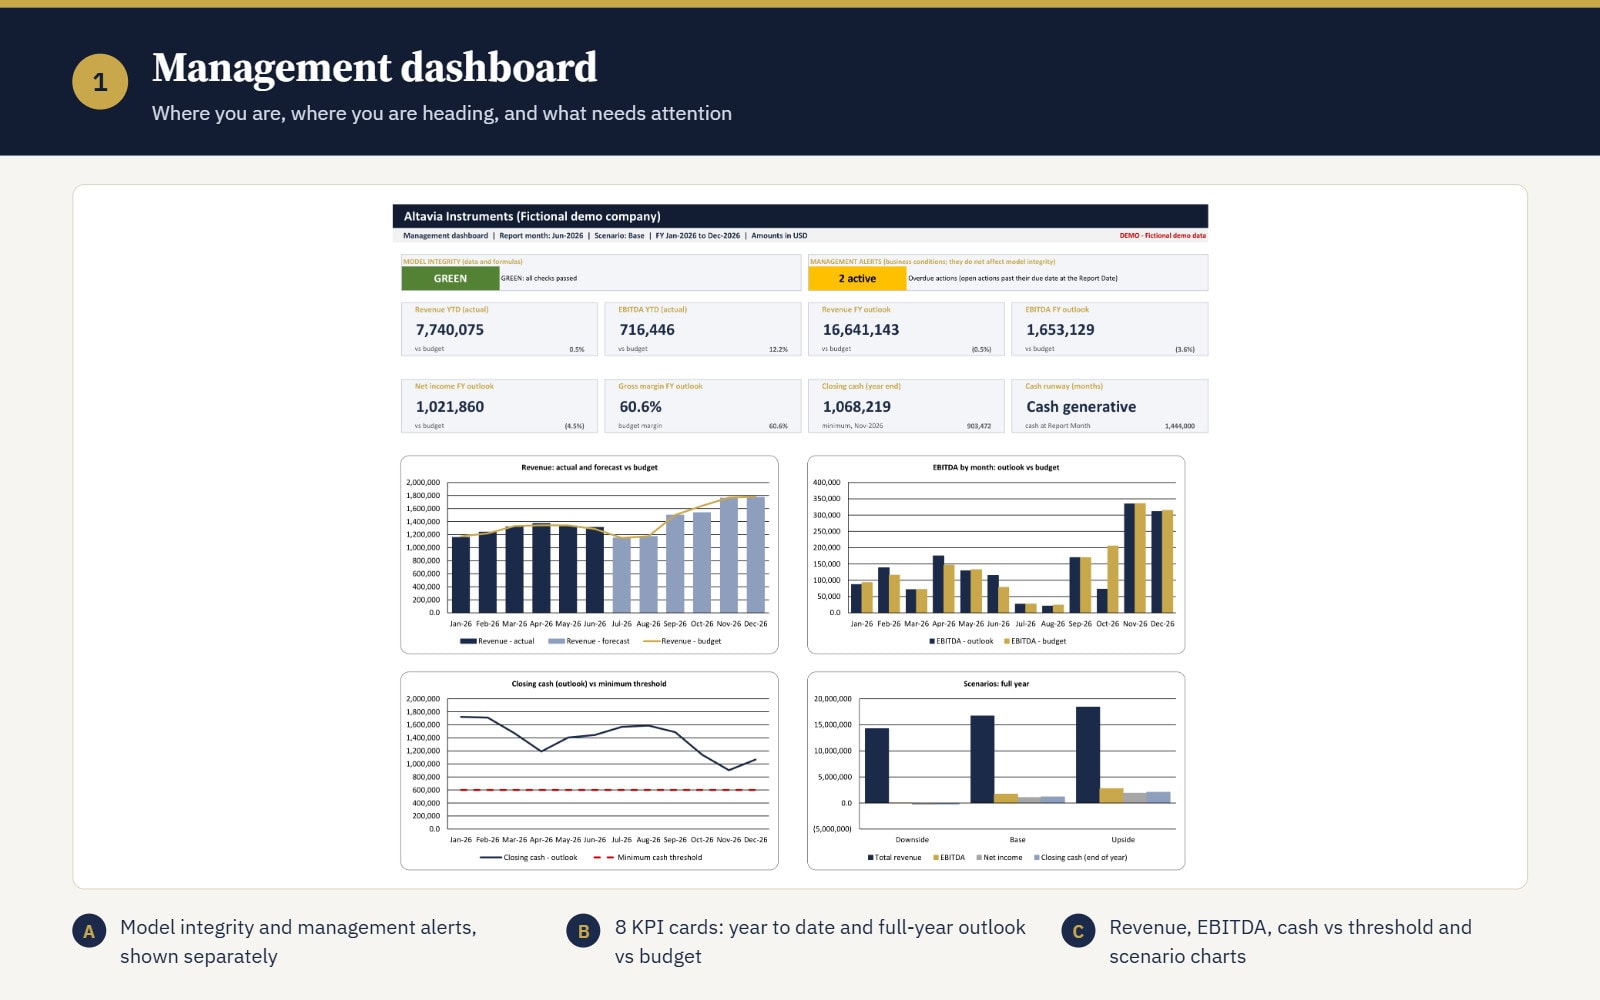
Management dashboard. Eight KPI cards (revenue and EBITDA year-to-date and outlook vs. budget, net income, gross margin, closing cash, and runway), four charts, and a management alerts panel. Your company name leads every report.
Action tracker. Record issues, owners, financial impact, and due dates. Overdue actions are flagged against the report date.
Built-in checks
The model runs 42 integrity checks (settings, data, mapping, P&L arithmetic, forecast totals, and cash reconciliation) and shows one status: GREEN, AMBER, or RED. A new file shows a blue “SETUP NEEDED” message listing exactly what to fill in. Seven management alerts (for example, cash below minimum or revenue below budget) are shown separately because they describe your business, not a problem with the model. Every check and alert is explained in the User Guide’s troubleshooting table.
What you receive
- PRO workbook: the blank model, ready for your company (18 sheets)
- EXAMPLE workbook: the same model filled with a fictional company, unlocked, to learn from
- User Guide (PDF, 9 pages) and a one-page Quick Start
- Release notes
How you use it each month
- Close the month and import actuals
- Update the Report Month and Report Date
- Review the variance and add commentary
- Update the forecast and take a snapshot
- Review cash, the dashboard, and open actions
Capacity and requirements
Up to 20 revenue streams, 15 departments, 60 roles, 40 OPEX lines, 30 CAPEX items, 5,000 actual rows, and 100 actions. Microsoft Excel 2016 or later, Windows or Mac. No macros, no add-ins, no external links. Formulas are open and documented.
Honest limitations
This version plans one fiscal year (12 months) for one entity in one currency. It includes a light working-capital and debt block but not a full balance sheet. Snapshots are saved with copy and paste values, because Excel cannot store past forecasts without macros.
Quality
The calculations were verified with 100 automated test cases against an independent recalculation and cross-checked in Microsoft Excel. Questions or problems: [email protected].
Similar ProductsOther customers were also interested in...



 eFinancialModels
Electric Vehicle (EV) Charging Station Financial M...
With this comprehensive 5- or 10-year monthly tool, investors can assess the viability of setting up... Read more

Financial Model for Mobile App | Mobile App Busine...
The Mobile App Financial Plan Template in Excel allows you to develop financial projections when lau... Read more

 HenrySheykin
Food Truck Financial Model Excel Template
The Food Truck Financial Model helps entrepreneurs, founders, business owners, consultants, and anal... Read more

Green Hydrogen Production from Wind Energy Financi...
The Green Hydrogen from Wind Financial Model aims to comprehensively forecast a horizon of 40 years ... Read more

Simple Mutual Non-Disclosure Agreement Template
Protect your business secrets with ease using our Simple Mutual Non-Disclosure Agreement Template. S... Read more

Solar Energy Financial Model
The Solar Energy Financial Model Spreadsheet Template in Excel assists you in preparing a sophistica... Read more

 Peter Graf
The Customer-Centric Financial Model for Restauran...
Starting a restaurant without a financial plan is like driving a car blindfolded. You wouldn´t do i... Read more
You must log in to submit a review.