
0 ITEMS

Large Load Grid Interconnection & Transmission Upgrade Financial Model | 20-Year Queue, Cost, Delay, Financing, NPV/IRR & Go/No-Go
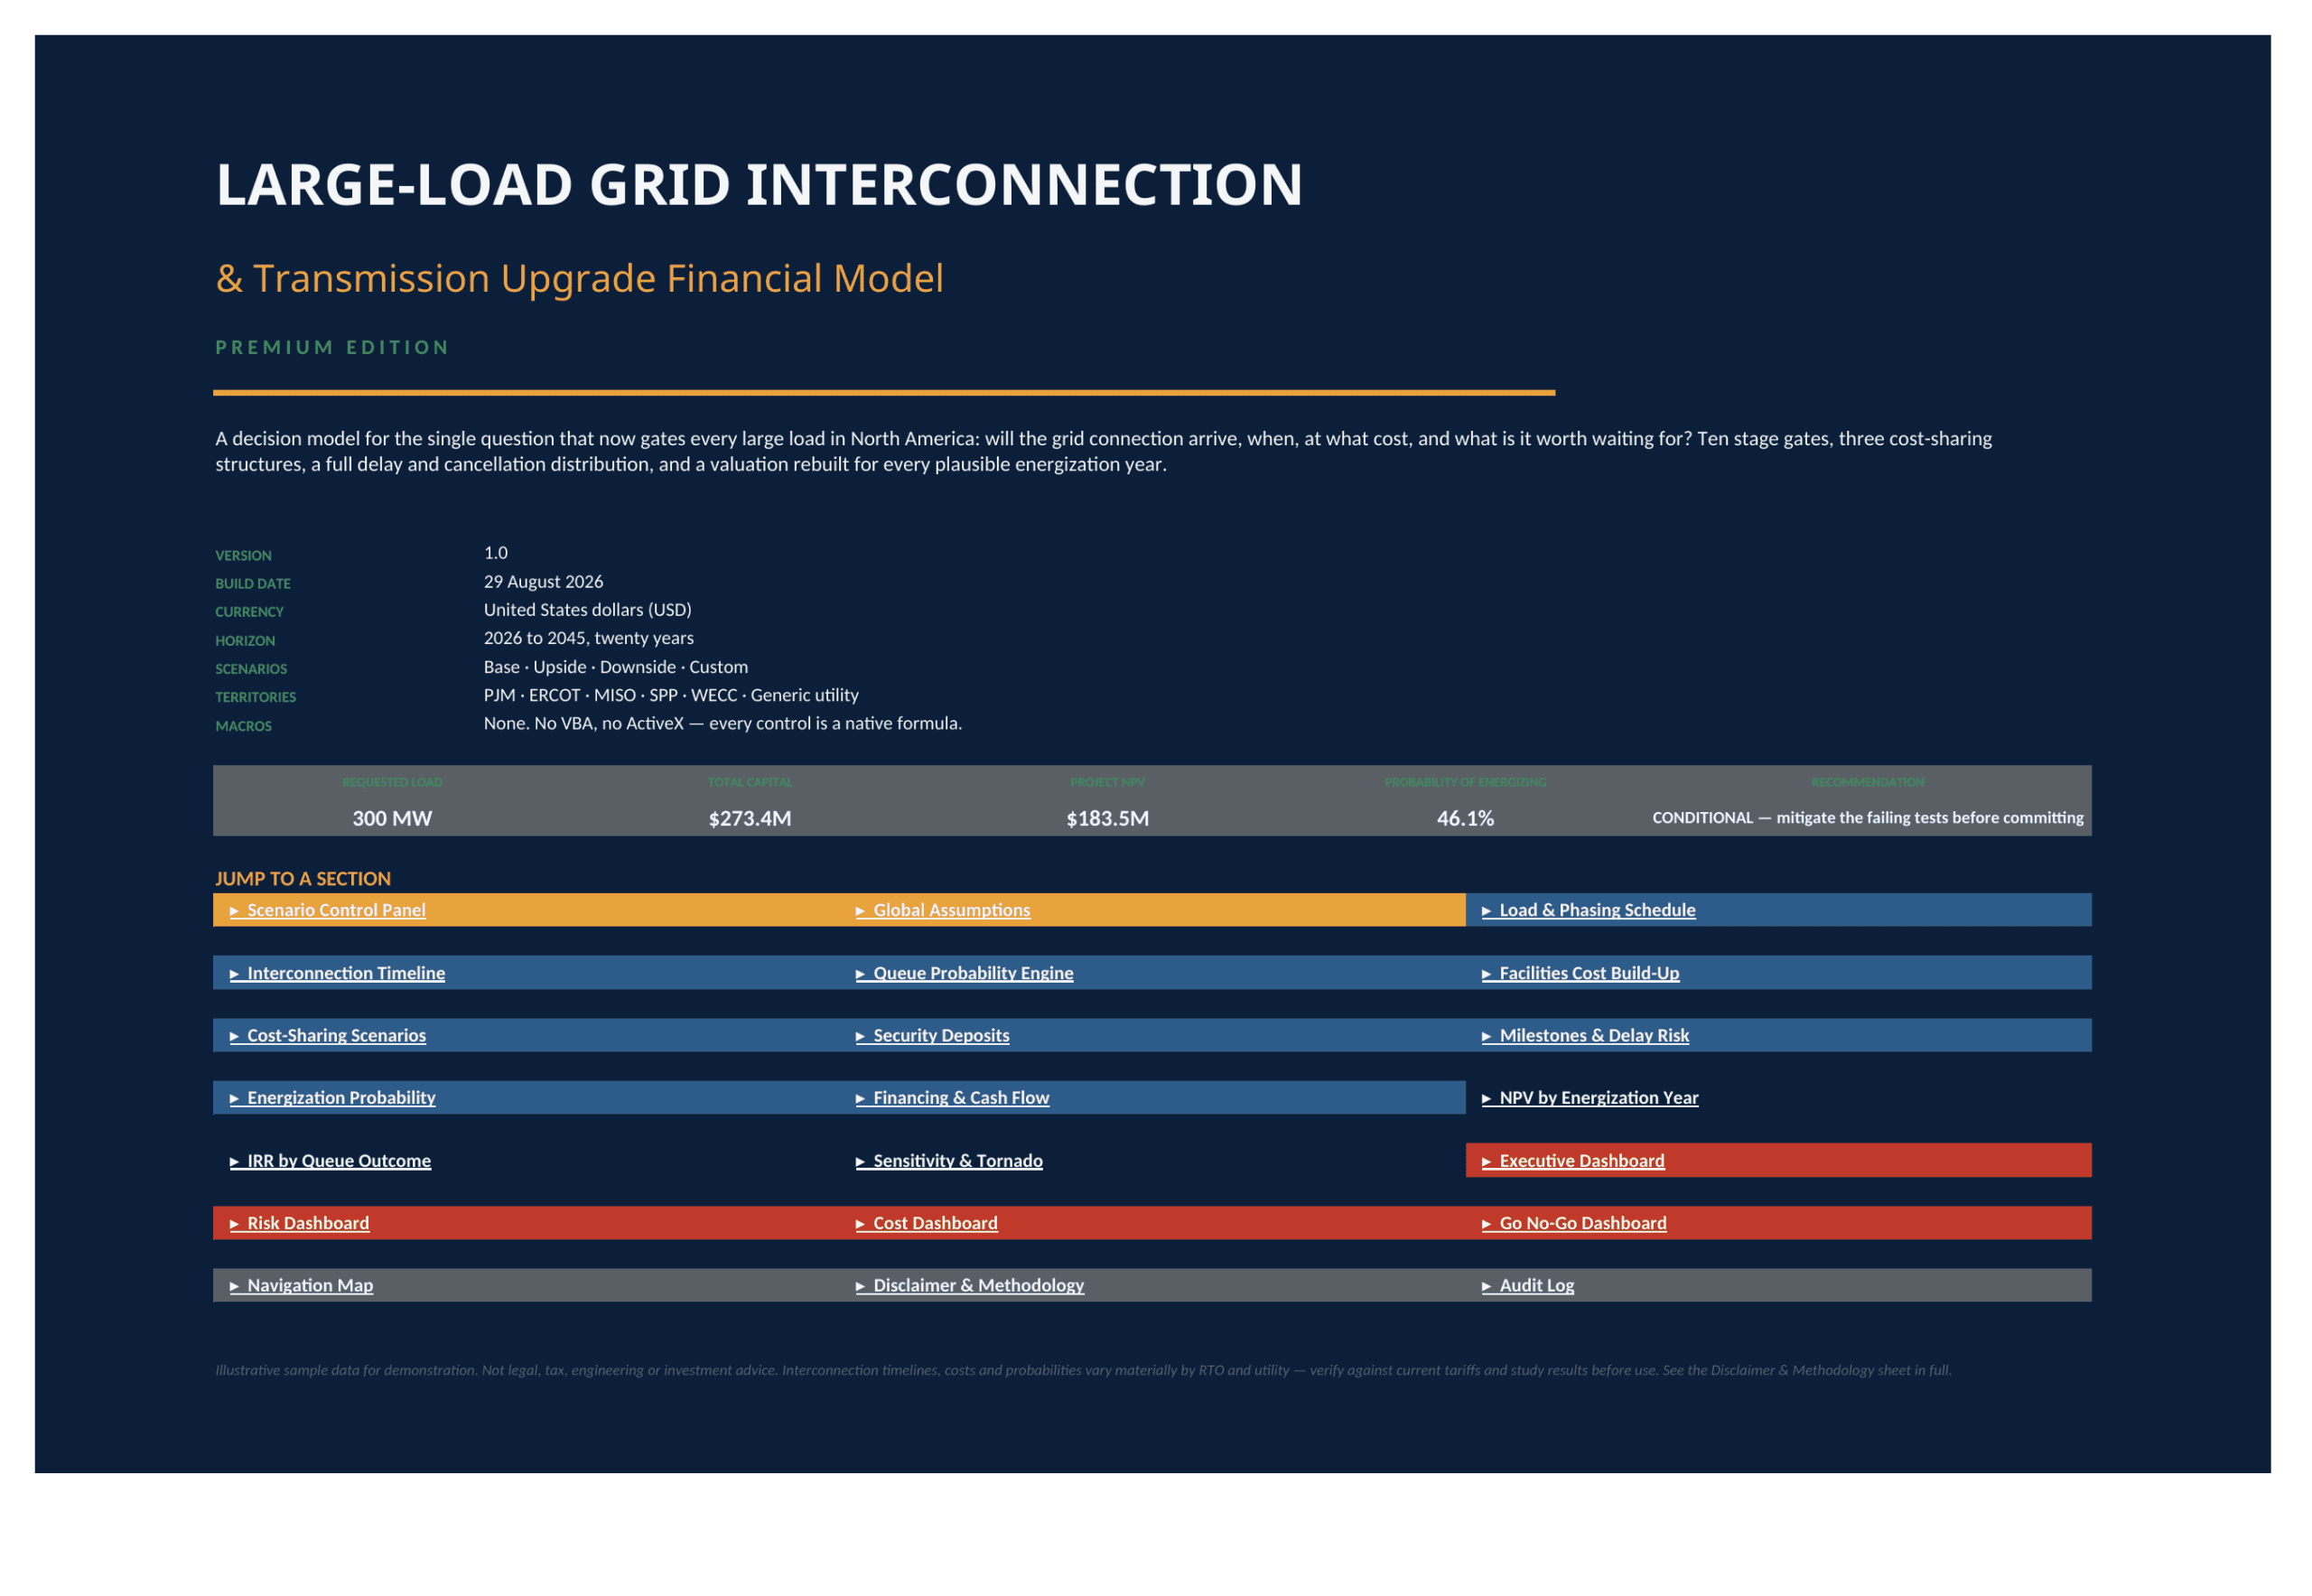
⚡ Model the grid-connection decision before delay, network upgrades, deposits, and queue attrition consume the project economics. This premium Excel model converts a large-load interconnection request into an integrated 20-year decision framework covering load phasing, the interconnection study path, queue survival, transmission and facilities cost, escalation, cost sharing, deposits, delay, cancellation, bridge power, revenue at risk, financing, NPV, IRR, sensitivity, and a formula-driven go/no-go recommendation. Seller-supplied and already tested; no Studio workbook audit was performed.

Large Load Grid Interconnection & Transmission Upgrade Financial Model
⚡ Model the grid-connection decision before delay, network upgrades, deposits, and queue attrition consume the project economics. This premium Excel model converts a large-load interconnection request into an integrated 20-year decision framework covering load phasing, the interconnection study path, queue survival, transmission and facilities cost, escalation, cost sharing, deposits, delay, cancellation, bridge power, revenue at risk, financing, NPV, IRR, sensitivity, and a formula-driven go/no-go recommendation.
Seller-supplied and already tested; no Studio workbook audit was performed.
🎯 The buyer problem
For a large data-center, AI-campus, industrial, or other high-load project, the central question is not simply “what does the facility cost?” The gating questions are: Will the requested load clear the interconnection queue? When can it energize? What network and customer-side upgrades will be assigned? How much cash must be posted before certainty exists? What does each year of slippage destroy in value?
This workbook is designed to answer those questions in one connected model rather than in disconnected engineering estimates, queue notes, and finance schedules. It distinguishes stage-by-stage probability from cumulative queue survival, escalates cost categories to the year they are actually spent, separates refundable and non-refundable deposits, values delay and cancellation, and rebuilds project economics for multiple energization years and queue outcomes.
🧭 Model workflow
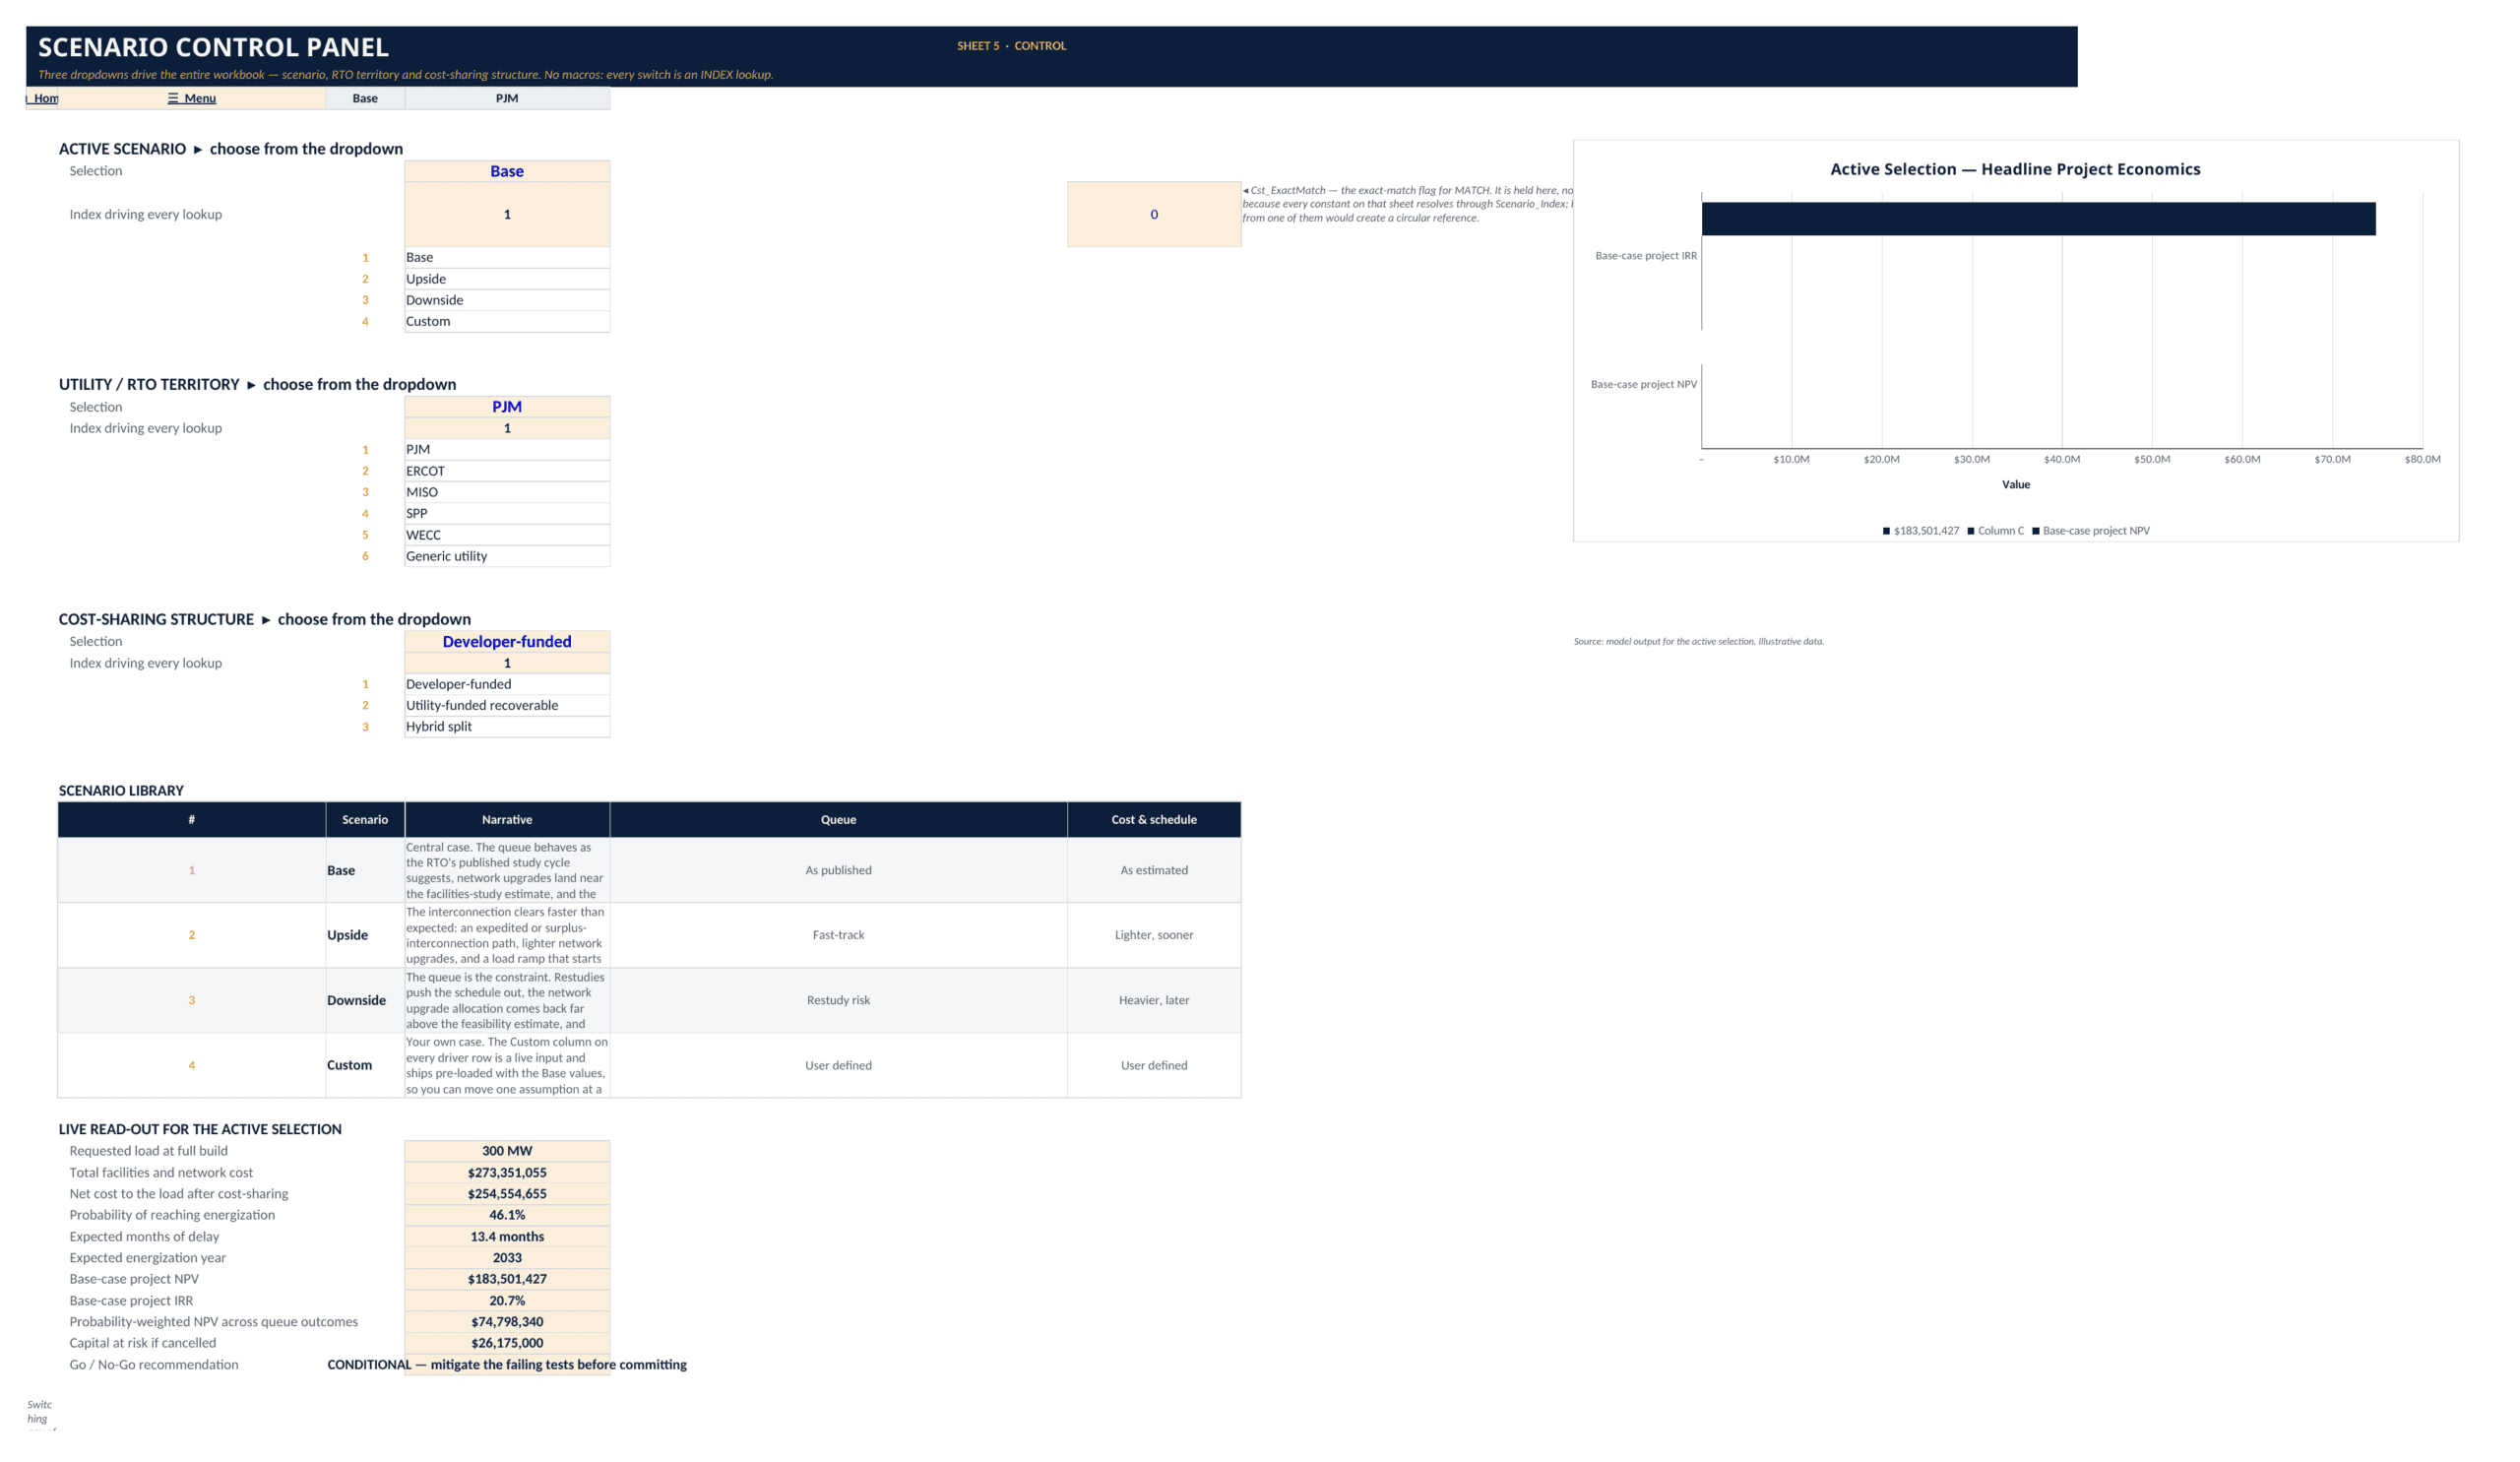
Start on the Scenario Control Panel and select the active scenario, utility/RTO territory, and cost-sharing structure. The workbook includes Base, Upside, Downside, and Custom scenarios and territory selections for PJM, ERCOT, MISO, SPP, WECC, and a Generic utility. The Custom case is designed for user-defined assumptions. The model is an `.xlsx` workbook using native formulas; no VBA or ActiveX is required.
Next, replace the illustrative inputs on Global Assumptions. Inputs cover the model horizon, requested interconnection capacity, load ramp, load factor and take-or-pay floor; network upgrade allocation; customer substation, transformer/high-side, line-extension and site-work cost; contingency and owner’s costs; category-specific escalation and delay uplift; cost-sharing/refund assumptions; queue-stage durations, pass probabilities and deposits; delay/cancellation assumptions; revenue and operating economics; bridge-power parameters; financing, tax, discount-rate and decision thresholds.
The downstream engine then carries the active assumptions through a common 20-year spine so timing, capacity, escalation, cash flow, probability and valuation stay connected.
🧮 What the workbook calculates
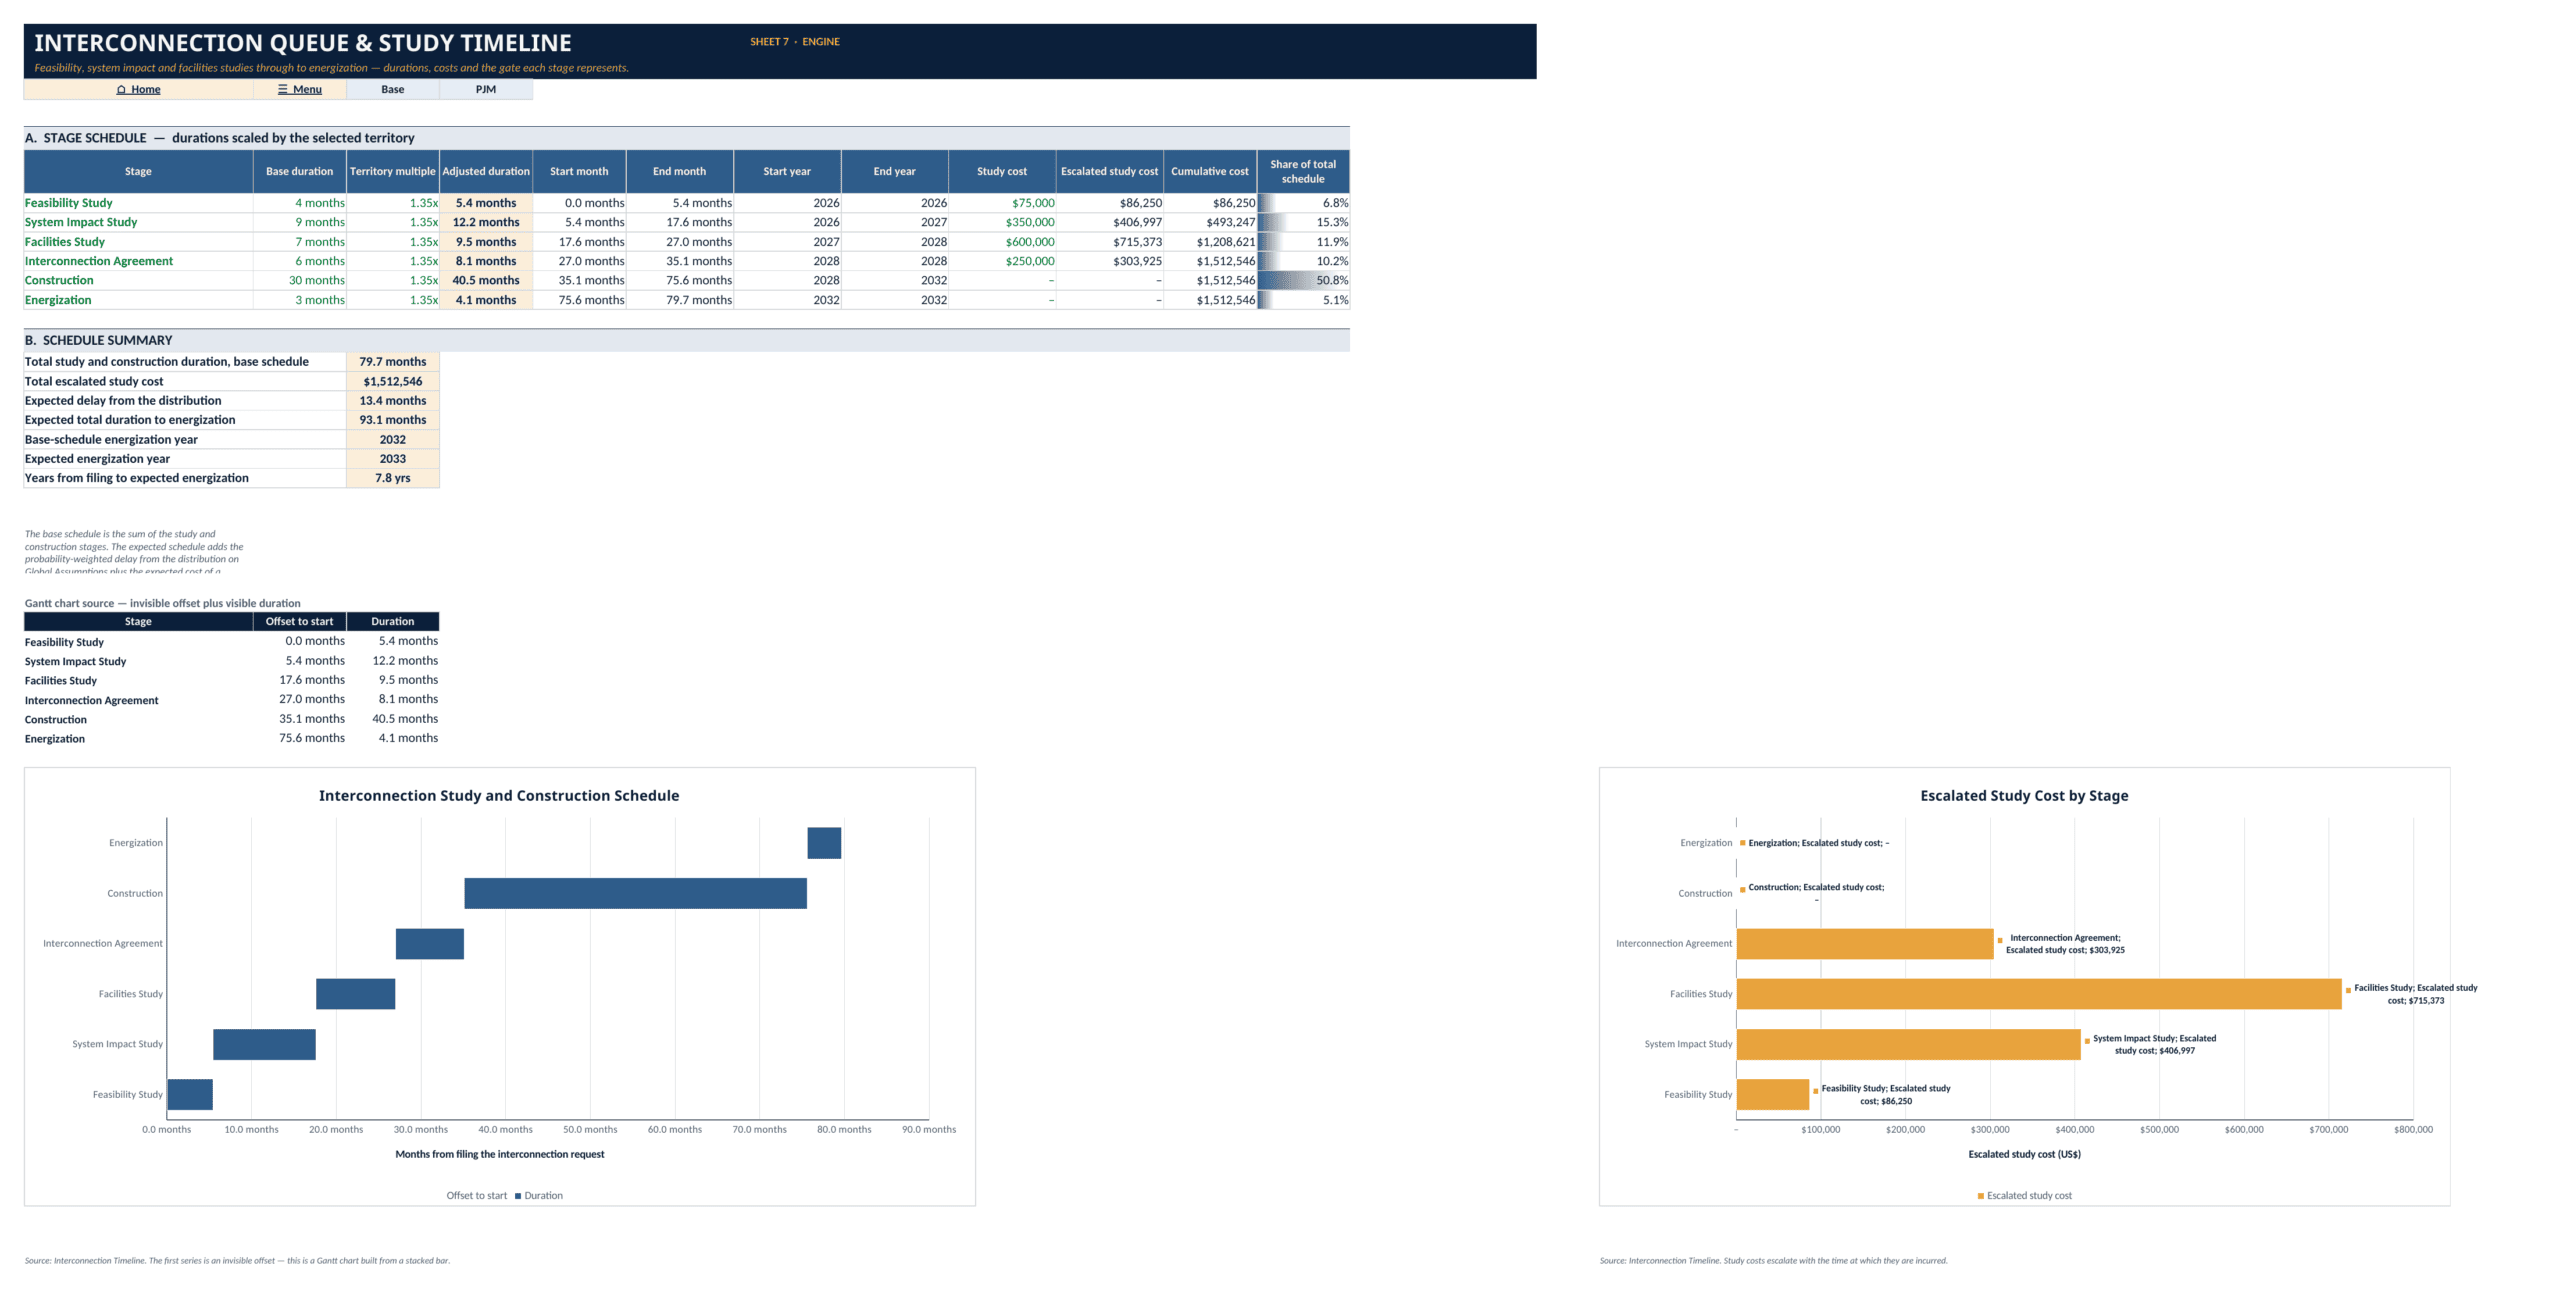
Load & Phasing Schedule converts requested MW into energized capacity, billable capacity, energy consumption and the ramp to steady state. Interconnection Timeline models the study and construction path from Feasibility Study through System Impact Study, Facilities Study, Interconnection Agreement, Construction and Energization, including adjusted durations, study cost, cumulative cost and expected timing.
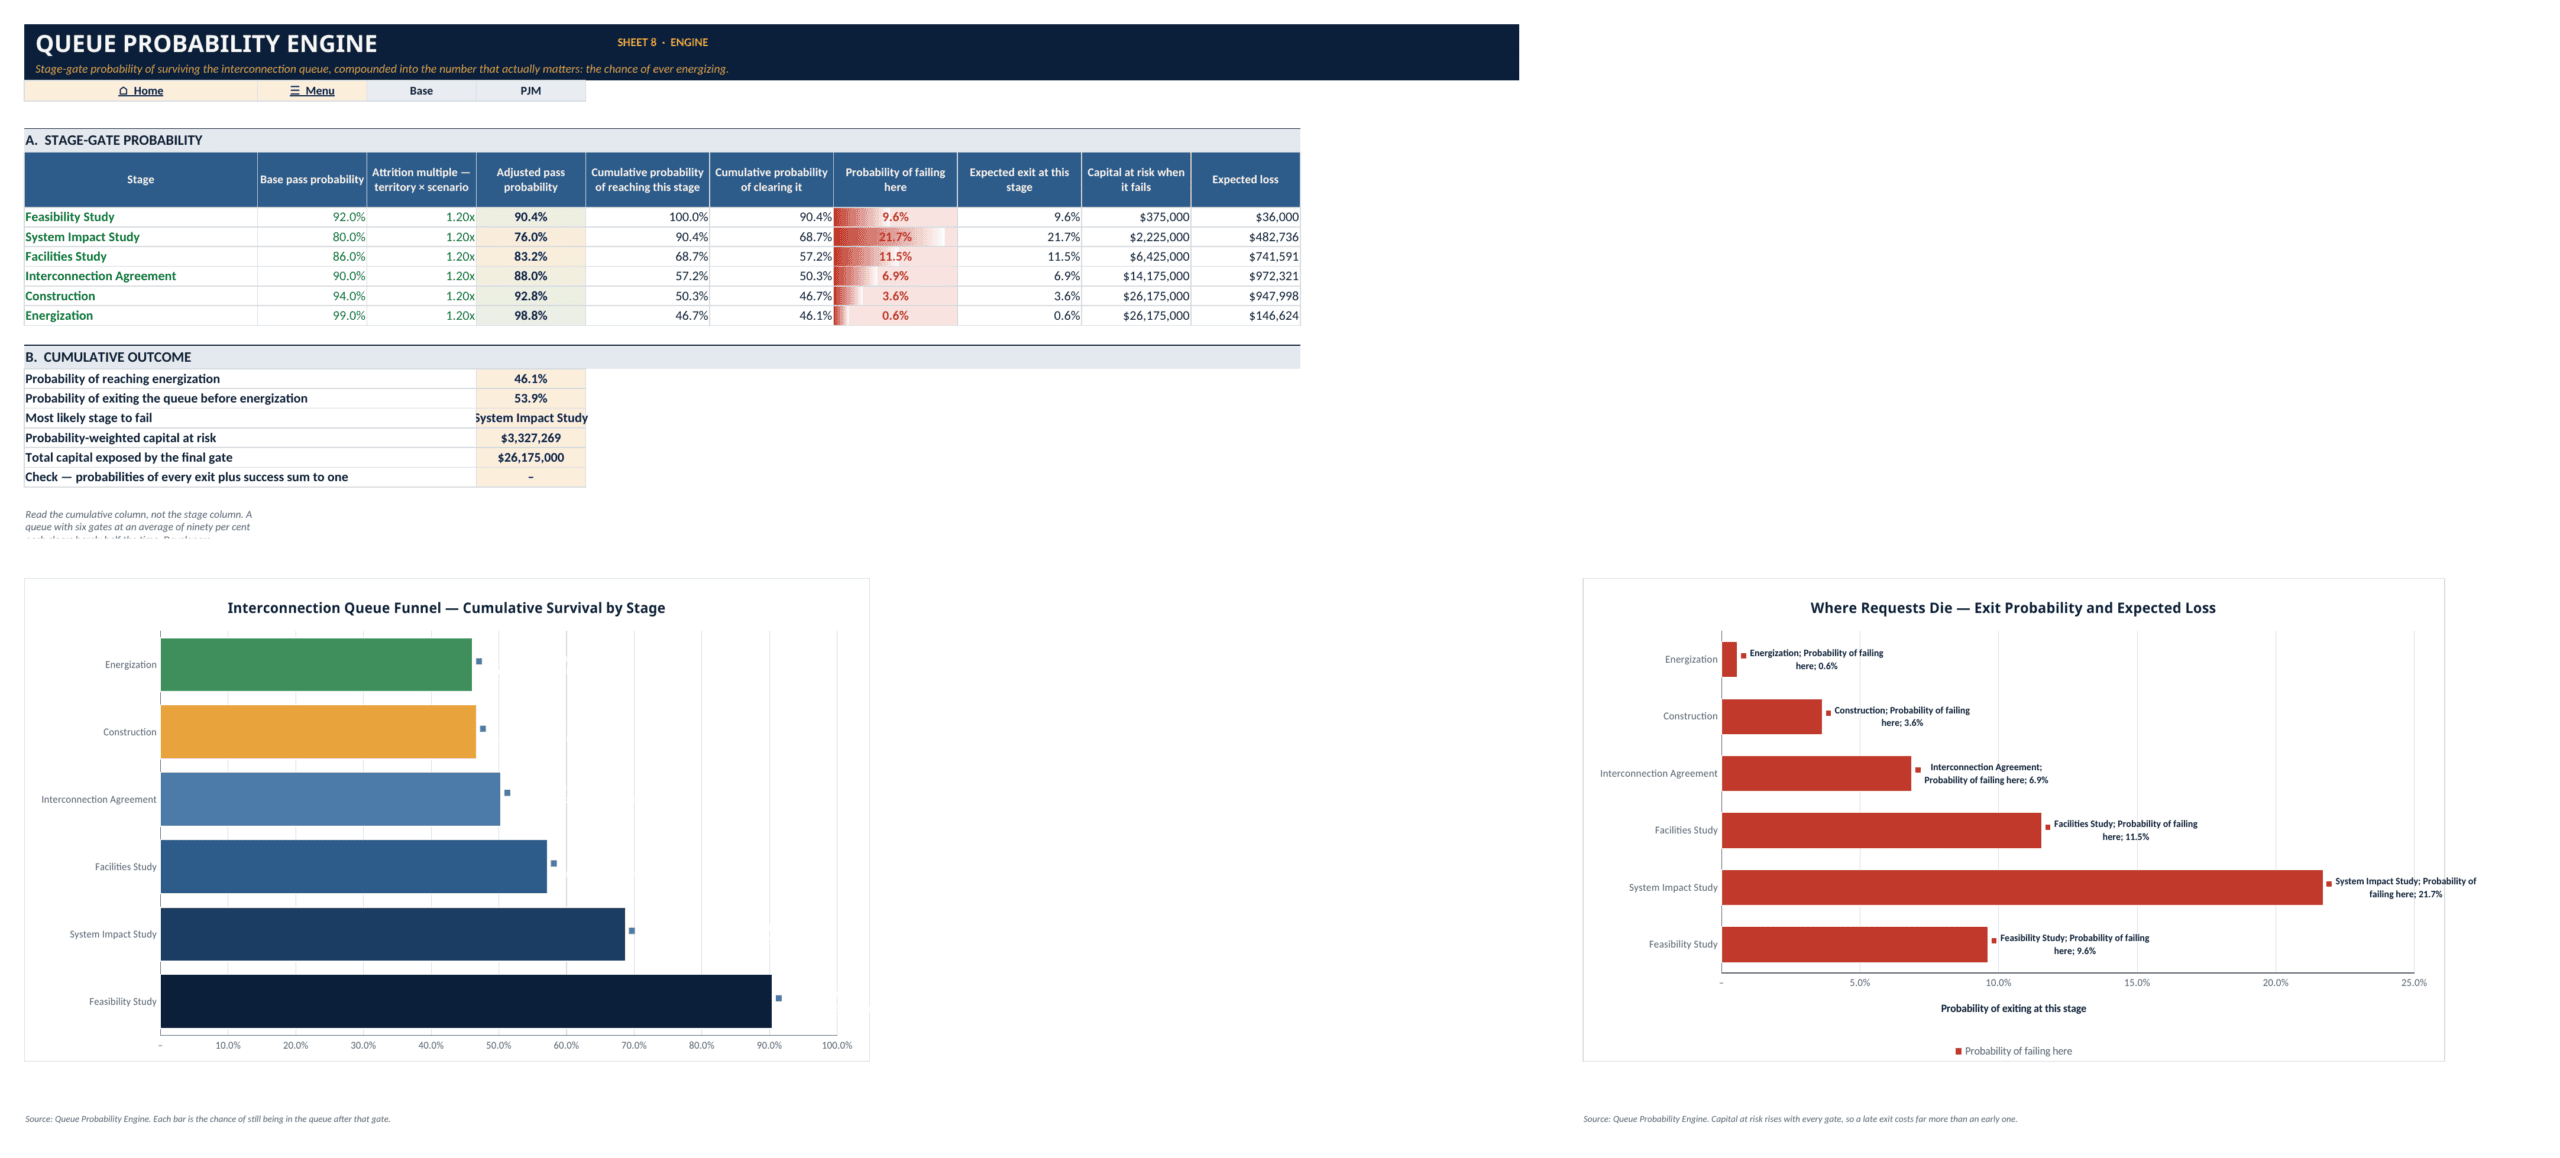
Queue Probability Engine compounds stage-gate pass probabilities into the probability of reaching energization, the probability of exiting early, the most likely failure stage, expected loss and probability-weighted capital at risk. Energization Probability converts queue survival plus the delay distribution into a cumulative energization S-curve, marginal probability by year, expected energization timing and probability-weighted energized capacity.
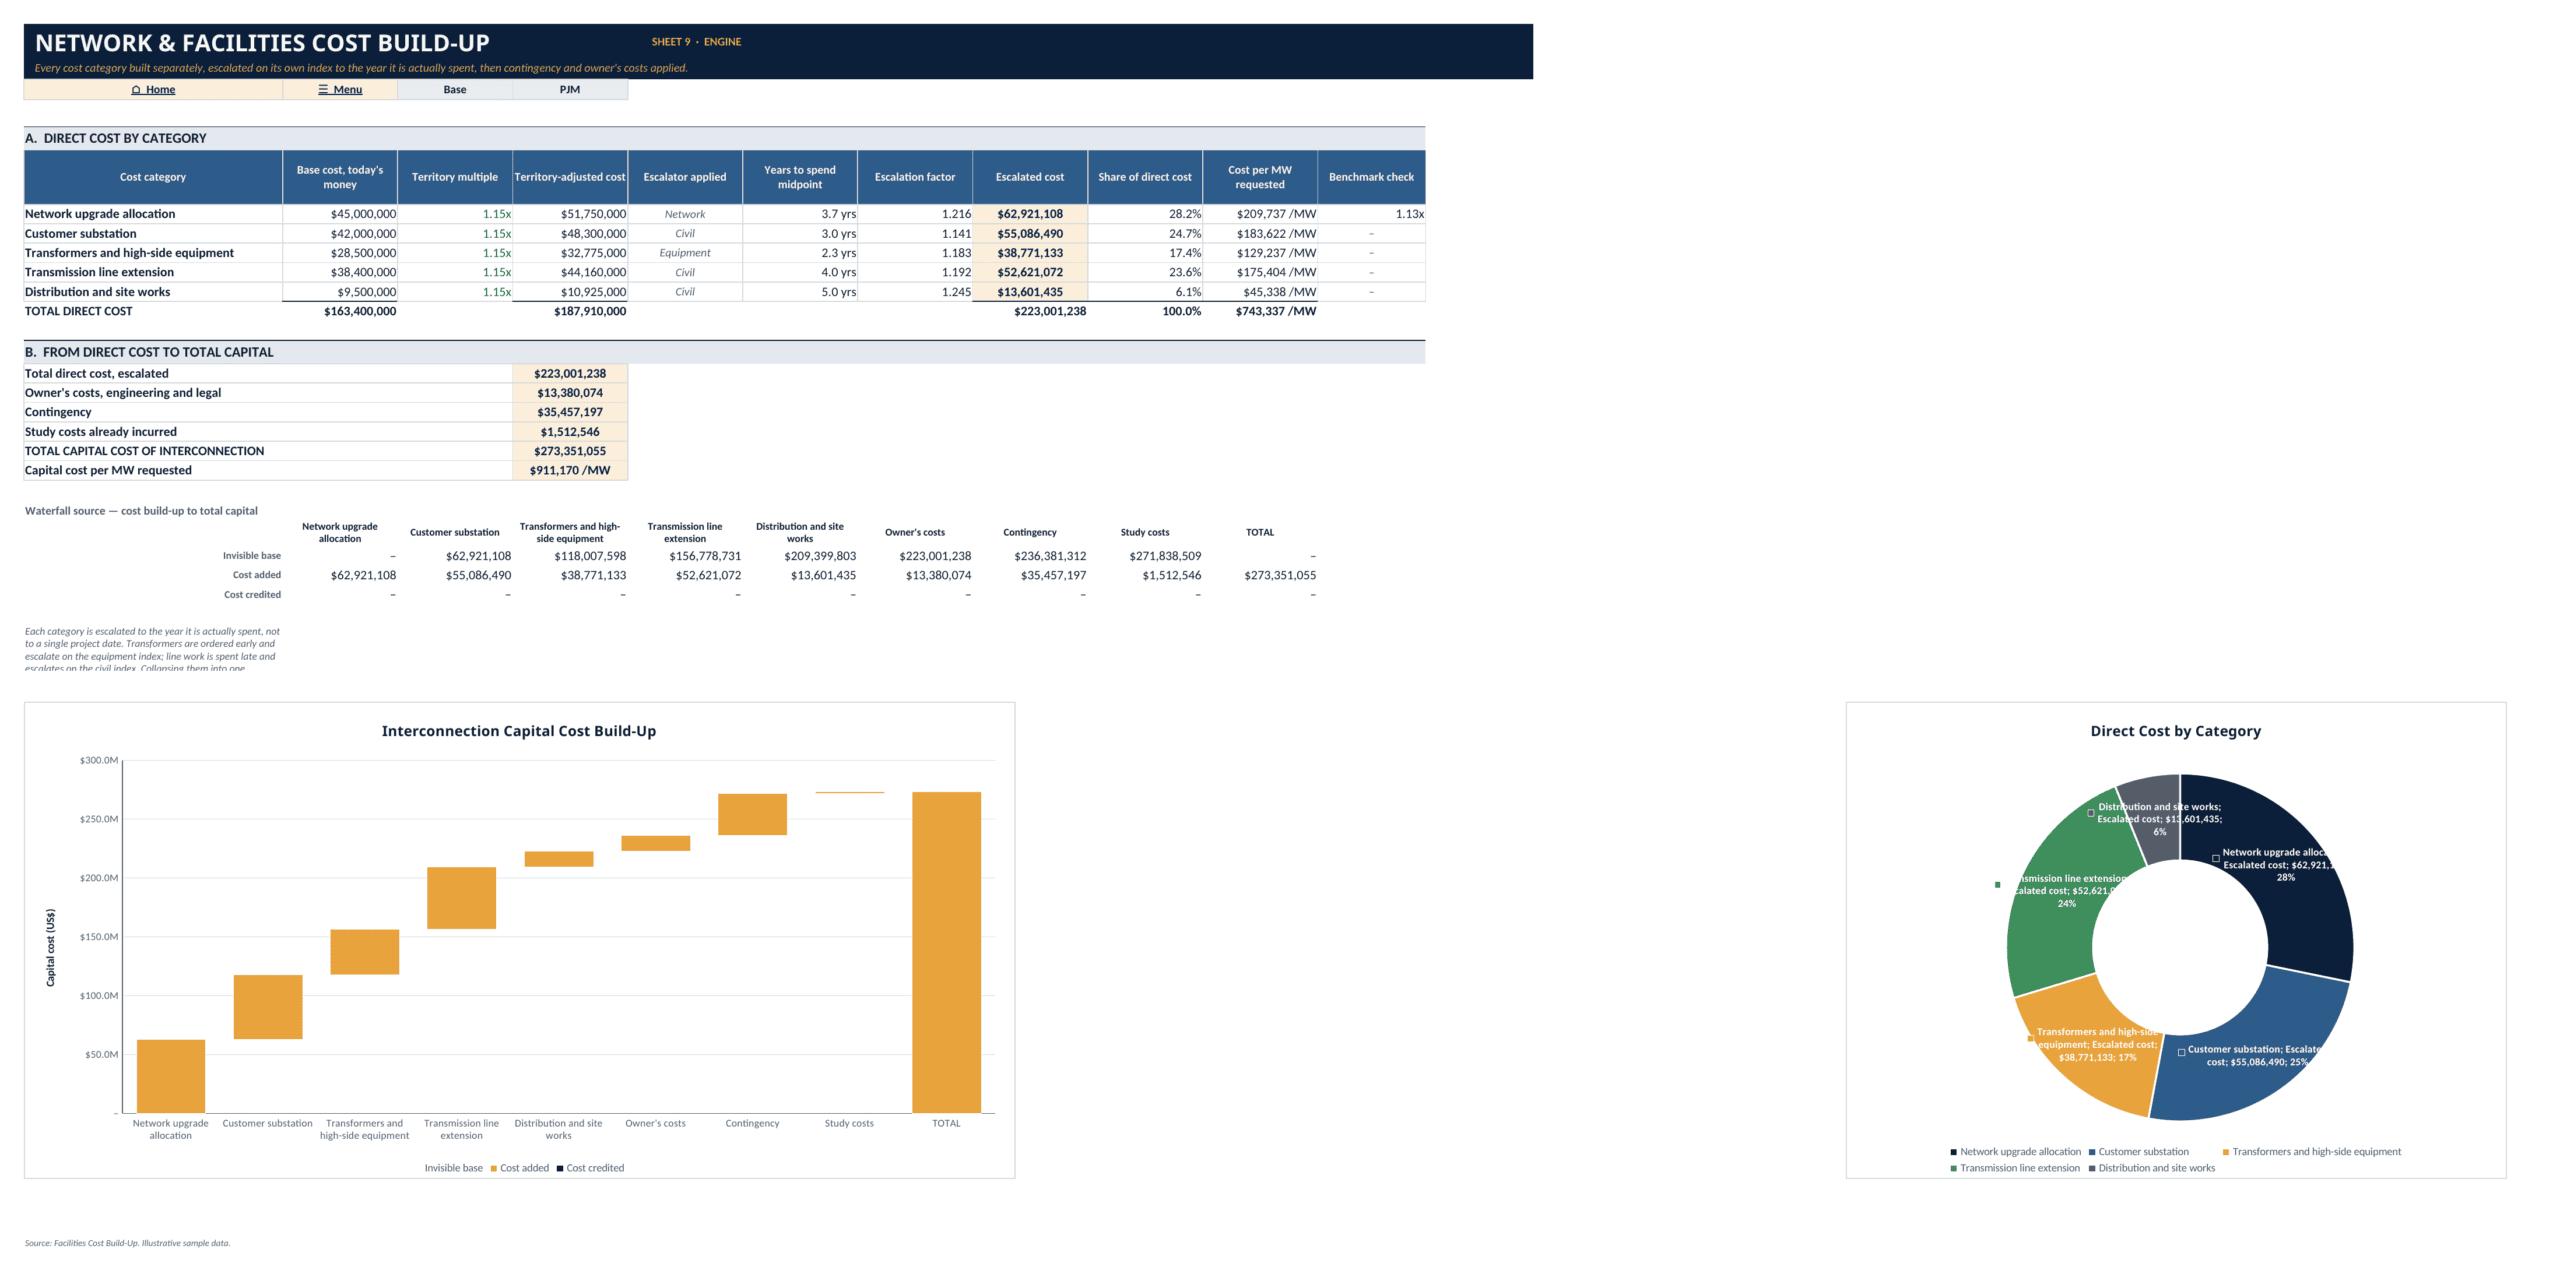
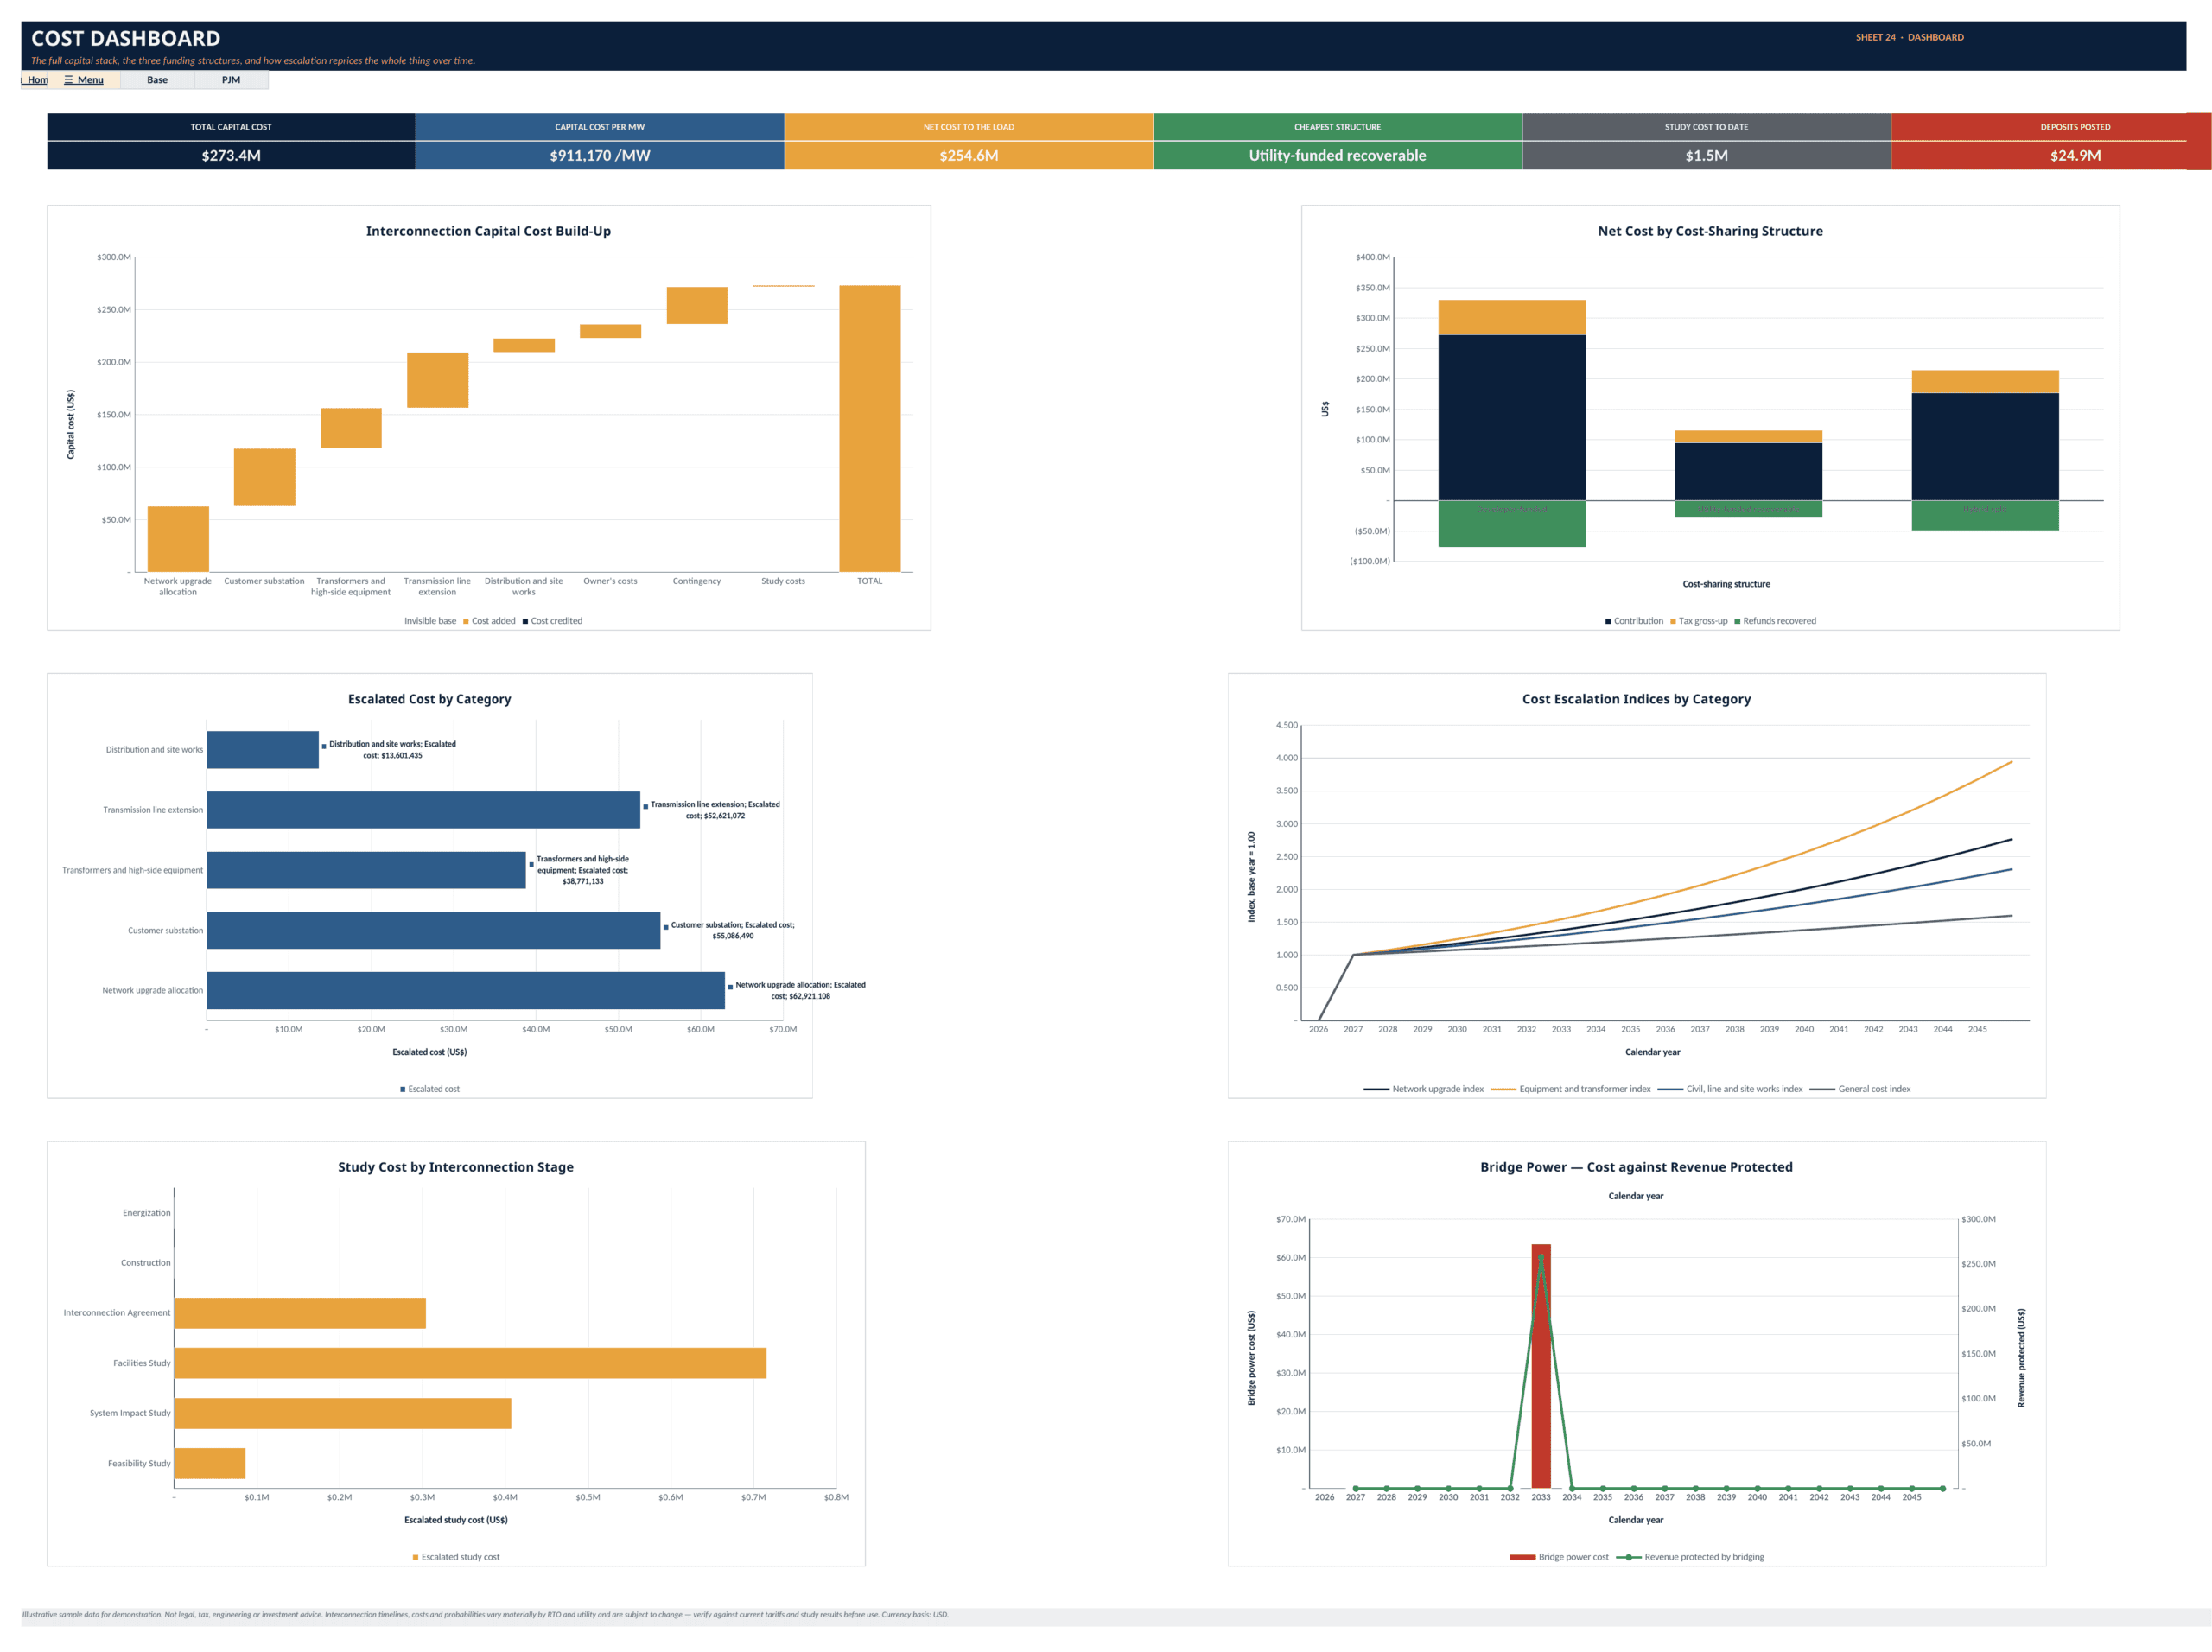
Facilities Cost Build-Up separates network upgrades, customer substation, transformers/high-side equipment, transmission line extension, distribution/site works, owner’s costs, contingency and study costs. Each direct cost category is escalated according to its own timing and index. Cost Escalation Engine then shows category indices, delay-driven uplift, capital cost under later energization dates, annual spend and cumulative capital spend.
Cost-Sharing Scenarios compares Developer-funded, Utility-funded recoverable and Hybrid structures, including tax gross-up, refunds and present-value net cost to the load. Security Deposits tracks deposits by stage, refundable/non-refundable tranches, cumulative posted amounts, sunk study cost and maximum/probability-weighted capital at risk.
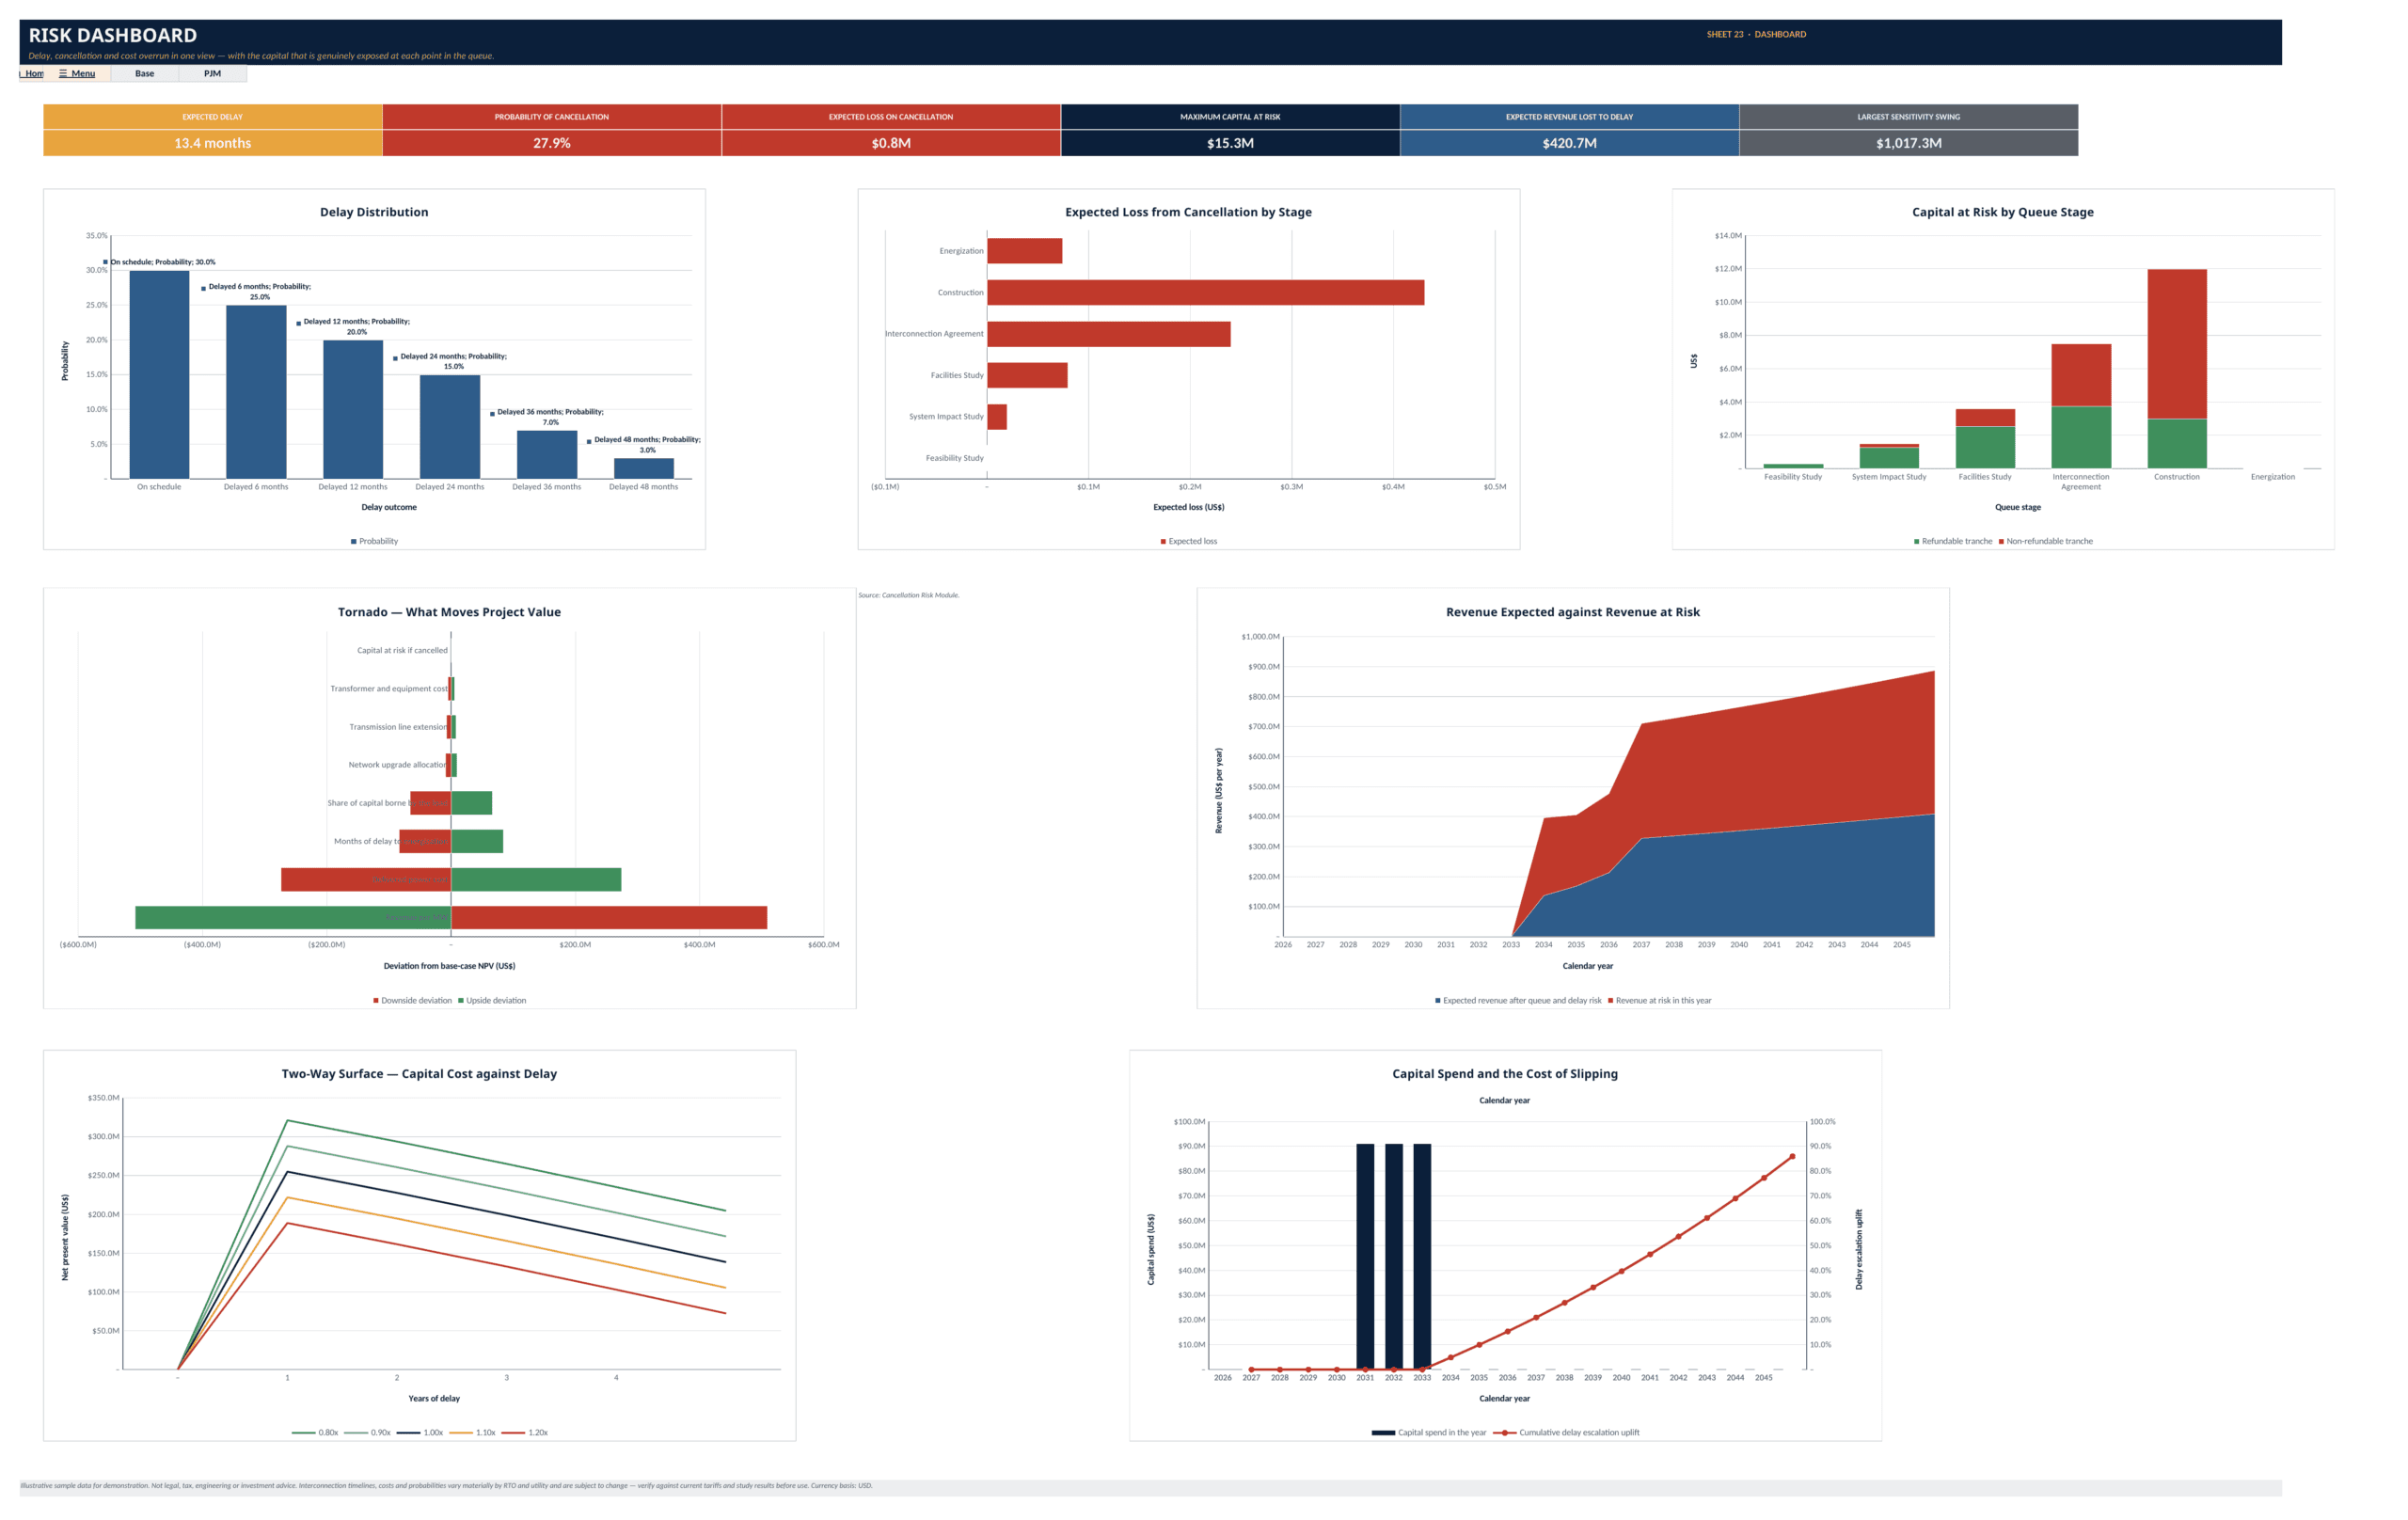
Milestones & Delay Risk models on-schedule and 6/12/24/36/48-month delay outcomes, probability-weighted timing, escalation, revenue impact, bridge cost and expected delay cost. Cancellation Risk Module combines failure probability, cancellation conditional on failure and unrecoverable capital to estimate expected cancellation loss by stage.
Bridge Power Solutions tests temporary behind-the-meter generation by deployable MW, months of operation, bridge-power cost, revenue protected, net benefit, present value and value-accretion verdict. Revenue at Risk from Delay quantifies expected revenue, revenue at risk, revenue lost under each delay case, bridge revenue recovered and net lost revenue.
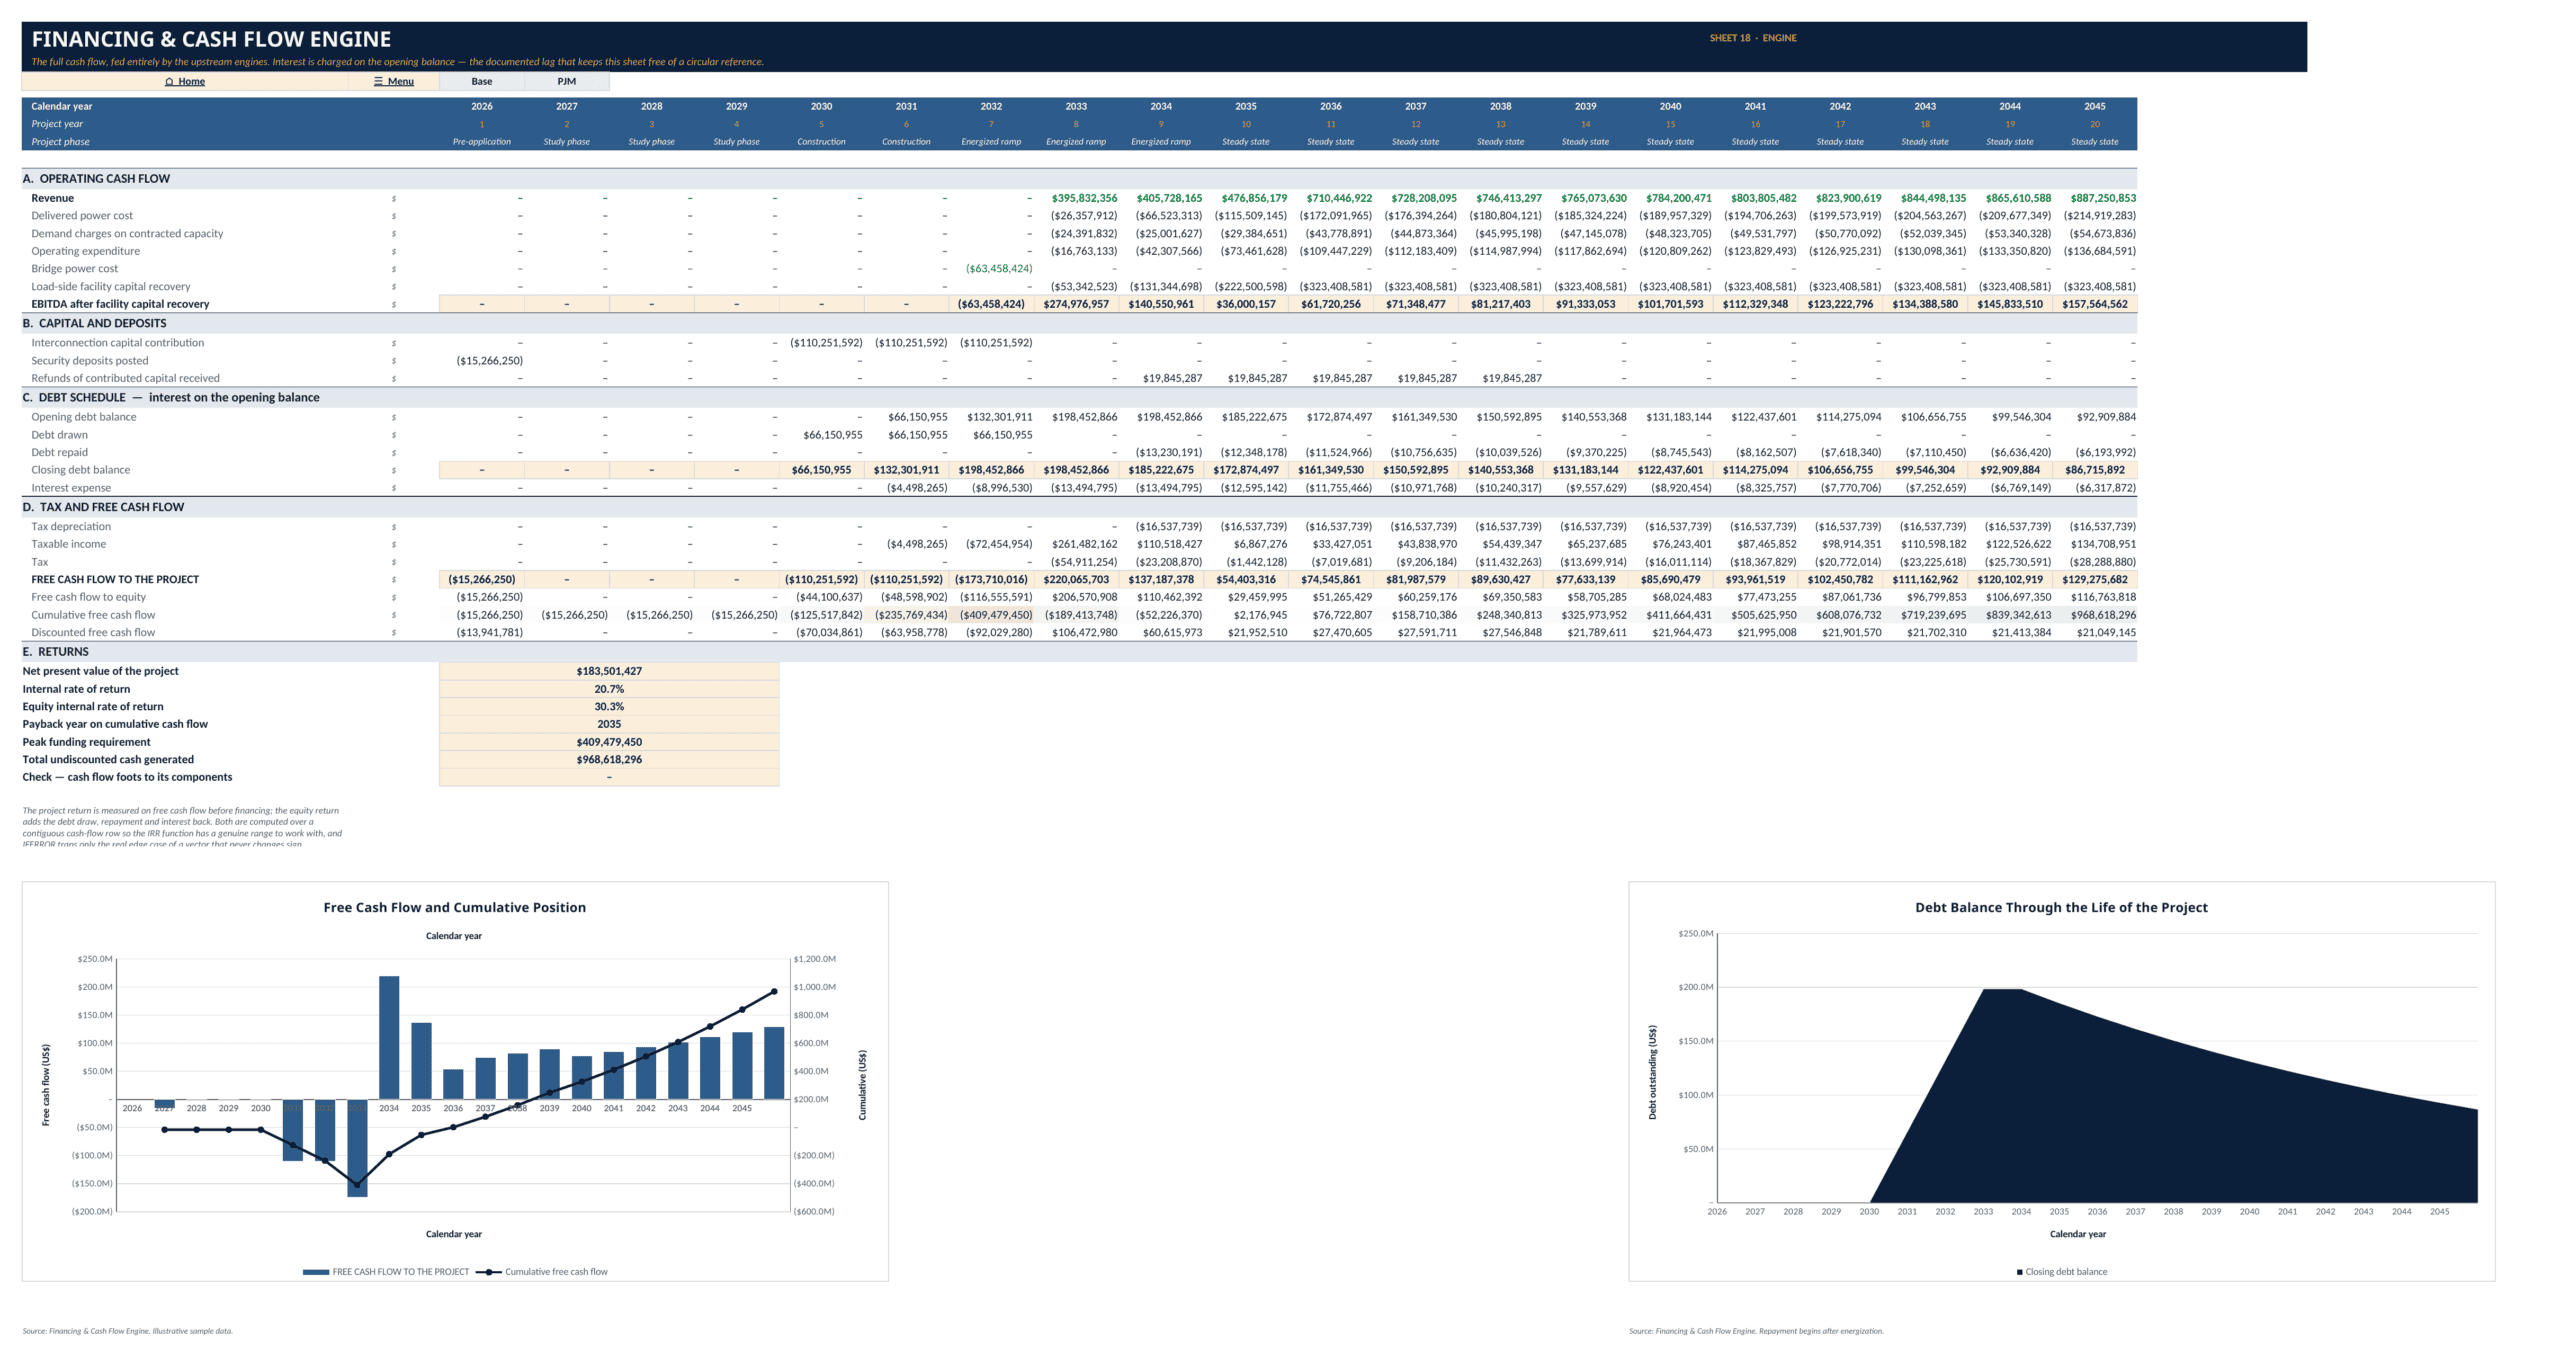
Financing & Cash Flow integrates revenue, delivered power cost, demand charges, operating expense, capital recovery, deposits, refunds, debt draw/repayment, interest, depreciation, tax, project free cash flow and equity cash flow. Headline outputs include project NPV, project IRR, equity IRR, payback, peak funding requirement and undiscounted cash generation.
📈 Valuation, scenarios and sensitivity
NPV by Energization Year performs a full revaluation for each candidate energization year and reports value lost versus the base schedule, value lost per year of slippage, probability of energizing by that date, probability-weighted NPV and the last energization year that still clears the hurdle.
IRR by Queue Outcome rebuilds cash flow for five outcomes: On time, Delayed 12 months, Delayed 24 months, Downgraded MW, and Cancelled/withdrawn. It calculates NPV, IRR, outcome probability, probability-weighted NPV, hurdle performance and value versus the on-time case.
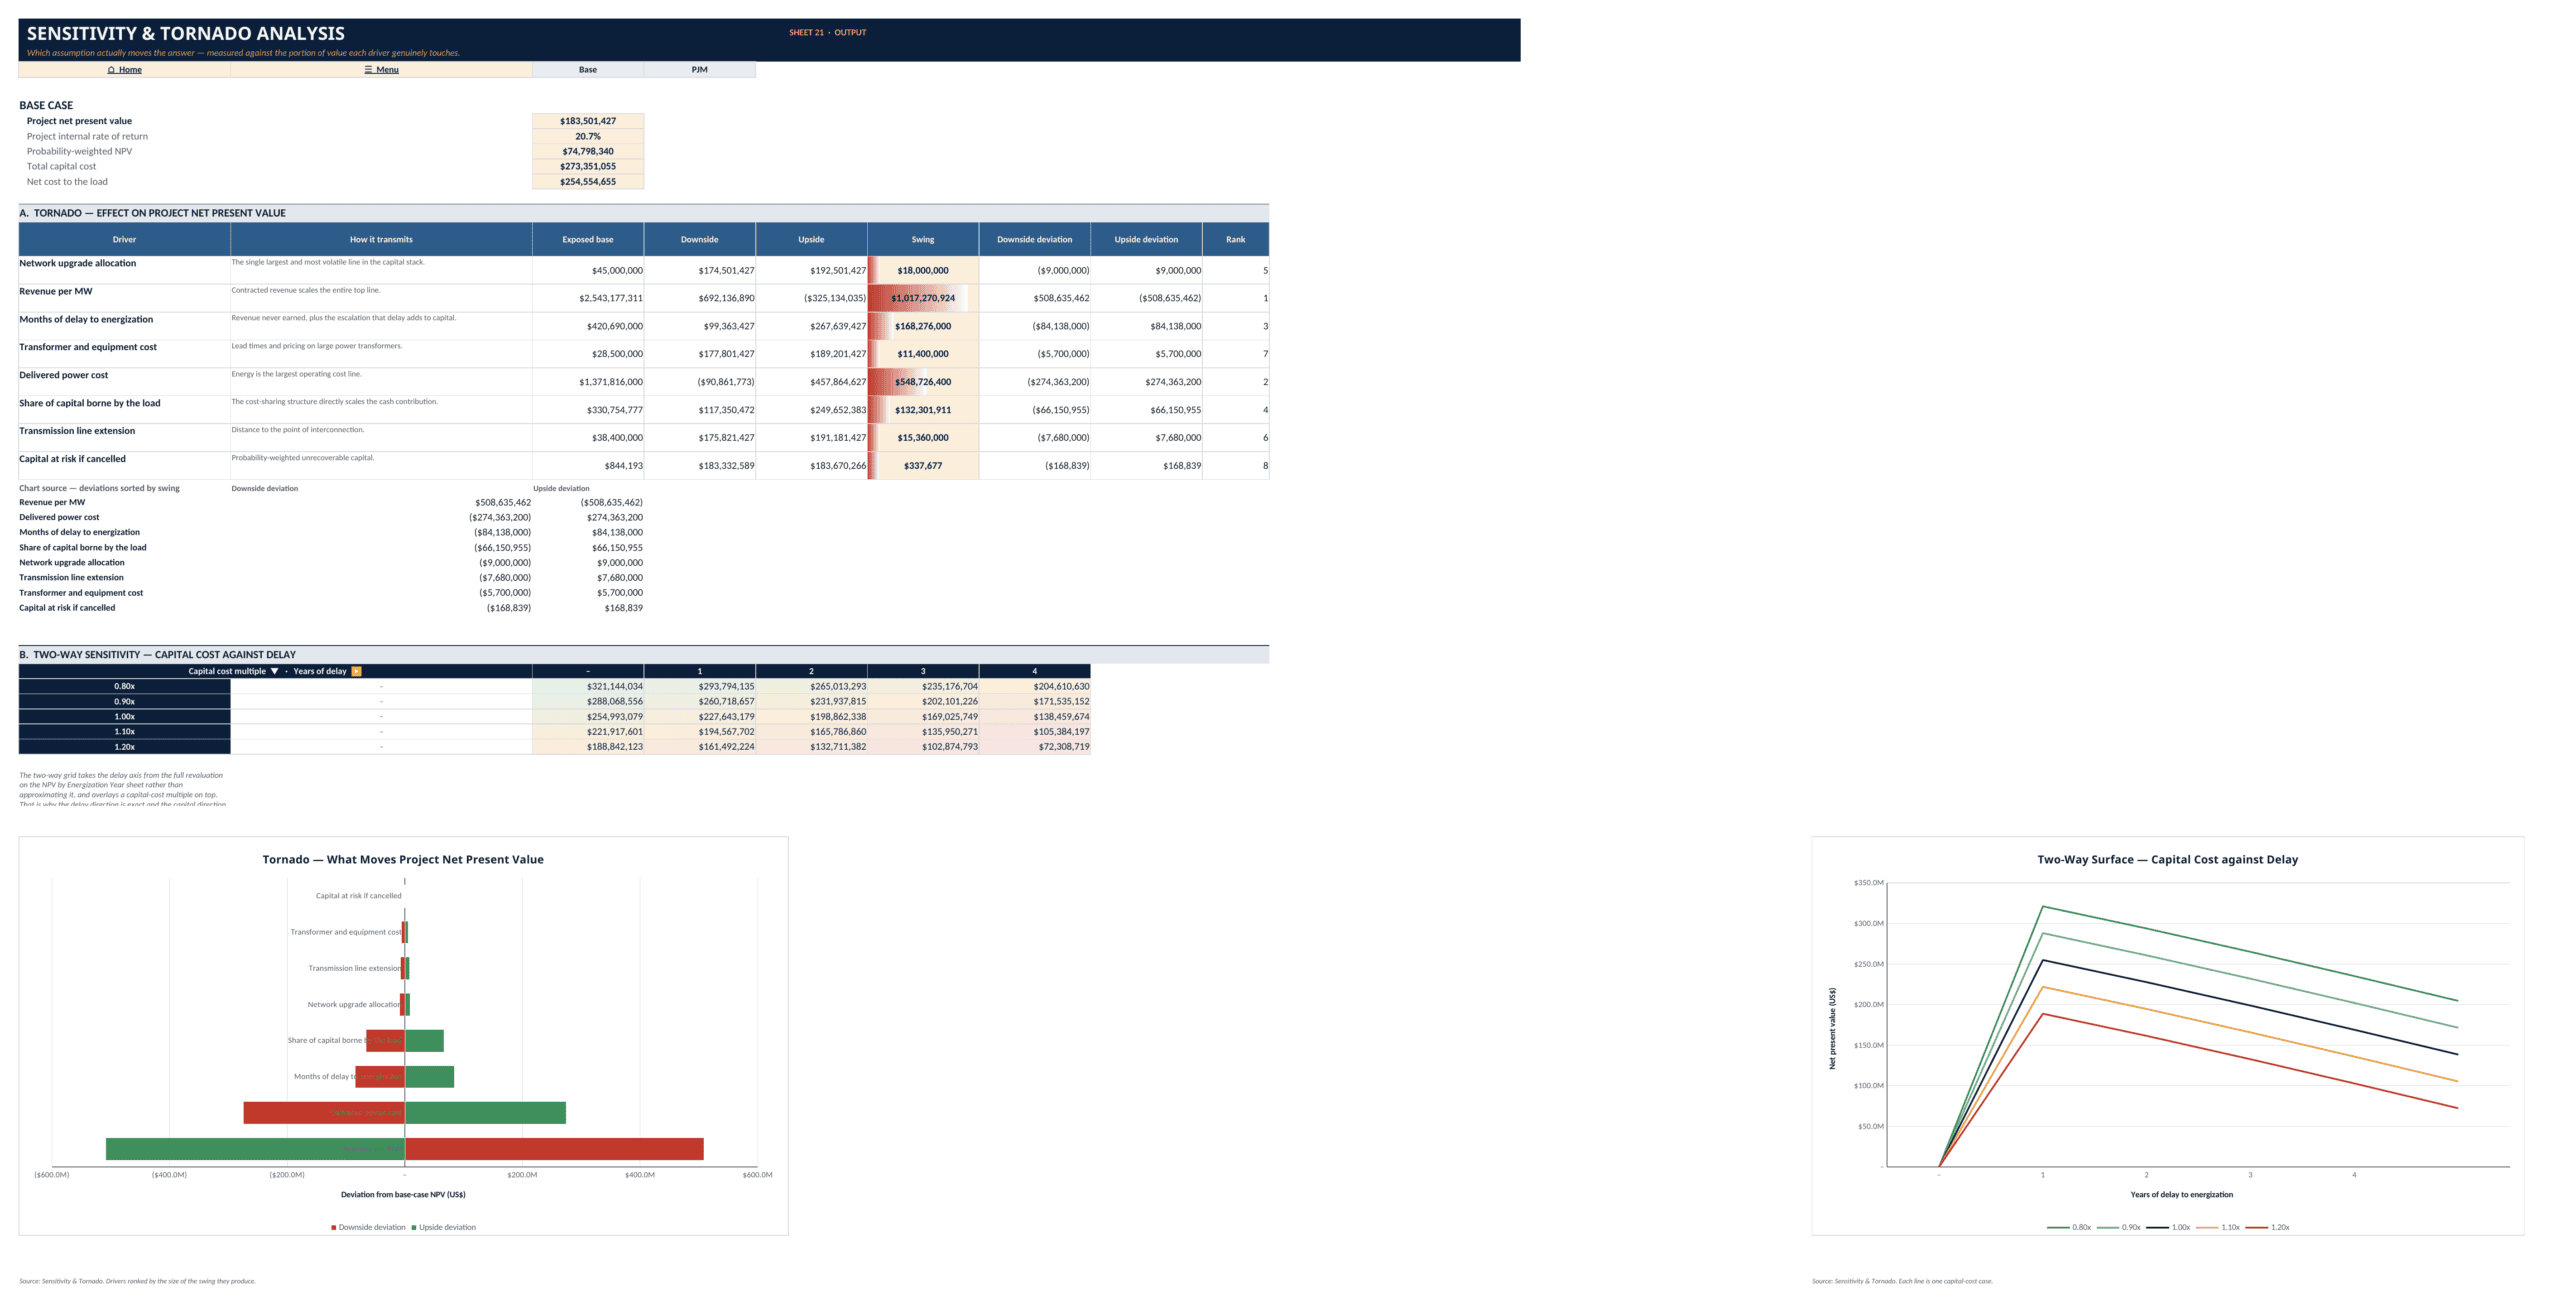
Sensitivity & Tornado ranks key drivers by impact on project NPV, including network-upgrade allocation, revenue per MW, delay, transformer/equipment cost, delivered power cost, capital share, line extension and cancellation exposure. A two-way sensitivity combines capital-cost multiples with years of delay.
📊 Dashboards and decision KPIs
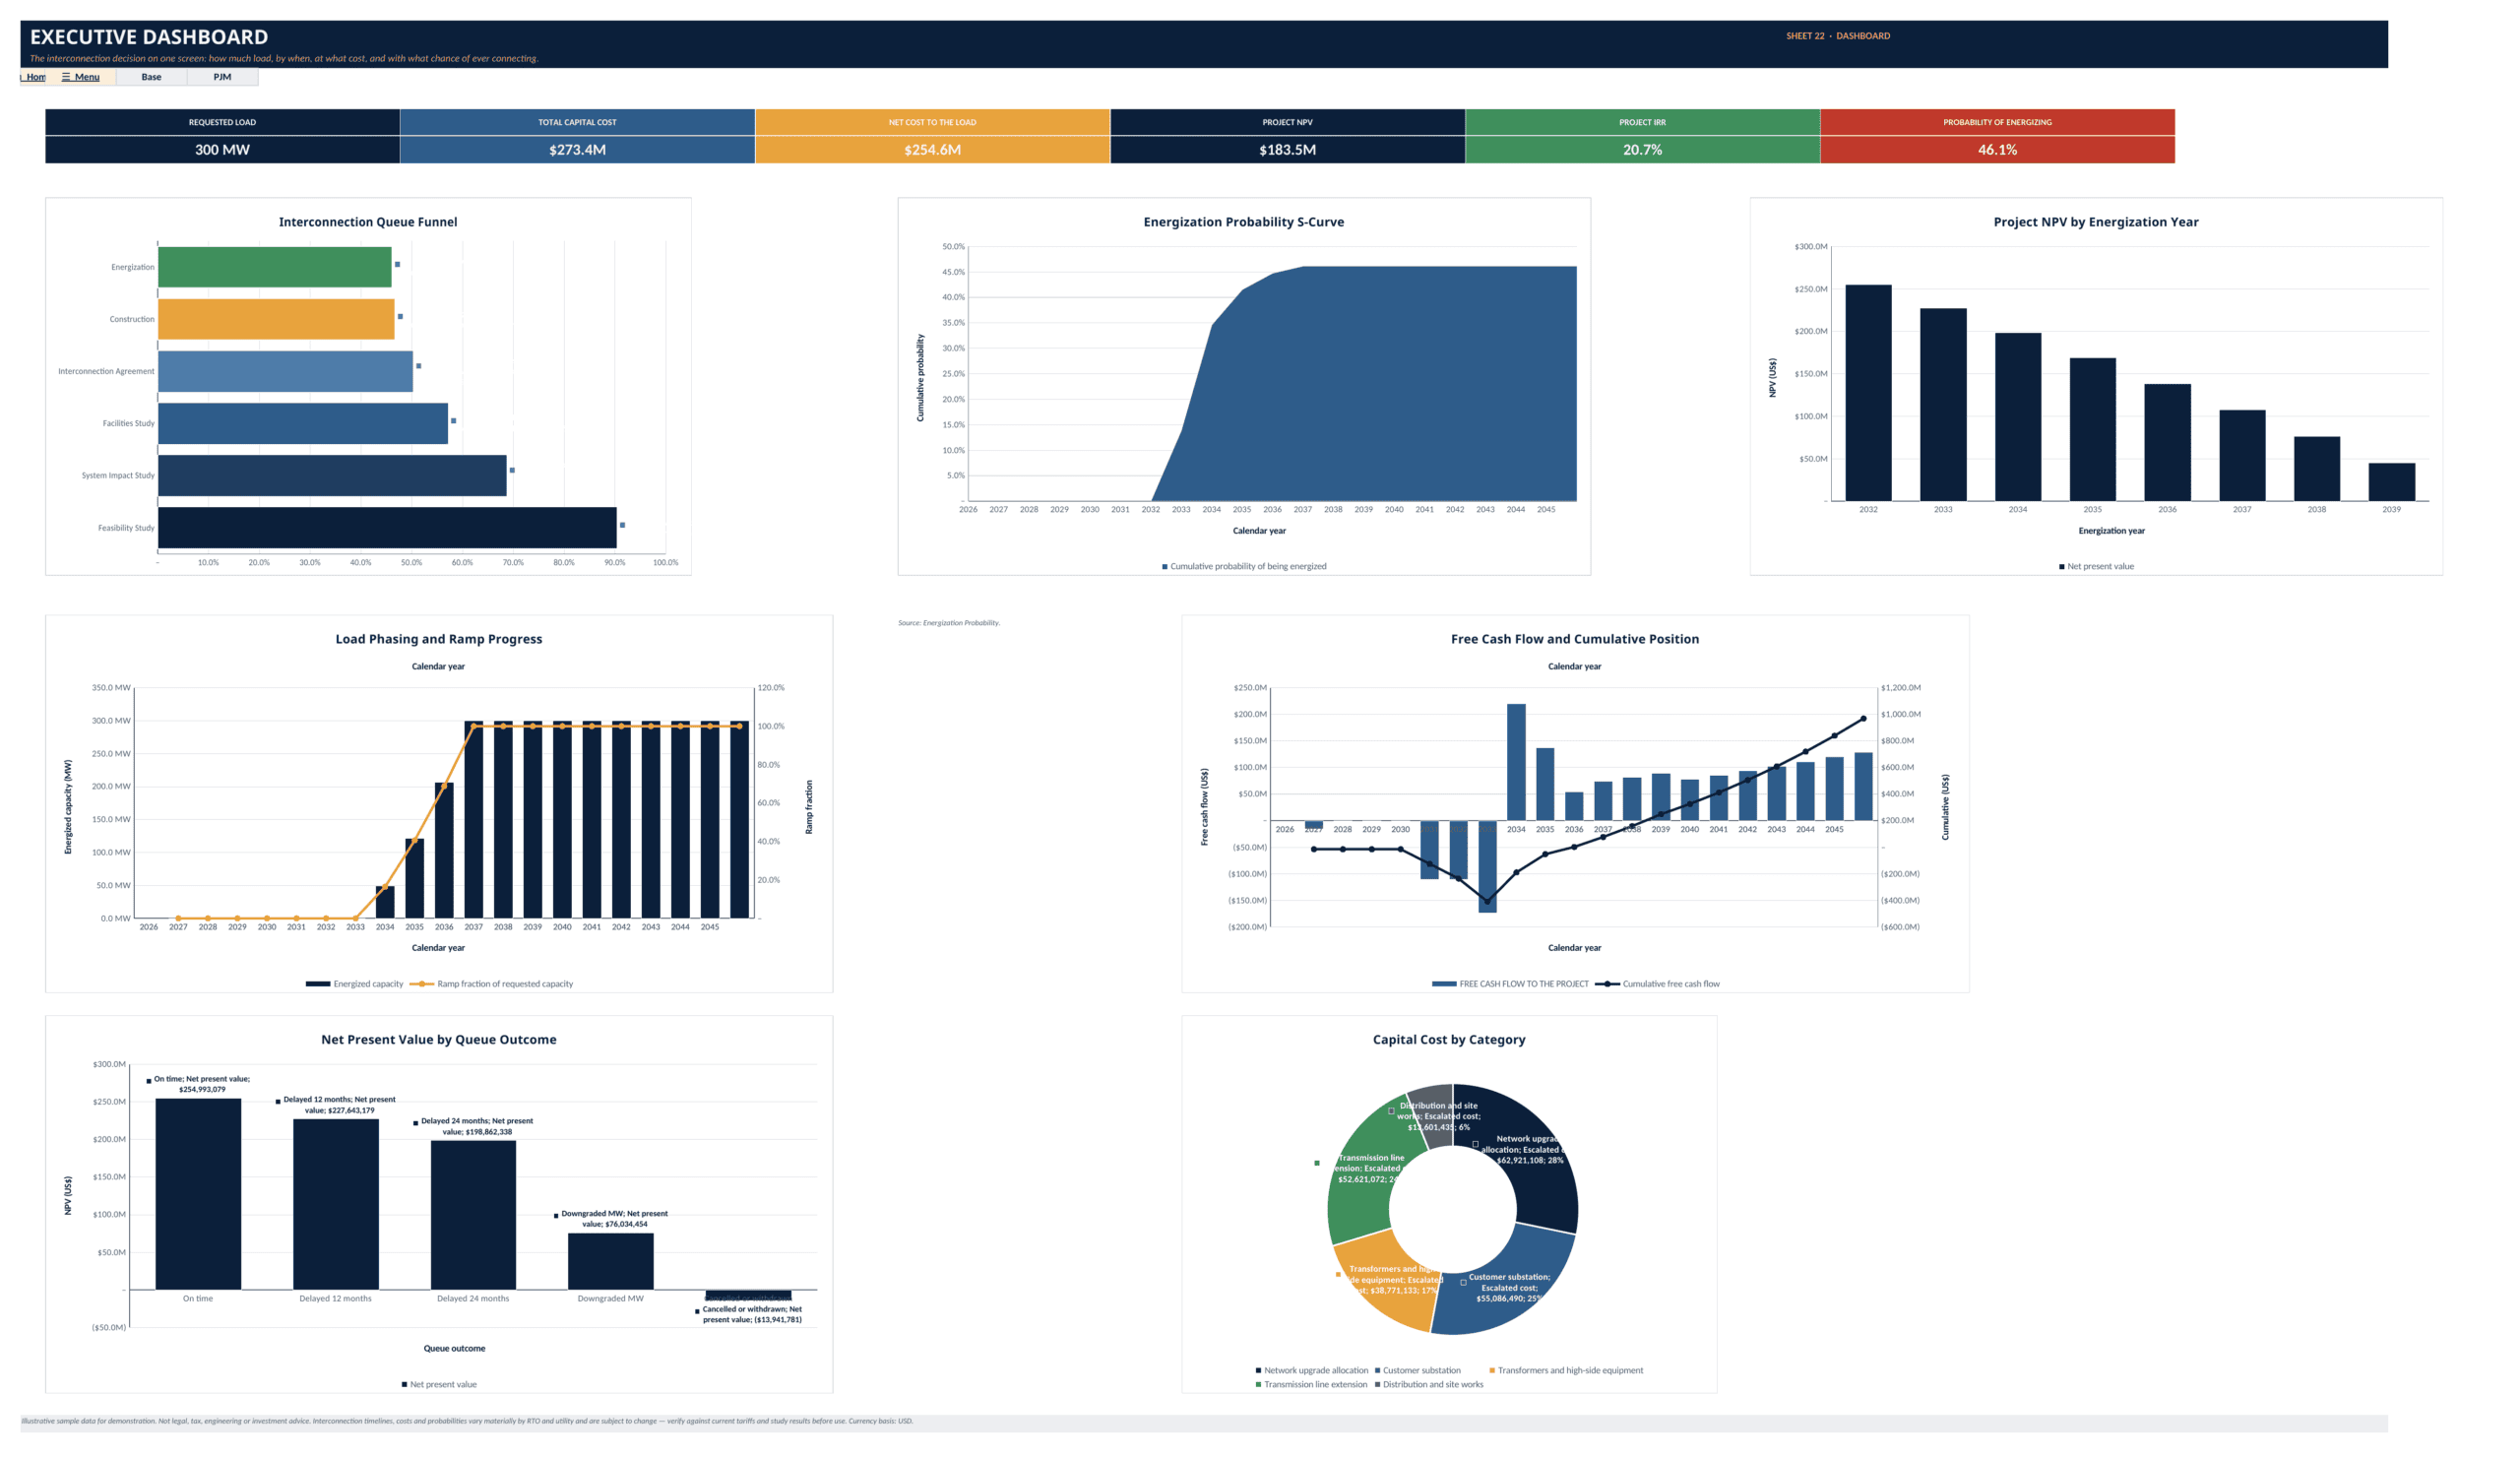
The Executive Dashboard brings requested load, total capital cost, net cost to the load, project NPV, project IRR and probability of energizing onto one page. The Risk Dashboard focuses on expected delay, cancellation probability, expected cancellation loss, maximum capital at risk, expected revenue lost to delay and the largest sensitivity swing. The Cost Dashboard summarizes total capital, capital per MW, net cost to the load, the cheapest funding structure, study cost and deposits posted.
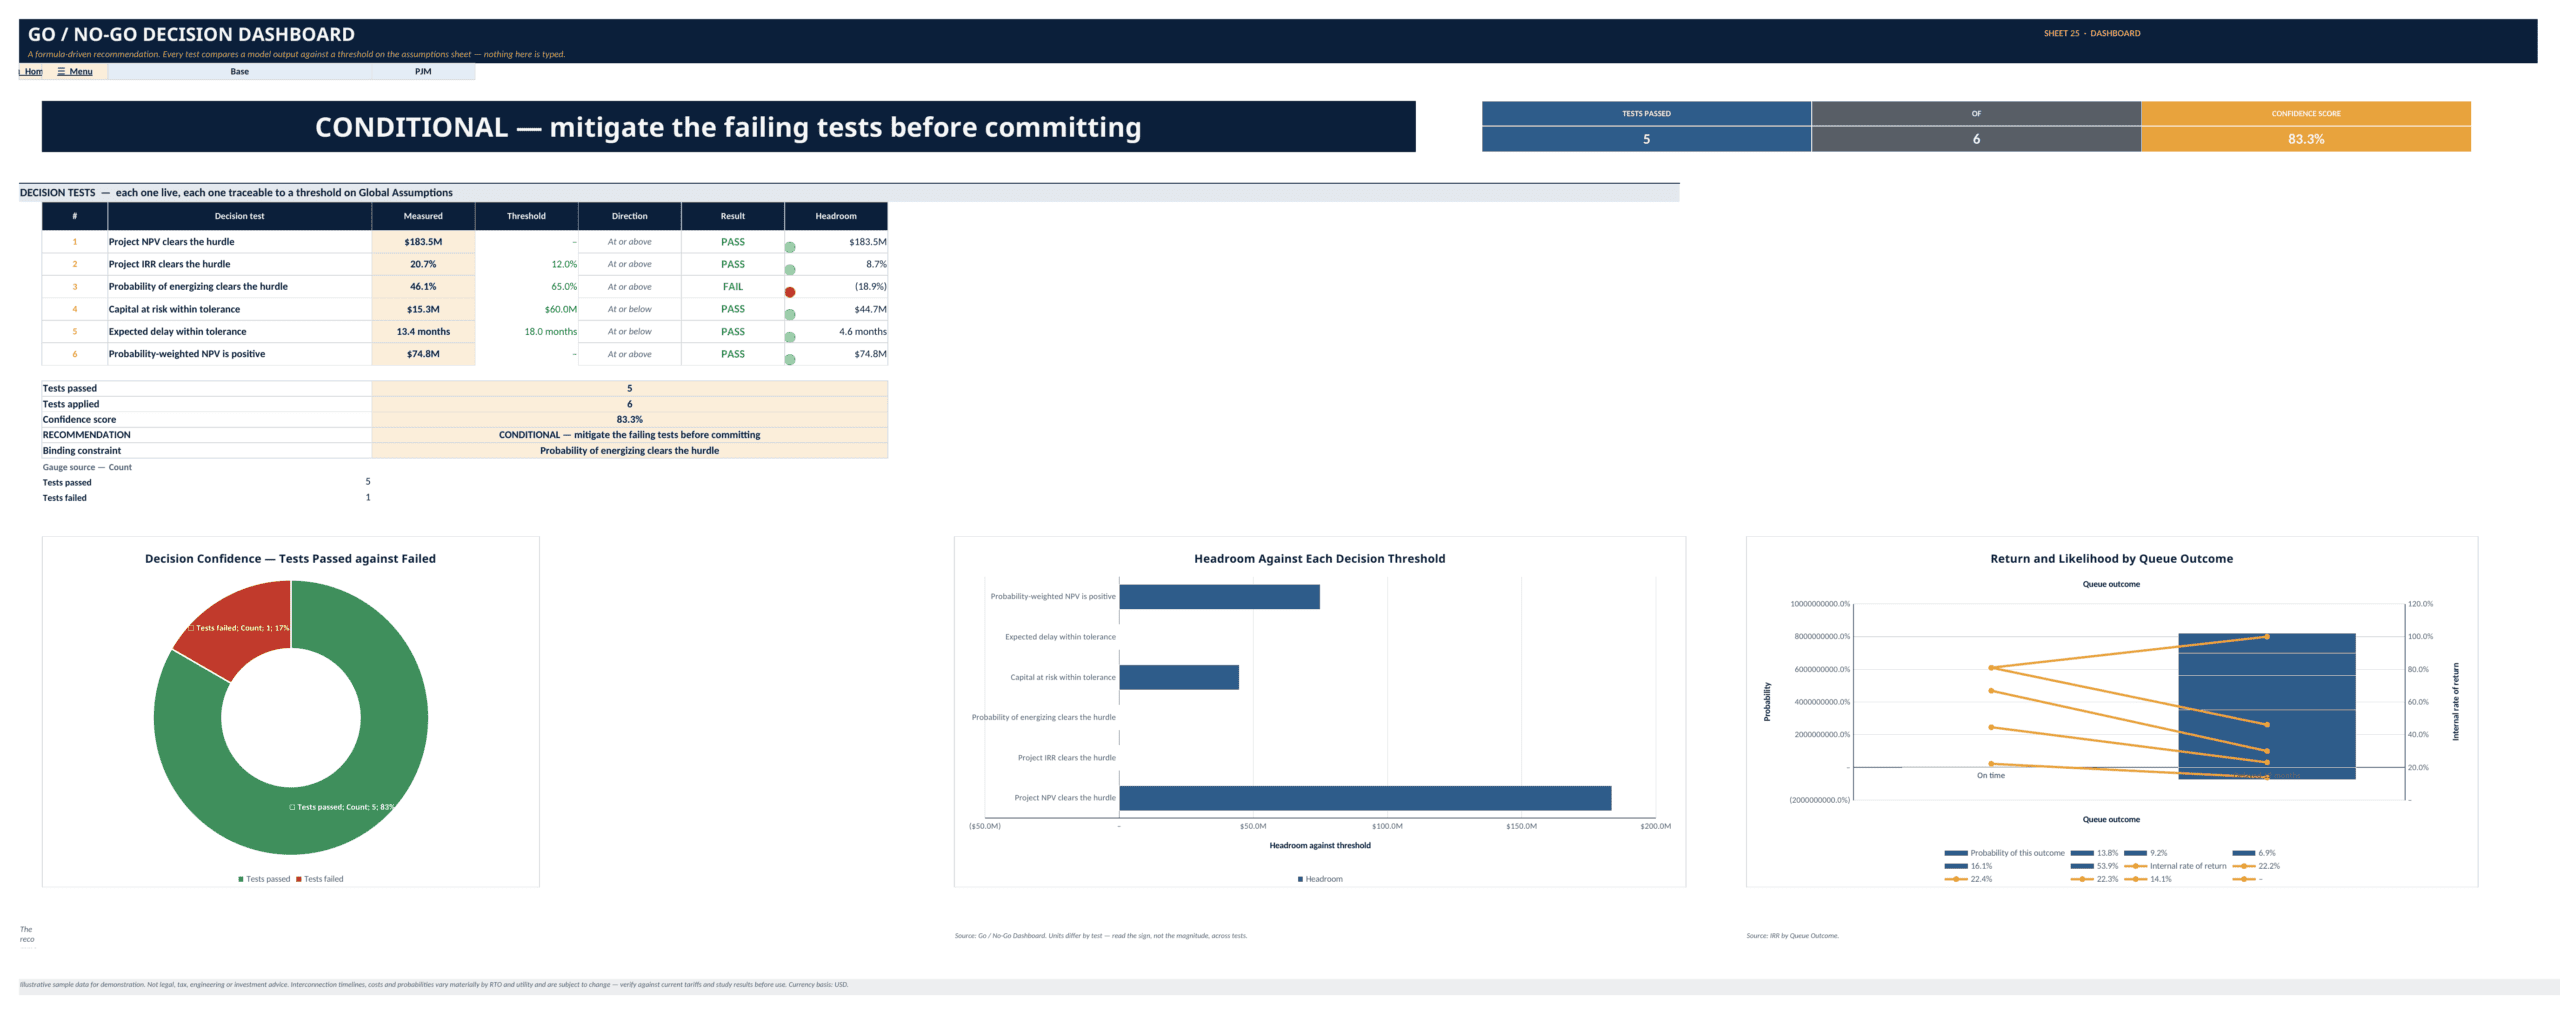
The Go / No-Go Dashboard applies six live threshold tests to NPV, IRR, probability of energizing, capital at risk, expected delay and probability-weighted NPV. It reports tests passed, confidence score, recommendation and the binding constraint so the user can see why the decision changes.
The workbook also contains a Navigation Map, a methodology sheet, and an Audit Log worksheet with formula-driven structural checks, supporting counts, chart inventory and reviewer sign-off fields.
✅ Practical use cases
- Interconnection planning: map the study, agreement, construction and energization sequence before committing major capital.
- Forecasting: build a 20-year capacity, energy, revenue, operating-cost and capital-spend forecast around the energization schedule.
- Profitability analysis: measure EBITDA, project NPV, project IRR, equity IRR, payback and cumulative cash generation.
- Cash-flow and funding planning: estimate deposits, contribution timing, debt draws, repayments, interest, tax and peak funding need.
- Pricing and contract economics: test revenue per MW, delivered power cost, demand charges, take-or-pay capacity and cost-sharing economics.
- Scenario analysis: compare Base, Upside, Downside and Custom assumptions under different territories and funding structures.
- Sensitivity analysis: identify which cost, delay, revenue and cancellation drivers create the largest change in project value.
- Operational phasing: translate a requested MW position into energized capacity, load ramp, billable capacity and annual energy.
- Queue-risk analysis: quantify stage attrition, cumulative probability of energizing, expected exit loss and cancellation exposure.
- Delay economics: quantify escalation, revenue lost, bridge-power economics and the value destroyed by later energization.
- Cost allocation: compare developer-funded, utility-recoverable and hybrid structures on contribution, refunds and net present cost.
- Valuation and go/no-go decisions: revalue the project by energization year and queue outcome, then compare results with live investment thresholds.
👥 Intended users
Built for data-center and digital-infrastructure developers, large-load industrial sponsors, corporate energy teams, project-finance and infrastructure professionals, utility/interconnection teams, investment committees, lenders, advisors, consultants, and analysts who need to connect queue timing and transmission-upgrade exposure directly to finance and valuation.
📦 Delivered files
The product is delivered as one editable Excel `.xlsx` workbook with 26 worksheets and 57 embedded charts. The marketplace upload package also includes a 26-page full-sheet PDF preview with one page per worksheet and a curated buyer-facing PNG screenshot set. The workbook is populated with illustrative sample data so users can understand the workflow before replacing inputs with project-specific assumptions.
Similar ProductsOther customers were also interested in...



 eFinancialModels
Electric Vehicle (EV) Charging Station Financial M...
With this comprehensive 5- or 10-year monthly tool, investors can assess the viability of setting up... Read more

Financial Model for Mobile App | Mobile App Busine...
The Mobile App Financial Plan Template in Excel allows you to develop financial projections when lau... Read more

 HenrySheykin
Food Truck Financial Model Excel Template
The Food Truck Financial Model helps entrepreneurs, founders, business owners, consultants, and anal... Read more

Green Hydrogen Production from Wind Energy Financi...
The Green Hydrogen from Wind Financial Model aims to comprehensively forecast a horizon of 40 years ... Read more

Simple Mutual Non-Disclosure Agreement Template
Protect your business secrets with ease using our Simple Mutual Non-Disclosure Agreement Template. S... Read more

Solar Energy Financial Model
The Solar Energy Financial Model Spreadsheet Template in Excel assists you in preparing a sophistica... Read more

 Peter Graf
The Customer-Centric Financial Model for Restauran...
Starting a restaurant without a financial plan is like driving a car blindfolded. You wouldn´t do i... Read more
You must log in to submit a review.