
0 ITEMS

Farm & Ranch Acquisition Model | Lender Underwriting, TDCR & the Land Paradox Bridge
The collateral will support a loan this big – can the cash flow service it? US cropland yields 2.76% gross while farm real estate debt costs 6.79%. This model prints the gap in dollars, uses the FFSC term debt coverage ratio instead of a corporate DSCR, sizes the operating line on the intra-year cash trough as 7 CFR 762.125 requires, and prices the annually renewable leases the seller does not own. Row crop, dairy and cow-calf ranch. 14 sheets, Excel + Google Sheets, plus a 9-page guide and a free PDF demo.
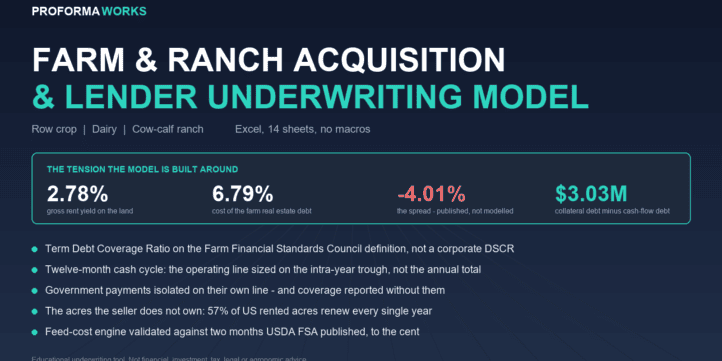
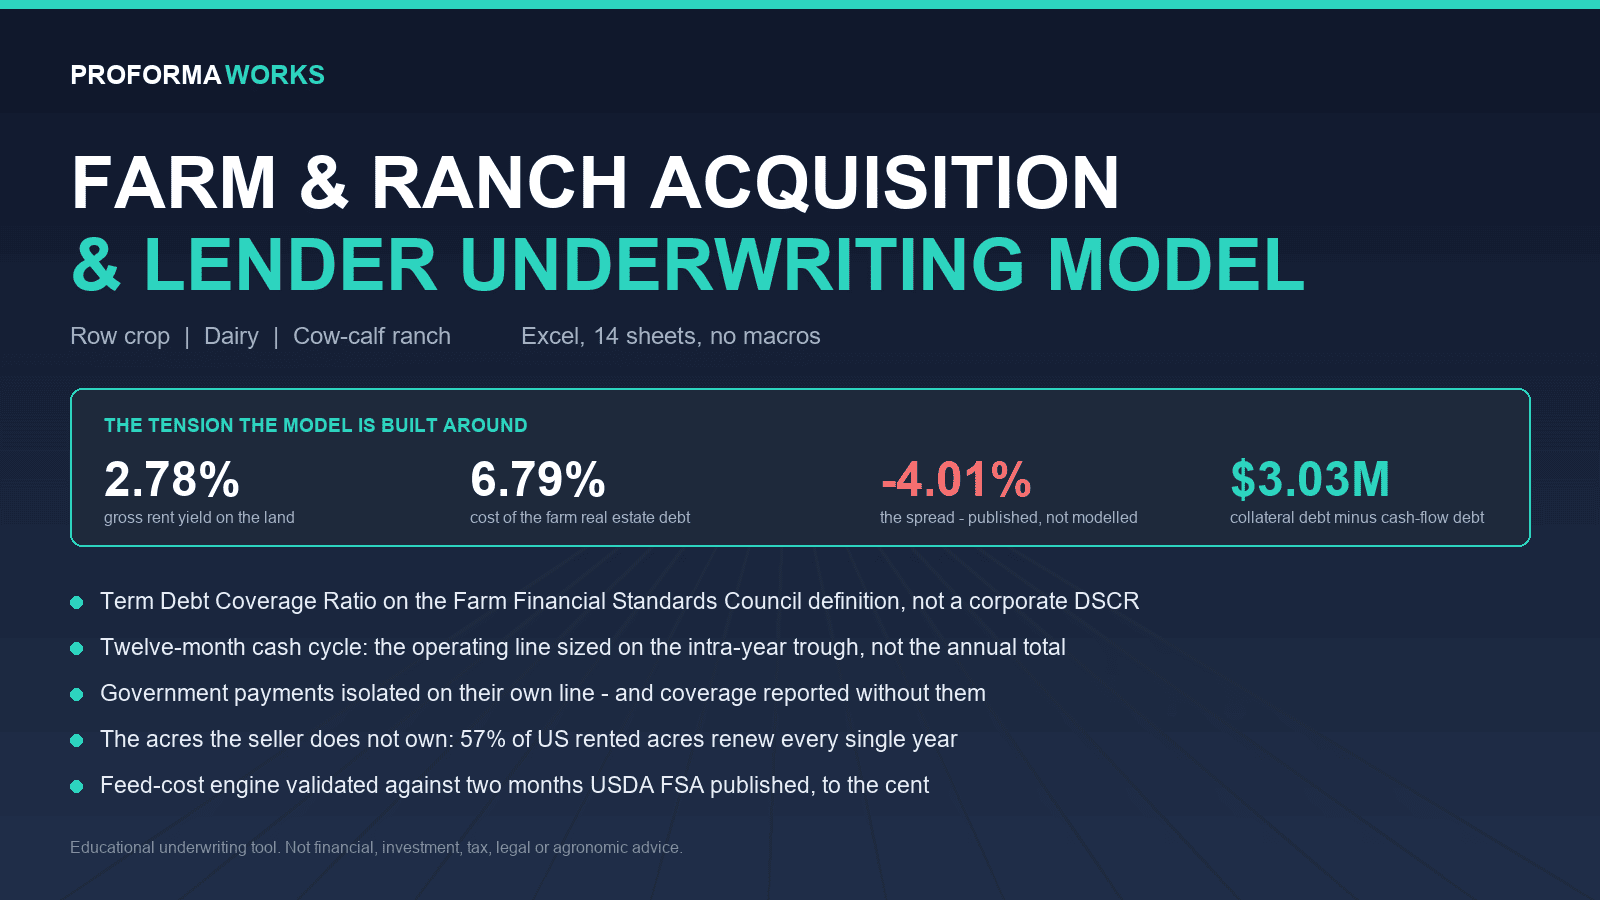
Every farm template on the market is a ten-year forecast for someone who is STARTING a farm. This one underwrites the purchase of a farm that already exists, the way the lender will.
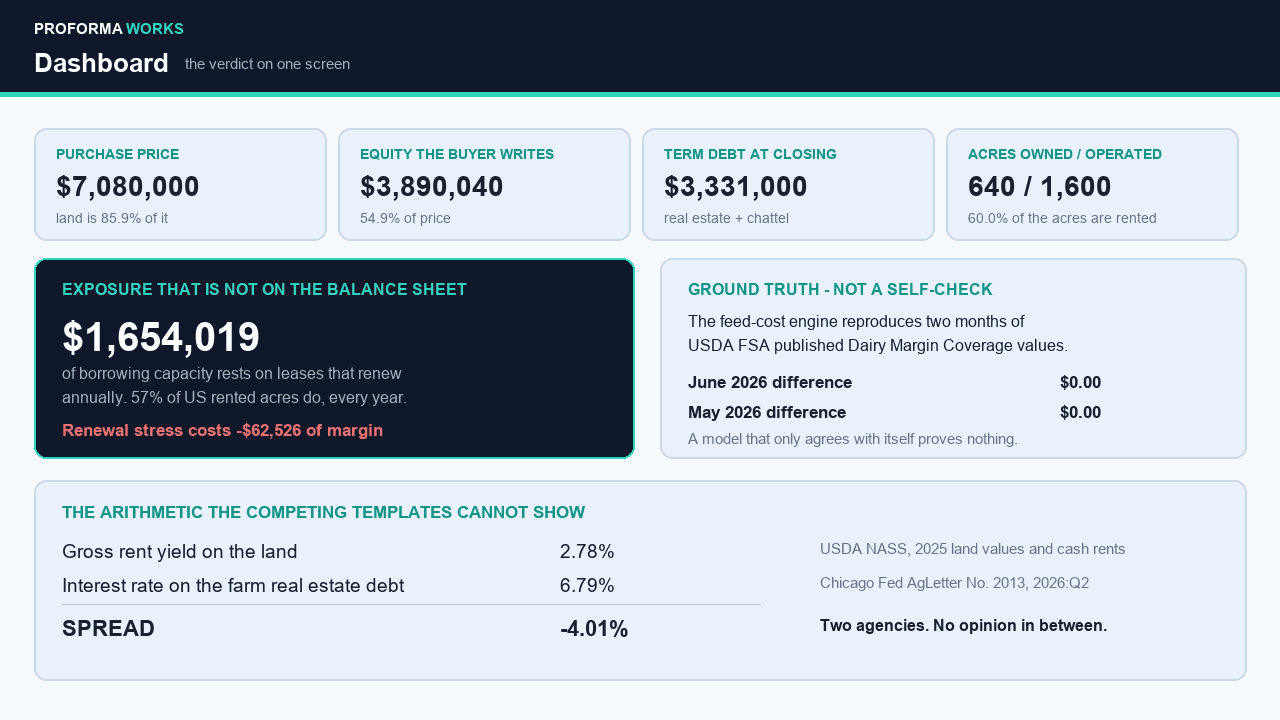
It is built around two published numbers. United States cropland rented for $161 an acre in 2025 against a cropland value of $5,830 an acre, a gross rent yield of 2.76% (USDA NASS). The average interest rate on farm real estate loans in 2026:Q2 was 6.79% (Federal Reserve Bank of Chicago, AgLetter No. 2013, 79 responding banks). The current income of the asset sits roughly four hundred basis points below the cost of the debt that finances it. Two numbers, two agencies, no opinion in between.
That is not a claim that farmland is a bad asset. It is a statement about which test a LEVERAGED purchase has to pass. Appreciation does not make a loan payment.
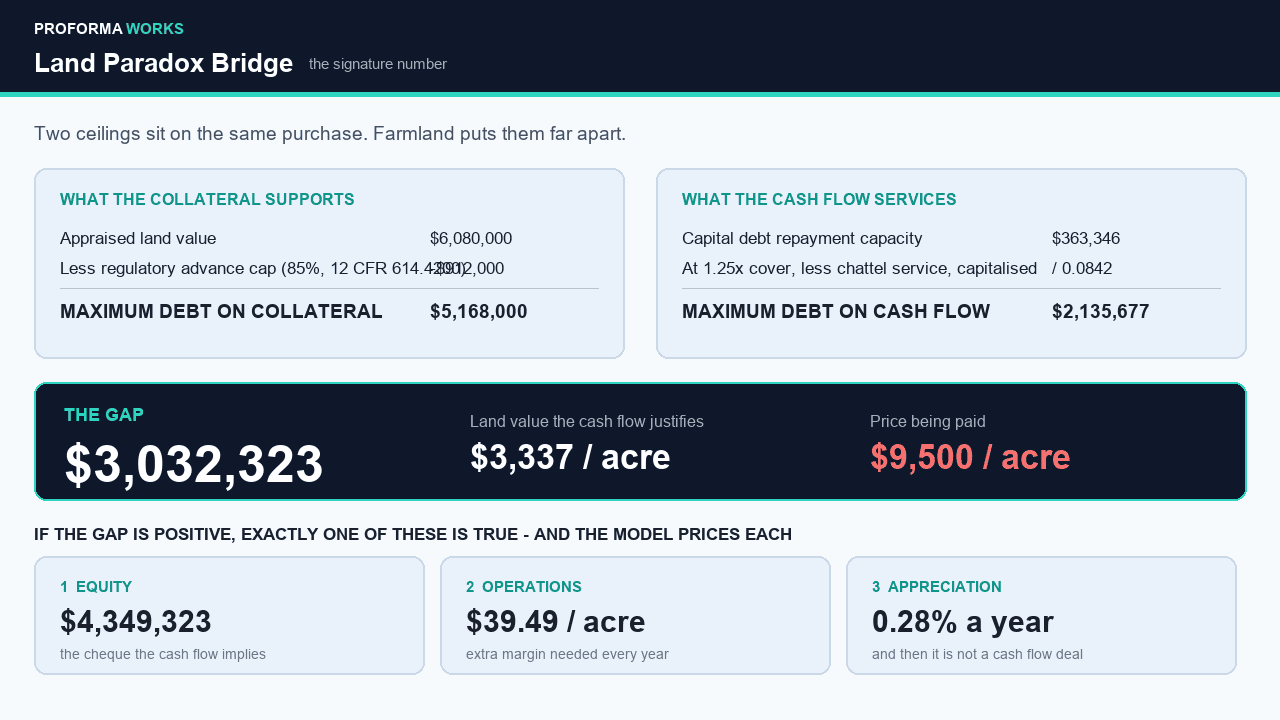
The signature output: two ceilings on the same purchase. What the COLLATERAL supports, capped at the 85% loan-to-value limit of 12 CFR 614.4200. And what the CASH FLOW services, built from the Farm Financial Standards Council capital debt repayment capacity at your target coverage. In the default case those read $5,168,000 and $2,135,677, a gap of $3,032,323, which is the exact amount of debt the land would secure and the farm cannot service. Per acre: the operation supports lending of $3,337 against a price of $9,500. Neither side contains a risk premium or a discount rate.
Three things it does that a farm budget does not.
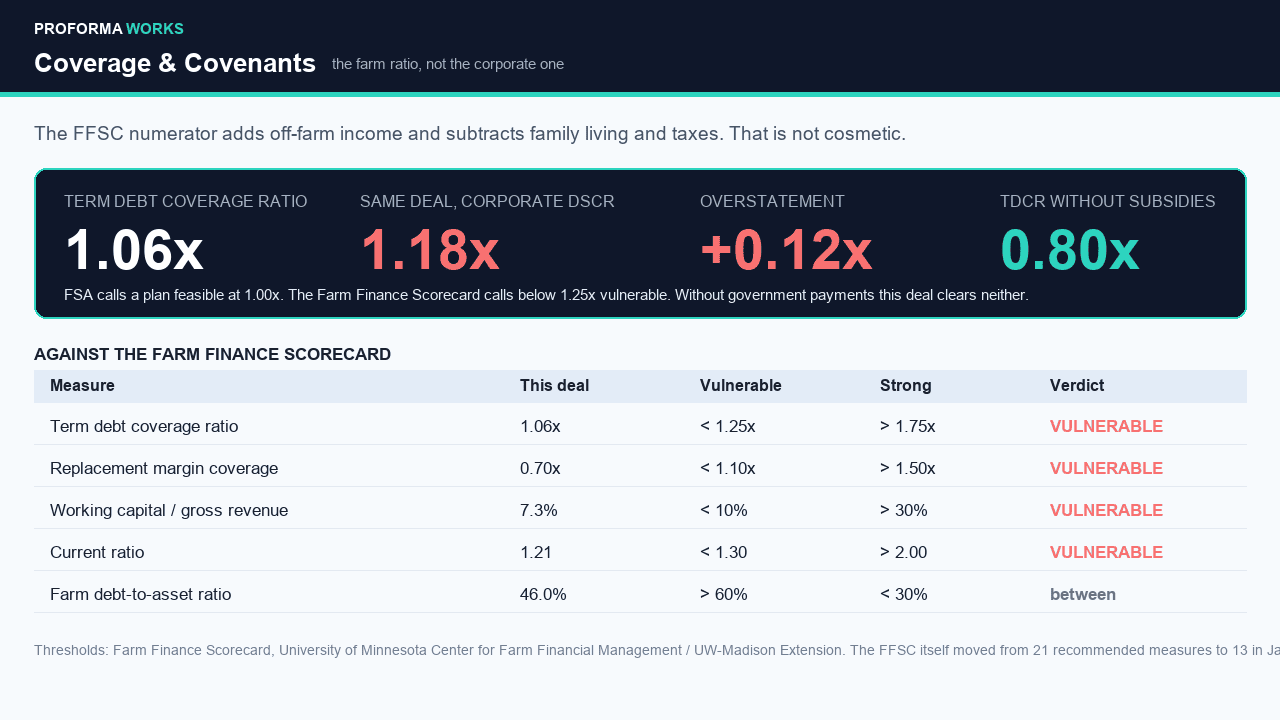
- It uses the TERM DEBT COVERAGE RATIO, whose numerator adds off-farm income and subtracts family living withdrawals and income taxes, and prints the corporate DSCR beside it: 1.06x against 1.18x on identical numbers. Set family living equal to off-farm income, tax to zero and the line rate to zero and the two become identical to the last decimal, which proves the difference is exactly those three things and nothing else.
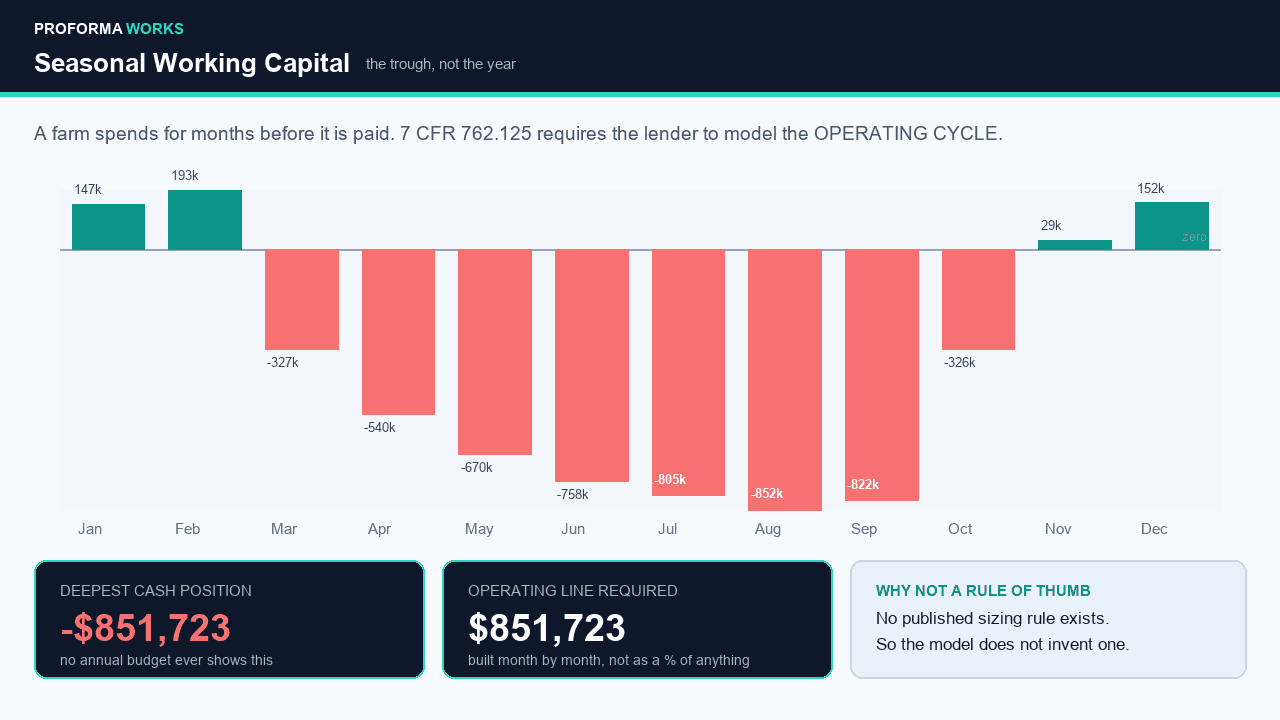
- It sizes the operating line on the intra-year trough. A farm spends cash for months before it is paid; the annual total never goes negative, August does. 7 CFR 762.125 requires the lender to model the operating cycle, not the calendar year.
- It separates the acres the seller does not own. 39.3% of US farmland is rented, over half the cropland, and 57% of rented acres renew every single year. The model prices what a failed renewal does to coverage.
Government payments have their own line, and coverage is reported without them. They were 28.9% of US net farm income in the 2026 forecast against 7.9% in 2024. In the default case coverage falls from 1.06x to 0.80x without them, straight through the FSA regulatory floor of 1.00x.
Three subtypes on one switch: row crop, dairy and cow-calf ranch, each with its own revenue engine and its own inputs that survive the switch.
Validated against something it did not write. The dairy feed-cost engine reproduces two months of Dairy Margin Coverage values published independently by USDA Farm Service Agency, to the cent, on a sheet you can check rather than trust.
Fourteen sheets. Excel and Google Sheets, no macros, no external links, no iterative calculation. A 9-page user guide is included. Every benchmark carries its source and its date, and where none exists the sheet says so instead of inventing one: no farmland cap rate, no acres per animal unit, no MACRS recovery period per asset, no operating line sizing rule.
Educational underwriting tool. Not financial, investment, tax, legal or agronomic advice. It does not predict prices, yields or land values and does not tell you what a farm is worth.
Similar ProductsOther customers were also interested in...



 eFinancialModels
Electric Vehicle (EV) Charging Station Financial M...
With this comprehensive 5- or 10-year monthly tool, investors can assess the viability of setting up... Read more

Financial Model for Mobile App | Mobile App Busine...
The Mobile App Financial Plan Template in Excel allows you to develop financial projections when lau... Read more

 HenrySheykin
Food Truck Financial Model Excel Template
The Food Truck Financial Model helps entrepreneurs, founders, business owners, consultants, and anal... Read more

Green Hydrogen Production from Wind Energy Financi...
The Green Hydrogen from Wind Financial Model aims to comprehensively forecast a horizon of 40 years ... Read more

Simple Mutual Non-Disclosure Agreement Template
Protect your business secrets with ease using our Simple Mutual Non-Disclosure Agreement Template. S... Read more

Solar Energy Financial Model
The Solar Energy Financial Model Spreadsheet Template in Excel assists you in preparing a sophistica... Read more

 Peter Graf
The Customer-Centric Financial Model for Restauran...
Starting a restaurant without a financial plan is like driving a car blindfolded. You wouldn´t do i... Read more
You must log in to submit a review.