
0 ITEMS

Startup Financial Forecast: 8 Steps to Build One

Building a financial forecast feels intimidating when you’ve never done it before, but investors don’t expect perfection. They expect logic, honesty, and a clear connection between your numbers and your business strategy.
Key Takeaways
- A startup financial forecast requires 3 core documents: a Profit and Loss statement, a cash flow statement, and a balance sheet, and investors expect all three.
- Most investors want monthly projections for the first 12 to 18 months, then quarterly projections through year 3 to 5.
- Bottoms-up forecasting, which starts with individual unit economics rather than market share percentages, produces assumptions that are 3 to 5 times more defensible in investor meetings.
- Burn rate and runway are the 2 metrics investors check first: pre-seed startups typically target 12 to 18 months of runway after each raise.
- Hockey-stick revenue curves are the single most common credibility killer in startup pitch decks.
- Scenario planning with 3 cases (base, conservative, optimistic) shows investors you understand risk, not just upside.
- eFinancialModels offers a free startup financial projections template with pre-built P&L, cash flow, and balance sheet tabs.
What Is a Startup Financial Forecast and Why Investors Demand One
A startup financial forecast is a forward-looking model that projects your revenue, expenses, and cash position over a defined period, typically 3 to 5 years. It is not a guarantee of the future. It is a structured argument that your business model works at scale.
Investors use your forecast to answer four questions: Can this business reach profitability? How much capital does it need? What does the return look like? And does the founder understand their own unit economics? According to CB Insights’ analysis of 431 venture-backed startups that shut down since 2023, running out of capital is the most common cause of failure, cited in 70% of cases.
A forecast that cannot answer those four questions signals a founder who hasn’t thought through the business deeply enough.
Your forecast also serves an internal purpose. It becomes the operating plan your team executes against, the benchmark you compare actuals to each month, and the early-warning system that tells you when to cut costs or accelerate hiring.
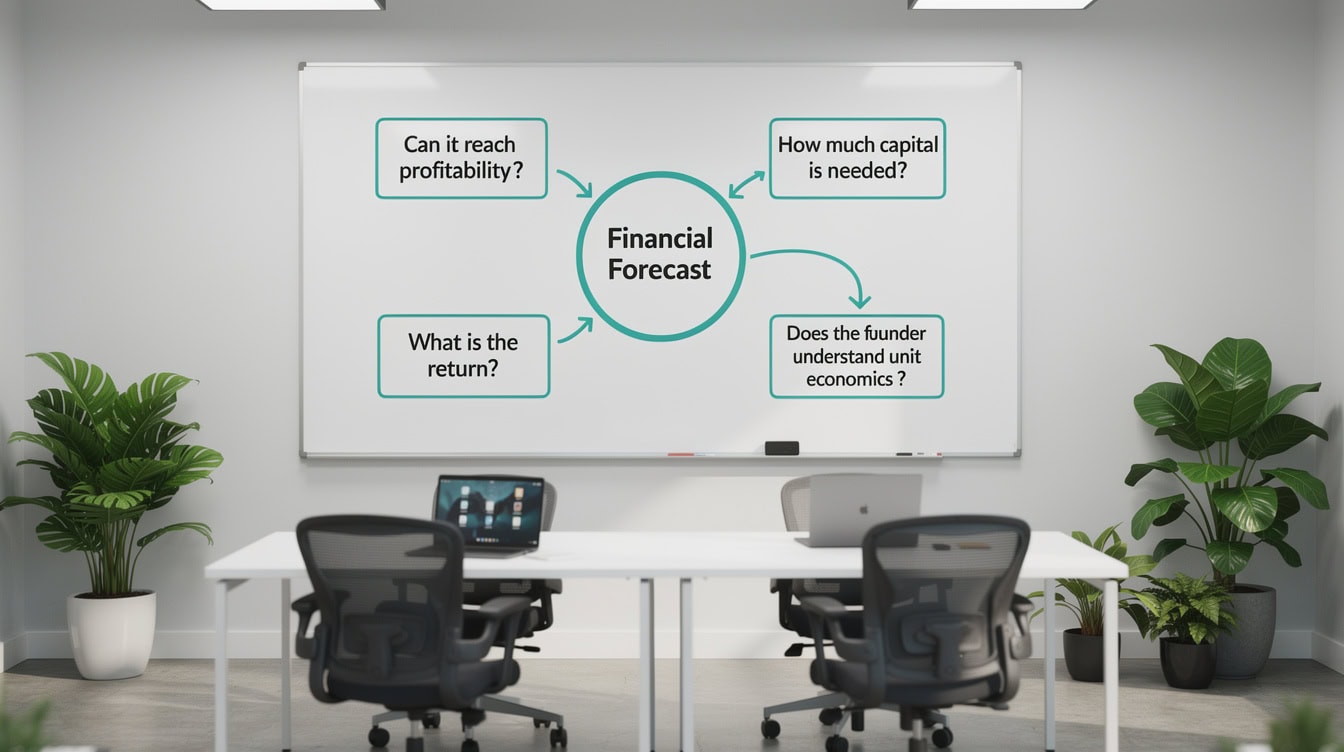
Investors use your forecast to answer four specific questions. Build your model to address each one explicitly.
The Three Essential Financial Statements You Must Build
Every complete startup financial forecast contains three documents. Each one tells a different part of the story.
Profit and Loss Statement (P&L): The P&L, also called an income statement, shows revenue minus expenses to arrive at net profit or net loss. For early-stage startups, this statement will show losses for the first several years. That’s expected. What investors scrutinize is the gross margin (revenue minus the direct cost of delivering your product or service), because gross margin reveals whether the core business model is viable before overhead is added.
Cash Flow Statement: The cash flow statement tracks actual cash moving in and out of the business each month. A company can show accounting profit on a P&L while running out of cash, because revenue recognition and cash collection don’t always align. The cash flow statement prevents that blind spot. It is the document that determines your runway, which is how many months of operating expenses your current cash balance covers.
Balance Sheet: The balance sheet shows what your company owns (assets), what it owes (liabilities), and what’s left for shareholders (equity) at a specific point in time. For pre-revenue startups, the balance sheet is simple. As you raise capital and acquire assets, it becomes the document that shows investors the financial health of the entity itself.
You can explore pre-built templates for all three statements in the EFM financial statements collection.
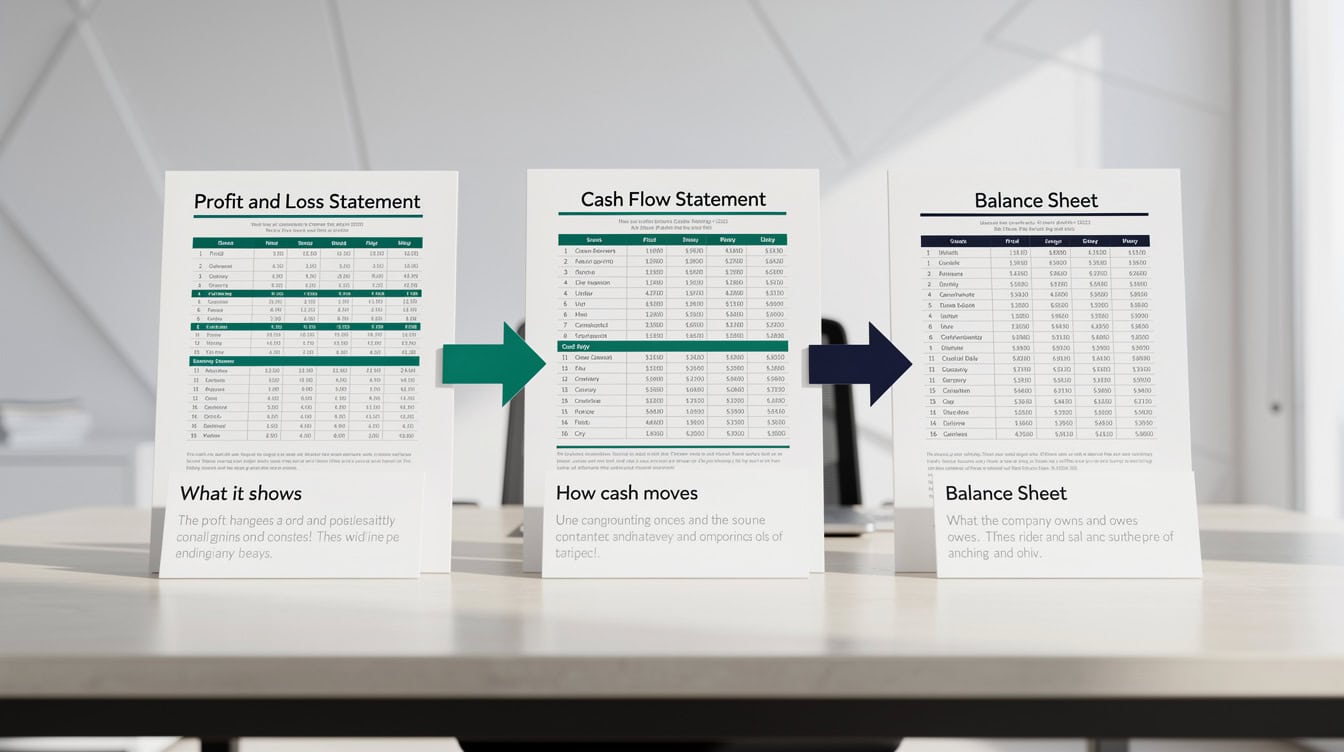
The three financial statements are linked: net income from the P&L feeds the cash flow statement, which updates the balance sheet.
Step 1: Build Your Revenue Model from the Ground Up
Start with revenue, because every other line in your forecast flows from it. The most credible approach for startups is bottoms-up forecasting, which means building your revenue projection from individual customer or transaction assumptions rather than claiming a percentage of a large market.
Here’s the difference in practice:
- Top-down (weak): “The SaaS market is $200 billion. We’ll capture 0.1%, which equals $200 million in year 3.”
- Bottoms-up (strong): “We close 8 new customers per month in month 1, growing 15% month-over-month. Average contract value is $12,000 per year. By month 12, we have 142 customers generating $1.7 million in ARR.”
The bottoms-up approach forces you to think through your sales capacity, conversion rates, and pricing. Those assumptions are testable and adjustable. A market-share claim is not.
For a SaaS business, your revenue model should include: number of new customers acquired per month, monthly churn rate (the percentage of customers who cancel each month), average revenue per user (ARPU), and any expansion revenue from upsells. For e-commerce, model average order value, order frequency, and customer acquisition cost. For marketplaces, model gross merchandise volume (GMV) and your take rate.
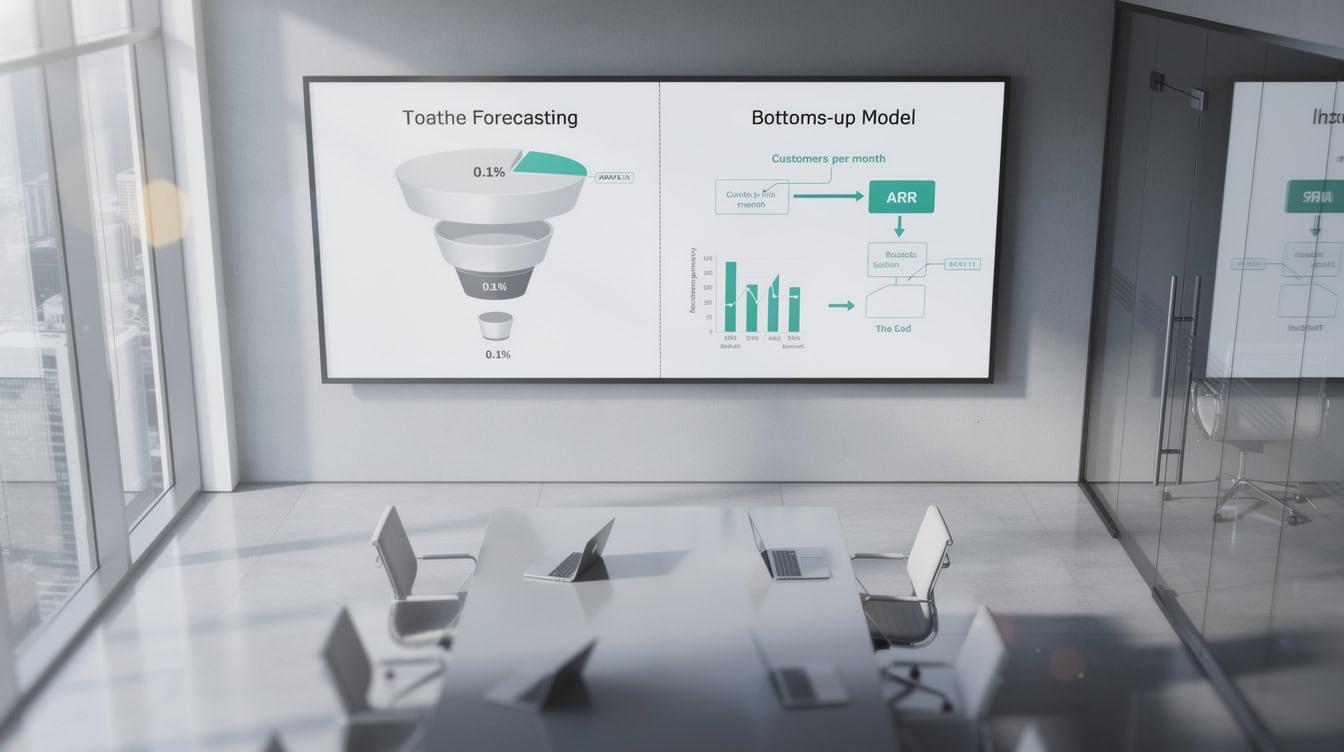
Bottoms-up forecasting builds from individual customer assumptions. It produces assumptions investors can actually stress-test.
Step 2: Map Your Cost Structure and Expense Projections
Once revenue is modeled, build your cost structure in two layers: cost of goods sold (COGS) and operating expenses (OpEx).
COGS are the direct costs of delivering your product or service. For a SaaS company, COGS typically includes hosting infrastructure, customer support, and third-party software licenses. For a physical product, COGS includes manufacturing, materials, and fulfillment. Gross margin equals revenue minus COGS divided by revenue. Benchmark gross margins vary significantly by business model: SaaS companies typically target 70 to 80% gross margins, while hardware companies often operate at 30 to 50%.
Operating expenses cover everything else: sales and marketing, research and development, and general and administrative costs (G&A). The largest line item for most startups is headcount. Build your hiring plan month by month, including salary, payroll taxes (US employers pay a combined FICA rate of 7.65%, per IRS Topic No. 751), and benefits. Founders consistently underestimate hiring costs by 20 to 30% when they forget taxes and benefits.
Link every expense line to a business driver where possible. Sales headcount should connect to your sales capacity model. Marketing spend should connect to your customer acquisition cost (CAC) assumption. This linkage makes your model dynamic and your assumptions auditable.
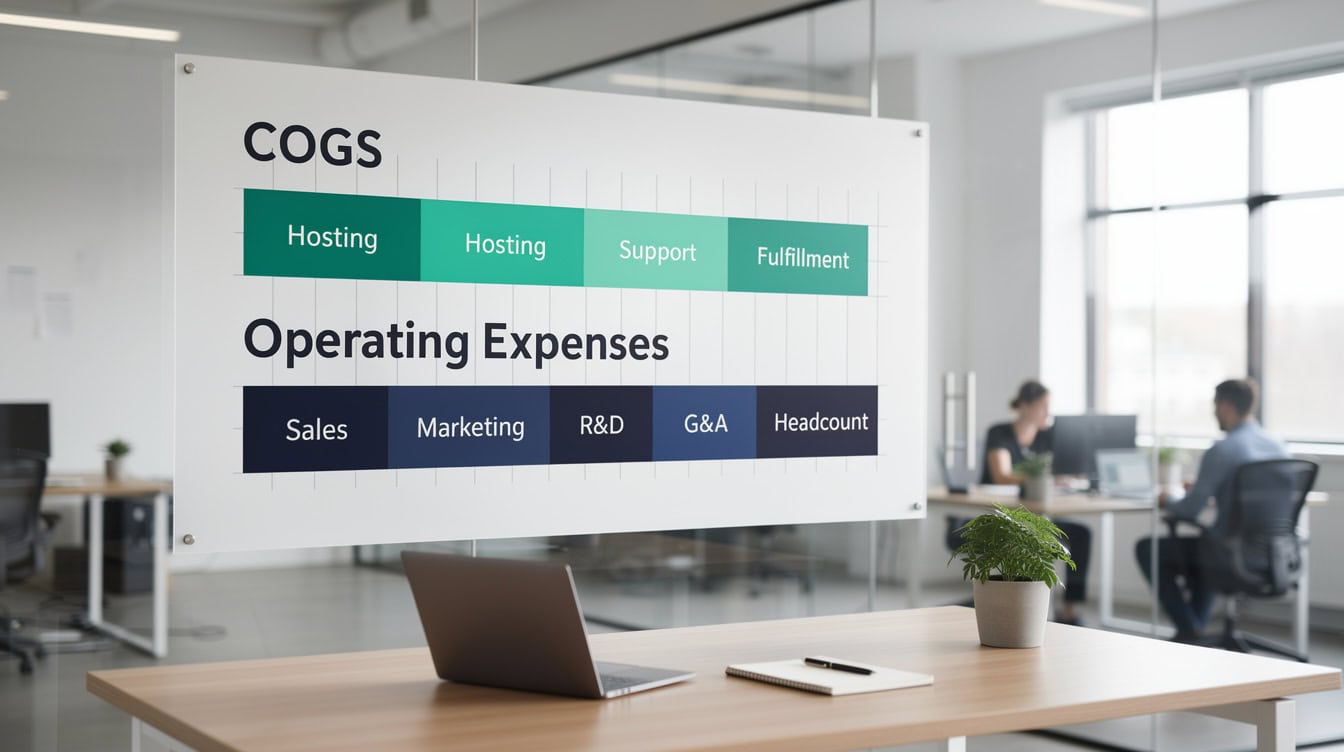
Gross margin equals revenue minus COGS. Operating expenses sit below the gross margin line and include headcount, the largest cost for most startups.
Step 3: Project Cash Flow and Calculate Your Runway
Cash flow is where your P&L assumptions become real. Your monthly cash flow equals cash collected from customers minus cash paid to vendors, employees, and other obligations.
Runway is the number of months your current cash balance will last at your current monthly burn rate. The formula is straightforward:
Runway (months) = Cash Balance / Monthly Net Burn Rate
Net burn rate equals total cash out minus total cash in each month. If you have $600,000 in the bank and your net burn is $50,000 per month, your runway is 12 months.
Pre-seed startups typically raise enough to cover 12 to 18 months of runway, giving them time to hit milestones before the next raise. Seed-stage companies often target 18 to 24 months. The Federal Reserve’s 2023 Report on Employer Firms, drawn from its Small Business Credit Survey, found that close to half of firms had difficulty paying operating expenses or navigating uneven cash flow.
Don’t forget working capital needs. If customers pay on 30 or 60-day terms, you collect cash later than you recognize revenue. That gap must be funded. Model your accounts receivable (money owed to you) and accounts payable (money you owe suppliers) separately to capture this timing difference.

Runway = Cash Balance / Monthly Net Burn. Pre-seed startups should target at least 12 to 18 months of runway after each raise.
Worked Example: SaaS Startup Month-12 Revenue Calculation
Here’s the math for a simple SaaS bottoms-up revenue model:
- Starting customers (month 1): 10
- New customers per month: 8 (growing 10% month-over-month from month 6)
- Monthly churn rate: 2%
- ARPU: $500 per month
Month 1: 10 customers x $500 = $5,000 MRR
Month 2: (10 – 0.2 churn + 8 new) = 17.8 customers x $500 = $8,900 MRR
Month 6: approximately 47 customers x $500 = $23,500 MRR
Month 12: approximately 95 customers x $500 = $47,500 MRR, or $570,000 ARR
This is a defensible, auditable projection. Every assumption is visible and testable.
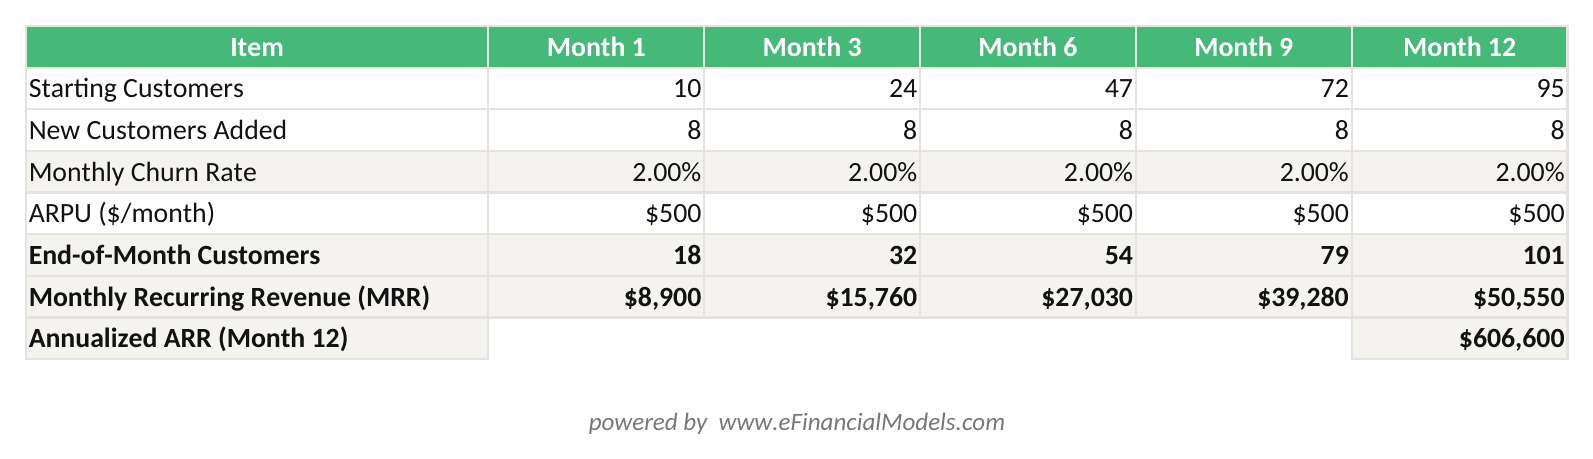
MRR = (Prior Month Customers – Churned + New Customers) x ARPU. This model shows $47,500 MRR by month 12 from 10 starting customers.
Creating Defensible Assumptions Without Historical Data
First-time founders worry most about this: how do you justify assumptions when you have no track record? The answer is to anchor every assumption to an external reference point or a logical first-principles argument.
Three sources work well for early-stage startups:
- Comparable company benchmarks: Industry databases and public company filings show typical CAC, churn, and gross margin ranges by sector. For SaaS, CAC payback is the benchmark investors reach for first, and Benchmarkit’s 2025 B2B SaaS Performance Metrics report found that the median payback period has lengthened by 12.5% since 2022 and varies sharply with average contract value, so benchmark yourself against companies selling at a similar price point.
- Cohort analysis from pilots: Even 30 to 90 days of pilot data gives you real churn and conversion numbers to anchor your model.
- First-principles logic: If you plan to hire 2 salespeople who each close 3 deals per month at a $10,000 ACV, that’s 6 deals per month. Show the logic chain.
The goal is not to be right. The goal is to be reasonable and transparent. Investors will stress-test your assumptions. If you can explain why you chose each number, you pass the test even if the number changes.
The Key Metrics Investors Extract from Your Forecast
Investors don’t read your forecast line by line. They extract specific metrics and compare them to benchmarks. Build your model so these metrics are visible on a summary dashboard.
| Metric | Definition | Typical Benchmark |
|---|---|---|
| Gross Margin | (Revenue – COGS) / Revenue | SaaS: 70-80%, E-comm: 30-50% |
| Monthly Burn | Net cash out per month | Seed: $30K-$150K |
| Runway | Cash / Monthly Burn | Target: 18+ months |
| CAC | Cost to acquire one customer | Varies by channel |
| CAC Payback | Months to recover CAC | SaaS target: <18 months |
| LTV:CAC Ratio | Lifetime value vs acquisition cost | Target: 3:1 or higher |
| MoM Growth | Month-over-month revenue growth | Early SaaS: 10-20% |
CAC payback period is calculated as: CAC divided by (ARPU multiplied by Gross Margin). If your CAC is $1,200, ARPU is $100/month, and gross margin is 75%, your payback period is 1,200 / (100 x 0.75) = 16 months.
You can track all of these metrics automatically using a startup KPI tracking template.
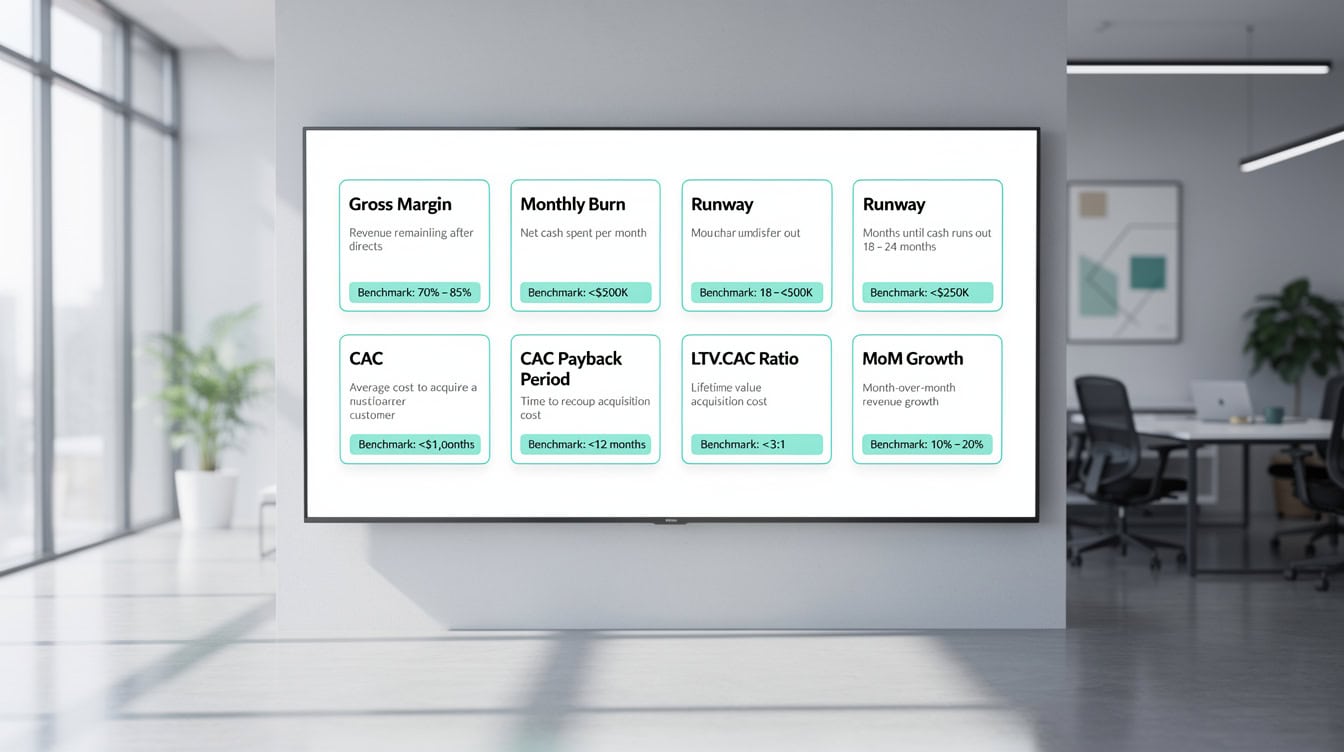
Investors extract these 7 metrics from your forecast in the first 5 minutes. Make them visible on a summary dashboard tab.
Scenario Planning: Base, Conservative, and Optimistic Cases
Scenario planning means building three versions of your forecast that reflect different assumptions about how the business performs. This is not optional for investor presentations.
Your base case reflects your most likely outcome given current information. It should be achievable but not sandbagged. Your conservative case assumes slower growth, higher churn, and longer sales cycles. It answers the question: can we survive if things go wrong? Your optimistic case shows what happens if key bets pay off faster than expected.
Present your base case in investor meetings. Have your conservative case ready when investors ask “what if growth is slower?” The conservative case should show that you still reach a meaningful milestone (product-market fit, break-even, or next funding milestone) even under stress.
Change only 3 to 5 key assumptions between scenarios: growth rate, churn, CAC, and average contract value are the highest-leverage variables. Don’t rebuild the entire model for each scenario. Use a single input tab where you toggle assumptions, and let formulas cascade through the model automatically.
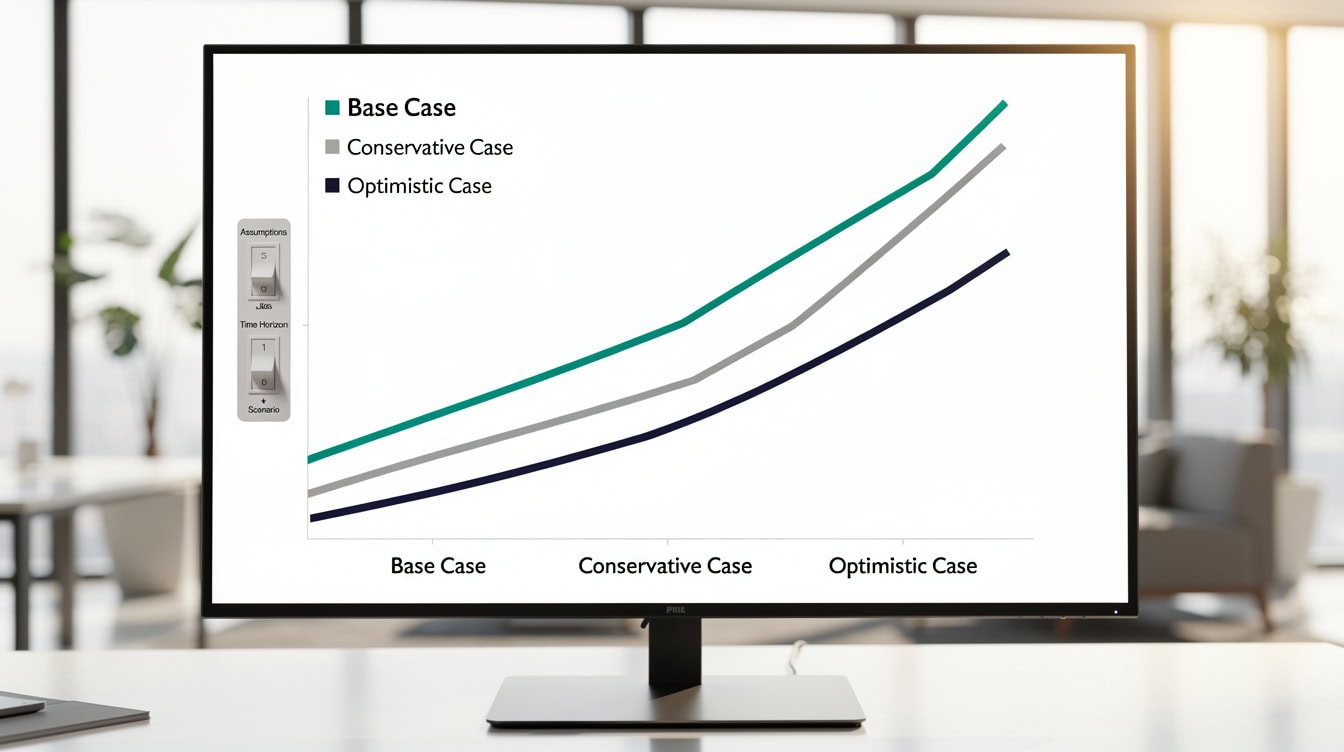
Build one model with a single input tab. Toggle 3 to 5 key assumptions to generate all three scenarios automatically.
Common Forecasting Mistakes That Kill Your Credibility
These are the 5 mistakes experienced investors flag most often in startup financial forecasts.
1. Hockey-stick revenue with no explanation. Revenue that is flat for 12 months then suddenly triples is a red flag unless you can point to a specific catalyst: a product launch, a partnership, or a sales team expansion. If you can’t explain the inflection point, remove it.
2. Underestimating headcount costs. Salary is only 70 to 80% of total employee cost. Add employer payroll taxes, health insurance, equipment, and recruiting fees. A $100,000 salary typically costs $125,000 to $135,000 all-in. For reference, IRS Topic No. 751 puts the employer Social Security rate at 6.2% on wages up to the annual wage base and the Medicare rate at 1.45% on all wages, meaning employers pay a combined 7.65% on top of every dollar of salary.
3. Ignoring seasonality. Most businesses have seasonal patterns. A B2B SaaS company often sees slower closes in August and December. An e-commerce brand sees spikes in Q4. Flat monthly growth assumptions signal that you haven’t studied your market.
4. Forgetting working capital. If you invoice customers on net-30 terms and pay suppliers on net-15, you fund a 15-day cash gap every month. At scale, this gap becomes a significant capital need that many founders discover too late.
5. Presenting a single scenario as certainty. Founders who present one forecast with no sensitivity analysis signal overconfidence. Investors know the future is uncertain. Show that you do too.
Tools, Templates, and Resources to Build Your First Forecast
You don’t need expensive software to build a credible startup financial forecast. The right tool depends on your stage and complexity.
| Tool Type | Best For | Cost | Limitation |
|---|---|---|---|
| Excel / Google Sheets | Pre-seed to seed | Free | Manual, error-prone |
| EFM Templates | Seed to Series A | Low | Requires setup |
| Specialized SaaS tools | Series A+ | $50-$500/mo | Overkill early |
For most pre-seed and seed founders, a well-structured spreadsheet template is the right starting point. The key is to use a template with pre-built formula logic so you focus on assumptions, not spreadsheet architecture. Microsoft’s published Excel specifications and limits allow up to 64 levels of nested functions, which is more than sufficient for even the most complex multi-scenario financial models a startup founder will build.
eFinancialModels provides startup financial model templates with pre-built P&L, cash flow, and balance sheet tabs, plus built-in scenario toggles. These templates follow the 3-statement model structure that investors expect, and they include a 5-year financial projections framework that covers the full horizon most investors require.
For founders who want to understand the underlying structure before using a template, the EFM general financial models library includes annotated examples across multiple business models.

For pre-seed and seed founders, a structured spreadsheet template delivers 90% of the value at a fraction of the cost of specialized software.
Frequently Asked Questions
How long should a startup financial forecast be?
A startup financial forecast should cover 3 to 5 years, with monthly detail for the first 12 to 18 months and quarterly detail for years 2 through 5. Most investors at seed and Series A expect at least a 3-year model. The monthly detail matters most because it shows your burn rate, runway, and cash timing clearly. A model that only shows annual totals hides the cash flow dynamics that investors care about most. For example, a company might show $1.2 million in year-1 revenue but run out of cash in month 9 if collections are slow. Monthly modeling catches that problem before it becomes a crisis.
What revenue growth rate is realistic for an early-stage SaaS startup?
Early-stage SaaS startups that have found initial product-market fit typically grow monthly recurring revenue (MRR) at 10 to 20% month-over-month in their first year of commercial traction. This compounds quickly: 15% monthly growth means roughly 5x annual growth. However, growth rates vary enormously by market, sales motion, and product type. The key is to anchor your growth assumption to your sales capacity: if you have 2 salespeople closing 3 deals each per month at $1,000 ACV, your maximum new MRR from that team is $6,000 per month. Don’t project growth that exceeds your team’s realistic capacity.
How do I forecast revenue when I have no customers yet?
With no customers, you build a bottoms-up model from first principles. Start with your sales process: how many leads can you generate per month, what is your estimated conversion rate from lead to customer, and what will customers pay? For example, if you can generate 100 leads per month through content and outreach, convert 5% to paying customers, and charge $200 per month, that’s 5 new customers and $1,000 in new MRR per month. Then add assumptions about churn (start with 3 to 5% monthly for a new product) and expansion revenue. Validate these assumptions against any pilot data, beta user behavior, or comparable company benchmarks you can find.
What is burn rate and how do I calculate it?
Burn rate is the net amount of cash your startup spends each month. Gross burn is total cash out (all expenses paid). Net burn is gross burn minus cash collected from customers. If you spend $80,000 per month and collect $30,000 from customers, your net burn is $50,000 per month. Runway equals your cash balance divided by net burn. With $600,000 in the bank and $50,000 net burn, you have 12 months of runway. Investors focus on net burn because it shows how efficiently you convert capital into growth. A startup with $100,000 gross burn but $80,000 in revenue has only $20,000 net burn, which is very capital-efficient.
Should I use Excel or specialized forecasting software?
For pre-seed and seed stage startups, Excel or Google Sheets with a structured template is the right choice. Specialized forecasting tools like Mosaic, Runway, or Jirav add value at Series A and beyond, when you have complex multi-entity structures, large finance teams, or need real-time actuals integration. The risk of specialized software early on is that it abstracts away the assumptions, making it harder to explain your model to investors. A well-built spreadsheet forces you to understand every formula. eFinancialModels startup templates are built in Excel and include unlocked formulas so you can see and modify every calculation. The cost difference is also significant: a quality EFM template costs a fraction of a monthly SaaS subscription.
How often should I update my financial forecast?
Update your forecast monthly, comparing actual results to your projections. This variance analysis, which measures the difference between what you projected and what actually happened, is one of the most valuable management tools available to a founder. If revenue is consistently 20% below forecast, your growth assumption is wrong and you need to adjust your runway calculation immediately. Most experienced CFOs recommend a rolling 13-month forecast that you update each month by adding a new month at the end and revising near-term assumptions based on actuals. This keeps your model current and prevents the common mistake of presenting a 12-month-old forecast to investors as if it reflects current reality.
What do investors look for in a startup financial forecast?
Investors look for 5 things: logical and transparent assumptions, a clear path to the next funding milestone, gross margin that supports a scalable business model, a burn rate and runway that give them confidence capital won’t run out before milestones are hit, and evidence that the founder understands their own unit economics. A forecast that shows $50 million in year-3 revenue with no explanation of how you get there is a red flag. A forecast that shows $8 million in year-3 revenue with a detailed bottoms-up model, a 75% gross margin, and 18 months of runway after the current raise is credible and fundable. Investors fund the logic, not the number.
Build Your Forecast, Then Iterate
Your first financial forecast won’t be perfect. It doesn’t need to be. What it needs to be is logical, transparent, and connected to your business strategy. Start with your revenue assumptions, build your cost structure around them, project your cash flow, and stress-test the model with three scenarios.
Every month, compare your actuals to your projections and update your assumptions. The founders who build the most credible forecasts aren’t the ones with finance degrees. They’re the ones who treat their model as a living document and update it relentlessly.
I recommend downloading the eFinancialModels free startup financial projections template to get started. It includes pre-built P&L, cash flow, and balance sheet tabs with formula logic already in place, so you can focus on your assumptions rather than spreadsheet architecture.

























































