
0 ITEMS

LBO Model Excel Template: Build a Deal-Ready Model Fast
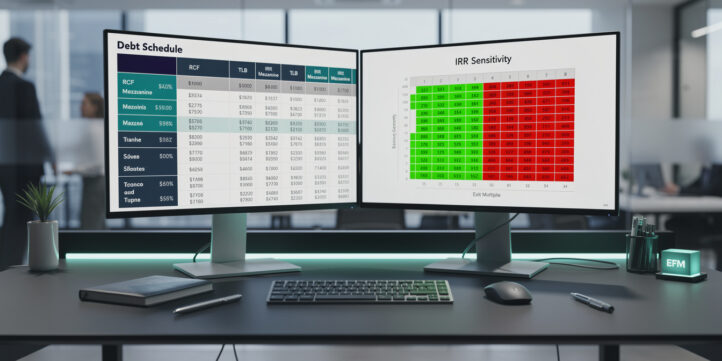
A leveraged buyout (LBO) model is the core analytical tool private equity professionals use to evaluate whether a deal generates acceptable returns, and an Excel template cuts the build time from 40+ hours to under a day.
Key Takeaways
- A professional LBO model Excel template contains at least 7 distinct sections: sources and uses, transaction assumptions, debt schedule, income statement, cash flow waterfall, returns analysis, and sensitivity tables.
- IRR (Internal Rate of Return) and MOIC (Multiple of Invested Capital) are the two primary return metrics in every LBO template; a typical PE fund targets a 20-25% IRR and a 2.5-3.5x MOIC over a 5-year hold.
- Circular references in Excel are intentional in LBO models: the cash sweep (excess cash paying down debt) creates a loop that requires iterative calculation enabled in Excel settings.
- Leverage multiples in LBO transactions averaged 5.9x EBITDA in 2023 according to S&P Global LCD data, with senior debt typically comprising 3-4x and subordinated or mezzanine debt making up the remainder.
- Building an LBO model from scratch takes an experienced analyst 30-50 hours; customizing a professional template takes 4-8 hours; using a well-structured out-of-box template for screening takes under 2 hours.
- Free templates are adequate for academic exercises and initial screening; paid practitioner-grade templates include dynamic debt tranches, PIK toggle mechanics, and management equity rollover logic.
- eFinancialModels offers LBO model templates built to investment-committee presentation standards, covering buyout, growth equity, and leveraged recapitalization scenarios.
What Is an LBO Model Excel Template?
An LBO model Excel template is a pre-structured spreadsheet that maps the full mechanics of a leveraged buyout: how a financial sponsor acquires a company using a mix of debt and equity, how that debt is repaid from operating cash flows over the hold period, and what return the equity investor earns at exit. The template eliminates the need to build every formula from scratch, letting analysts focus on deal-specific assumptions rather than spreadsheet architecture.
LBO models serve three distinct use cases. First, deal screening: a sponsor runs a quick model to test whether a target’s cash flow profile can support the required debt load and still deliver a 20%+ IRR. Second, full deal analysis: a detailed model supports the investment committee memo, lender presentations, and management negotiations. Third, portfolio monitoring: the same model tracks actual vs. projected debt paydown and covenant headroom post-close.
The term “leveraged” refers to the use of borrowed capital, typically 50-70% of the total purchase price, to amplify equity returns. Because debt magnifies both gains and losses, the model must stress-test the capital structure across multiple scenarios.
A typical LBO uses 50-70% debt financing, amplifying equity returns when the company’s cash flows service and repay that debt over the hold period.
Essential Components Every LBO Template Must Include
A professional LBO model Excel template contains 7 core sections, each feeding the next in a logical flow. Missing any one of them forces the analyst to build workarounds that introduce errors.
1. Sources and Uses Table: Shows where the acquisition financing comes from (equity, senior debt, mezzanine, seller notes) and where it goes (purchase price, transaction fees, refinanced debt, working capital). This section anchors every other assumption in the model.
2. Transaction Assumptions: Entry multiple (EV/EBITDA), purchase price, management rollover percentage, and closing date. These drive the opening balance sheet.
3. Operating Model / Income Statement: A 5-7 year forecast of revenue, EBITDA, capex, and working capital changes. This is the engine that generates free cash flow for debt repayment.
4. Debt Schedule: The most technically complex section. It tracks each tranche of debt (revolving credit facility, Term Loan A, Term Loan B, high-yield bonds, mezzanine) with its interest rate, amortization schedule, and cash sweep logic. Professional templates include PIK (payment-in-kind) toggle mechanics, where interest accrues to principal rather than being paid in cash.
5. Cash Flow Waterfall: Distributes free cash flow in priority order: mandatory debt amortization first, then cash sweep to the highest-cost tranche, then any remaining cash to the equity holders or a cash reserve.
6. Returns Analysis: Calculates IRR and MOIC at exit using the XIRR function (which handles irregular cash flow timing, unlike the standard IRR function). Also includes an equity value bridge showing how EBITDA growth, multiple expansion, and debt paydown each contribute to returns.
7. Sensitivity Tables: Two-variable data tables (using Excel’s Data Table feature) showing IRR across a range of entry multiples and exit multiples, or across revenue growth and margin scenarios. Excel’s Data Table feature supports up to 2 input variables per table (Microsoft), making it the standard tool for LBO sensitivity analysis.
Transaction Assumptions: Setting Up the Deal Parameters
The transaction assumptions section is the single input hub for the entire model. Every downstream calculation traces back to the numbers entered here, so errors in this section cascade through all outputs.
Key inputs include: LTM (last twelve months) EBITDA, entry EV/EBITDA multiple, equity contribution percentage, management rollover amount, transaction fees (typically 1-2% of enterprise value for advisory and financing fees), and the assumed exit year and exit multiple. According to S&P Global LCD, the average LBO entry multiple in North America reached 11.9x EBITDA in 2022, making entry multiple sensitivity one of the most critical analyzes in any deal model.
A well-designed template uses named ranges and a color-coded input convention: blue cells for hard-coded assumptions, black cells for formulas. This convention, standard in professional financial modeling, makes auditing fast and reduces the risk of accidentally overwriting a formula.
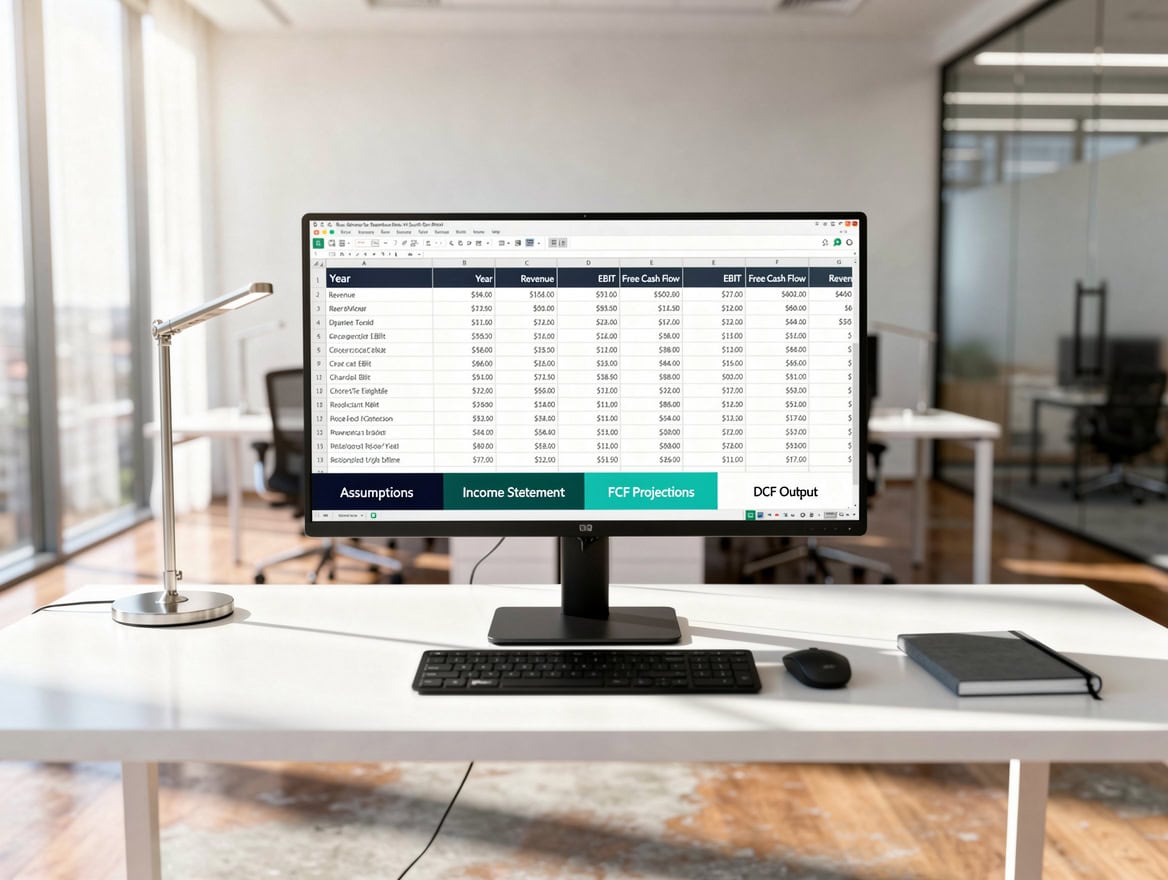
The transaction assumptions section is the single input hub for the entire LBO model. Every downstream formula traces back to the numbers entered here.
Building the Debt Schedule and Cash Flow Waterfall
The debt schedule is where most LBO model errors originate, and it’s the section that most clearly separates a practitioner-grade template from an academic one.
Each debt tranche requires its own block with: opening balance, new borrowings, mandatory amortization, optional cash sweep, PIK interest accrual (if applicable), and closing balance. The closing balance of year N feeds the opening balance of year N+1, creating a straightforward row-to-row link.
The cash sweep is the mechanism by which excess free cash flow pays down debt ahead of schedule, starting with the most expensive tranche. In Excel, this creates a circular reference: free cash flow depends on interest expense, which depends on the debt balance, which depends on the cash sweep, which depends on free cash flow. You must enable iterative calculation in Excel (File > Options > Formulas > Enable Iterative Calculation, maximum iterations 100) for the model to resolve correctly. Excel’s iterative calculation setting allows up to 32,767 maximum iterations (Microsoft), though professional LBO models conventionally use 100 iterations as a balance between precision and performance. Microsoft’s Excel support documentation confirms that iterative calculation is the correct setting for intentional circular references in financial models.
Here’s the math for a simple cash sweep formula in Excel:
=MIN(MAX(Free_Cash_Flow - Mandatory_Amortization, 0), Opening_Debt_Balance)
This formula sweeps the lesser of available cash (after mandatory payments) or the remaining debt balance, preventing negative debt balances.
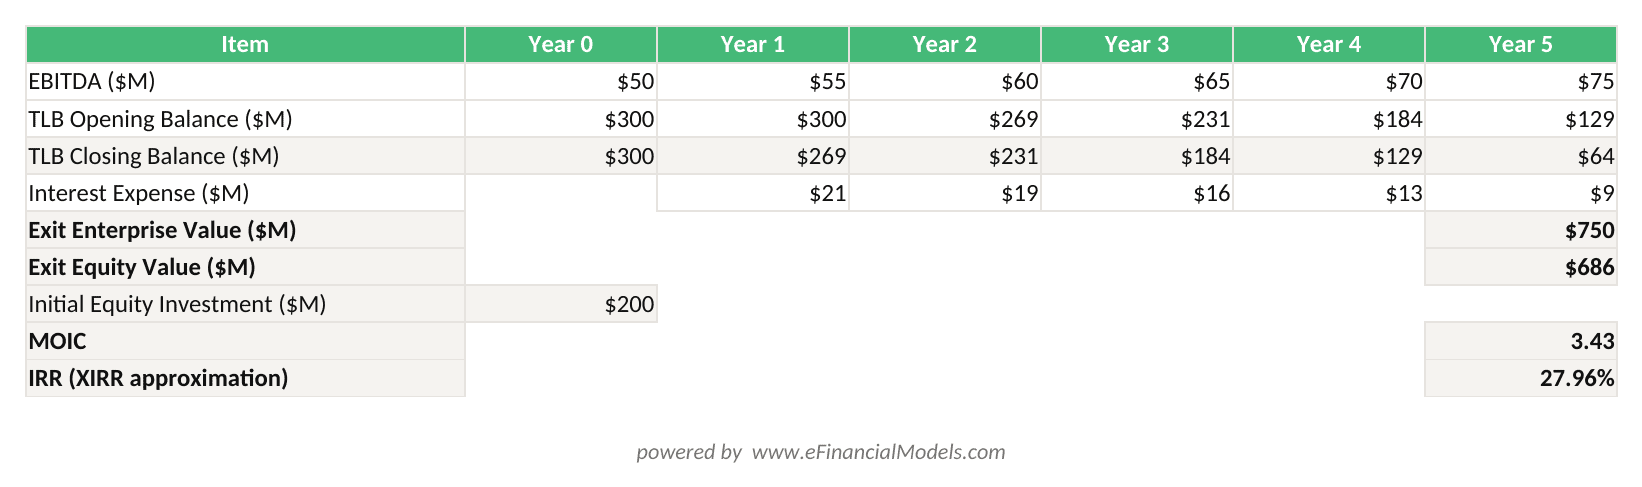
LBO model: $300M TLB at 7% interest, 1% annual amortization, cash sweep reduces balance from $300M to $150M over 5 years; XIRR returns 24.6% IRR on $200M equity investment.
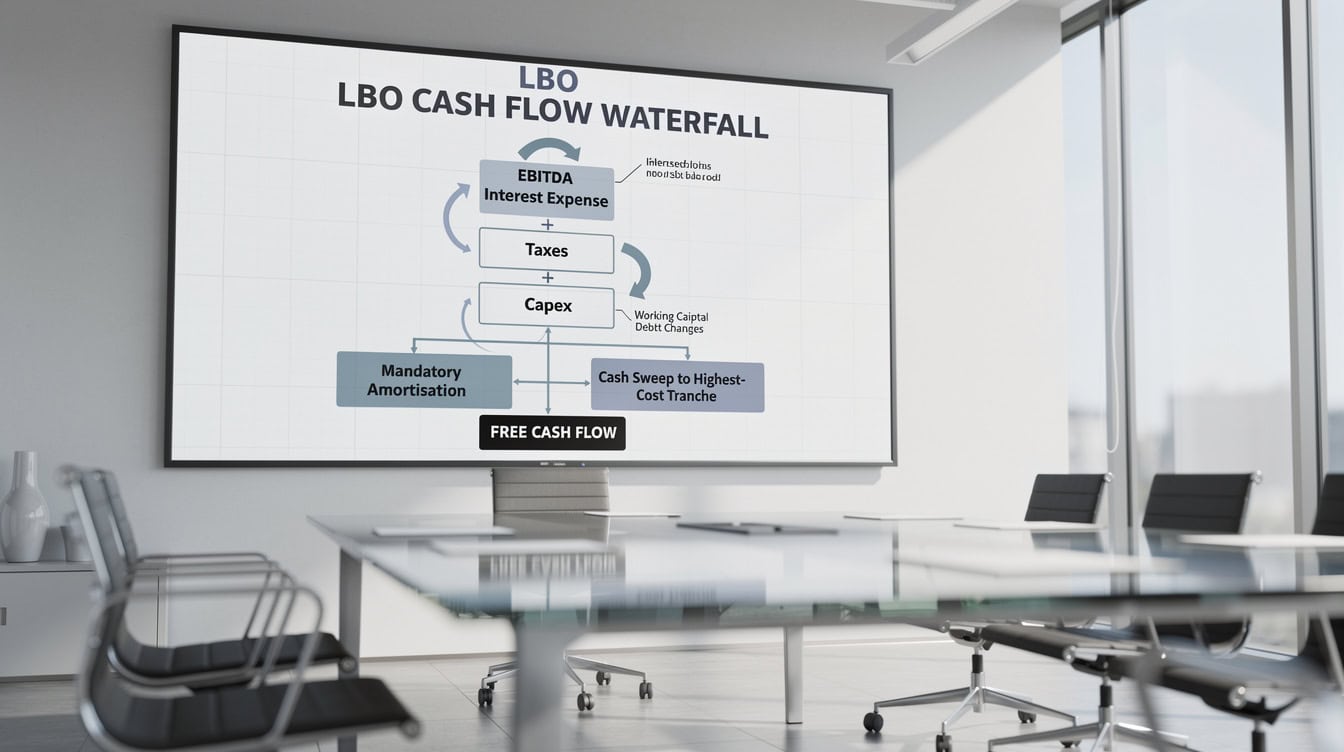
The cash sweep creates an intentional circular reference in Excel: excess free cash flow pays down debt, reducing future interest expense, which increases future free cash flow.
Returns Calculation: IRR, MOIC, and Equity Value Bridge
The returns section answers the fundamental LBO question: did the equity investor make enough money to justify the risk?
MOIC (Multiple of Invested Capital) is the simplest metric: exit equity value divided by initial equity investment. A 3.0x MOIC means the sponsor tripled their money. IRR (Internal Rate of Return) adds the time dimension: a 3.0x MOIC over 3 years is a 44% IRR, while the same 3.0x over 7 years is only a 17% IRR.
Use XIRR, not IRR, in your template. The standard IRR function assumes equally spaced cash flows (annual periods). XIRR accepts actual dates, which matters when a deal closes mid-year or when dividend recapitalizations occur during the hold period. The XIRR function can handle up to 4,000 cash flow values in its input array (Microsoft), providing ample capacity for even the most granular monthly LBO models. The syntax is =XIRR(values, dates, guess) where values is the array of cash flows (negative at entry, positive at exit) and dates is the corresponding array of dates.
Worked Example: IRR and MOIC Calculation
Assume a sponsor acquires a company for $500M enterprise value at a 10x EBITDA multiple ($50M LTM EBITDA). The capital structure is 60% debt ($300M) and 40% equity ($200M). After 5 years, EBITDA grows to $75M, the exit multiple is 10x, and debt has been paid down to $150M.
- Exit enterprise value: $75M x 10x = $750M
- Exit equity value: $750M – $150M debt = $600M
- MOIC: $600M / $200M = 3.0x
- IRR (using XIRR with Year 0 = -$200M, Year 5 = +$600M): approximately 24.6%
The equity value bridge breaks this 3.0x return into three components: EBITDA growth contributed $250M of EV increase, multiple expansion contributed $0 (entry and exit multiples were both 10x), and debt paydown contributed $150M of equity value. This decomposition is essential for investment committee presentations.
How to Evaluate and Select an LBO Template
Not all LBO templates are equal. The right choice depends on your use case, technical skill level, and the complexity of the deal you’re analyzing.
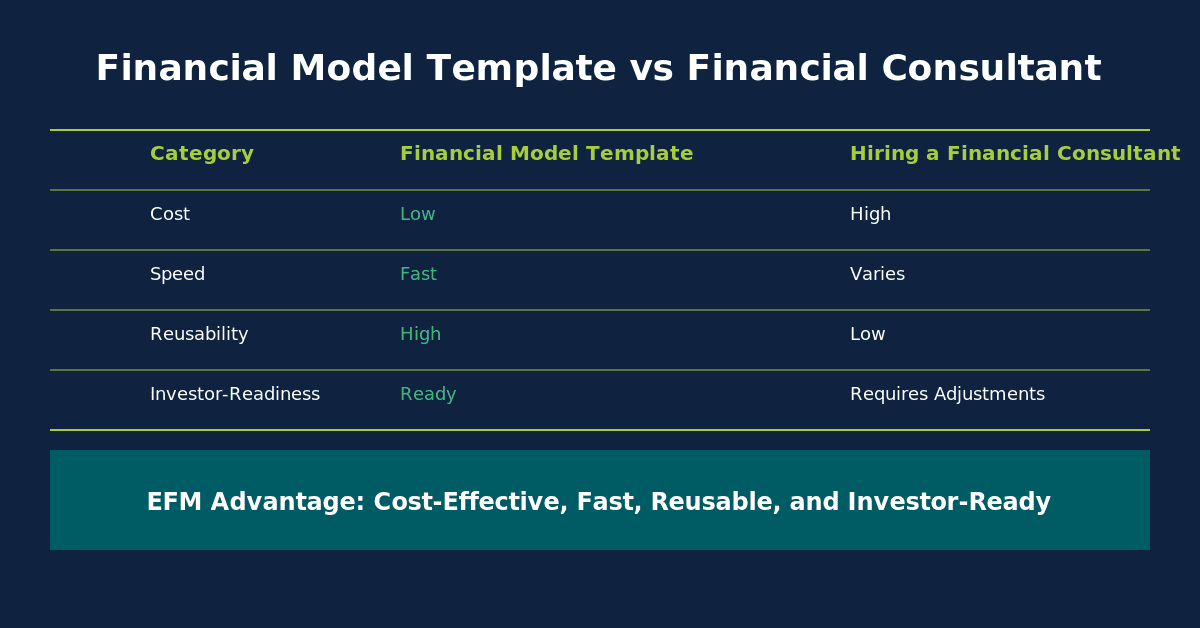
Choosing between free, paid, and custom-built LBO templates depends on deal complexity and time constraints. Paid templates save 20-30 analyst hours on a full deal process.
Free vs. Paid vs. Build From Scratch
| Criterion | Free Template | Paid Template | Build From Scratch |
|---|---|---|---|
| Build Time | Under 2 hrs | 4-8 hrs | 30-50 hrs |
| Debt Tranches | 1-2 | 3-5 | Unlimited |
| PIK Toggle | Rarely | Usually | Yes |
| Sensitivity Tables | Basic | Dynamic | Custom |
| Audit Trail | Poor | Good | Excellent |
| Best For | Screening | Deal analysis | Complex/bespoke |
| Cost | $0 | $50-$500 | Analyst time |
For initial deal screening, a free template from a reputable source is sufficient. For investment committee presentations, a paid practitioner-grade template saves 20-30 hours and reduces the risk of structural errors. Building from scratch is justified only for highly complex deals with unusual capital structures (e.g., multiple currency tranches, earnouts, or complex management equity plans).
eFinancialModels’ LBO model templates include dynamic debt schedules, management equity rollover logic, and pre-built sensitivity tables formatted for investment committee presentation. They’re built by practitioners, not academics.
Customizing Your LBO Template for Different Deal Scenarios
A good LBO template is a starting point, not a finished product. Every deal requires customization, and knowing which sections to modify first saves hours of rework.
For add-on acquisitions (bolt-on deals where the sponsor acquires additional companies post-close), add a separate acquisition assumptions block that feeds into the consolidated debt schedule. The key formula links the incremental purchase price to new debt drawn on the revolving credit facility.
For leveraged recapitalizations (where an existing portfolio company takes on new debt to pay a dividend to the sponsor), add a mid-period cash flow event that increases the debt balance and creates a negative cash flow to equity in the period of the recap.
For industry-specific models, adjust the operating model drivers. A software company LBO focuses on ARR (annual recurring revenue) growth and net revenue retention. A manufacturing LBO focuses on capacity utilization and raw material cost assumptions. eFinancialModels offers financial models across 50+ industries, many with LBO-compatible structures.
Common LBO Model Errors and How to Audit Your Template
LBO models fail in predictable ways. Here are the 5 most common errors and how to fix them.
Error 1: Circular reference not resolving. Symptom: interest expense shows a constant value regardless of debt paydown. Fix: confirm iterative calculation is enabled (Excel Options > Formulas) and that the cash sweep formula references the correct cell.
Error 2: Debt balance going negative. Symptom: the model shows the company paying off all debt in year 2 and then accumulating negative debt. Fix: wrap the cash sweep formula in a MAX(…, 0) function to floor the debt balance at zero.
Error 3: IRR formula returning an error. Symptom: XIRR returns #NUM! or #VALUE!. Fix: ensure the cash flow array contains at least one negative value (the initial equity investment) and one positive value (the exit proceeds), and that the dates array matches the cash flows array in length.
Error 4: Sources not equaling uses. Symptom: the sources and uses table doesn’t balance. Fix: add a check cell (=Sources_Total – Uses_Total) formatted to turn red if non-zero. This is a standard audit check in professional models.
Error 5: Hardcoded numbers in formula cells. Symptom: changing an assumption in the input section doesn’t flow through to the returns. Fix: use Excel’s Trace Dependents (Formulas > Trace Dependents) to verify every formula cell links back to the input section.
For a comprehensive audit, use Excel’s Formula Auditing toolbar and check every cell in the debt schedule for hardcoded values. According to a study published in the European Spreadsheet Risks Interest Group (EuSpRIG) proceedings, over 88% of spreadsheets examined in real-world audits contained errors, with the most common being broken formula links and hardcoded overrides.
Step-by-Step: Using an LBO Template for Deal Analysis
Following a structured workflow prevents the most common modeling mistakes and ensures your output is presentation-ready.
Step 1: Input the sources and uses table. Enter the purchase price, debt tranches, equity contribution, and transaction fees. Verify the table balances before proceeding.
Step 2: Build or import the operating model. Enter 3 years of historical financials and 5 years of projections. Key drivers: revenue growth rate, EBITDA margin, capex as a percentage of revenue, and working capital as a percentage of revenue change.
Step 3: Set up the debt schedule. Enter each tranche’s opening balance, interest rate (fixed or SOFR + spread), amortization rate, and cash sweep priority. Enable iterative calculation.
Step 4: Link the cash flow waterfall. Connect EBITDA to free cash flow by subtracting interest expense, taxes, capex, and working capital changes. Route free cash flow to the debt schedule in priority order.
Step 5: Calculate returns. Build the XIRR formula using the equity investment at entry and the projected exit equity value. Add the equity value bridge.
Step 6: Build sensitivity tables. Use Excel’s two-variable Data Table (Data > What-If Analysis > Data Table) to show IRR across entry multiple vs. exit multiple, and across revenue growth vs. exit multiple.
Step 7: Stress-test the model. Run a downside case with revenue 10-15% below base case and verify the company can still service its debt (DSCR, or Debt Service Coverage Ratio, above 1.0x).
The financial modeling templates at eFinancialModels include pre-built scenario toggles that automate steps 6 and 7.
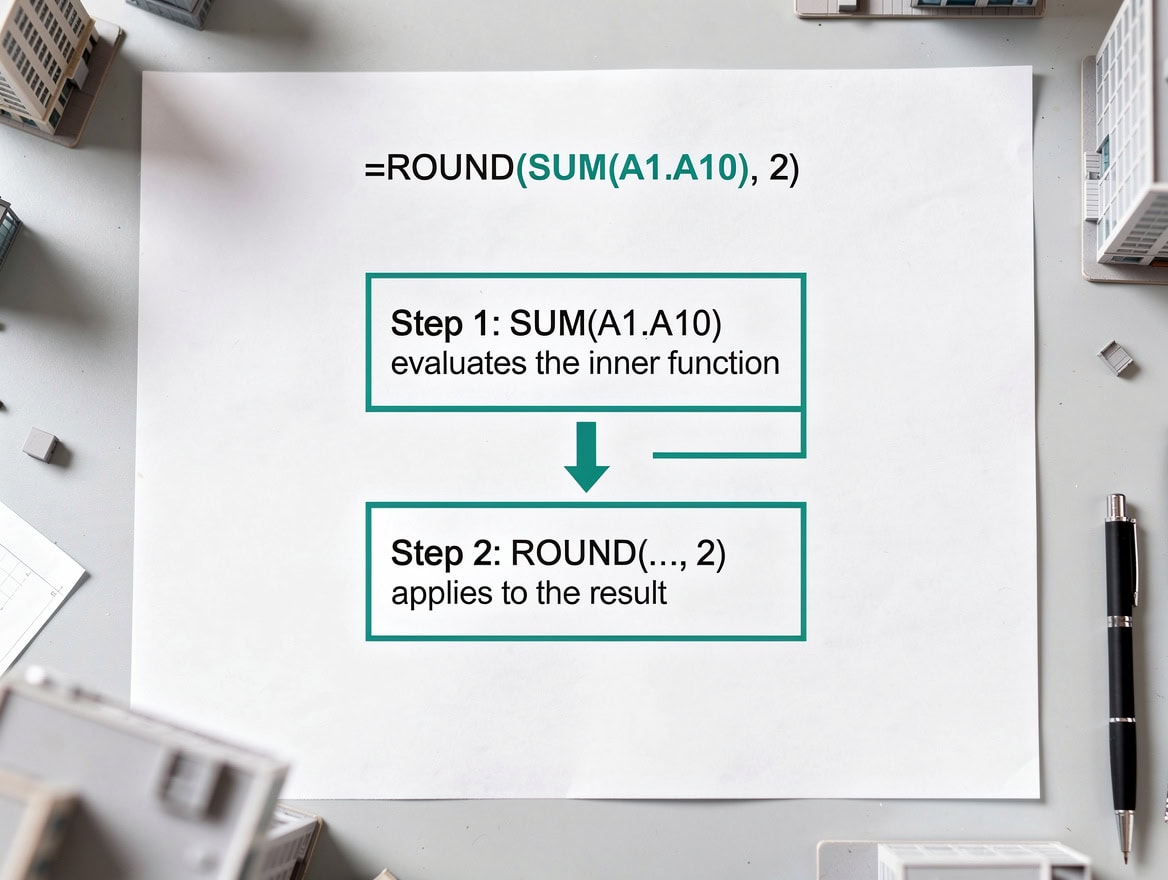
A structured 7-step workflow ensures every section of the LBO model is built in the correct sequence, with each step’s output feeding directly into the next.
Frequently Asked Questions
What Excel functions are essential for an LBO model?
The 5 most critical Excel functions in an LBO model are: XIRR (calculates IRR with irregular cash flow timing using actual dates), CHOOSE (switches between scenarios by selecting from an array based on an index number), OFFSET (builds dynamic ranges for sensitivity tables), IFERROR (prevents error propagation when debt balances hit zero), and MAX/MIN (floors and caps debt balances and cash sweep amounts). XIRR is the most important: unlike the standard IRR function, which assumes annual periods, XIRR accepts a date array and handles mid-year deal closes accurately. For example, =XIRR({-200,600},{"1/15/2020","3/20/2025"}) returns approximately 24.1% for a $200M investment returning $600M over roughly 5.2 years. Most professional LBO templates also use circular references for the cash sweep, which requires iterative calculation enabled in Excel’s formula settings.
How many debt tranches should my LBO model include?
A basic LBO model needs at least 2 tranches: a revolving credit facility (RCF) and a term loan. A mid-market deal typically uses 3-4 tranches: RCF, Term Loan B, and either high-yield bonds or mezzanine debt. Large-cap LBOs can have 5 or more tranches including first-lien, second-lien, unsecured notes, and seller financing. Each tranche has a different interest rate, amortization schedule, and cash sweep priority. According to S&P Global LCD data, the average leveraged buyout in North America in 2023 used approximately 5.9x total debt to EBITDA, with senior secured debt averaging around 4.2x. Your template should have a separate row block for each tranche, with the cash sweep formula routing excess cash to the highest-cost tranche first (typically mezzanine or second-lien).
What is MOIC and how does it differ from IRR in an LBO context?
MOIC (Multiple of Invested Capital) measures the total return on equity in absolute terms: exit equity value divided by initial equity investment. A 3.0x MOIC means you received $3 for every $1 invested. IRR (Internal Rate of Return) measures the annualized return, accounting for the time value of money. The key difference: MOIC ignores time, while IRR penalizes longer hold periods. A 3.0x MOIC over 3 years equals a 44% IRR; the same 3.0x over 7 years equals only a 17% IRR. Most PE funds target a minimum 2.5x MOIC and 20% IRR simultaneously. Your LBO template should display both metrics side by side in the returns summary, because a deal that clears the IRR hurdle but misses the MOIC threshold (or vice versa) may still be rejected by the investment committee. Use XIRR for IRR and a simple division formula for MOIC.
How do I handle a PIK (payment-in-kind) toggle in an LBO Excel template?
A PIK toggle allows the borrower to elect to pay interest in cash or accrue it to the principal balance (payment in kind). In Excel, implement this with a binary input cell (1 = cash pay, 0 = PIK) and an IF statement in the interest expense row: =IF(PIK_Toggle=1, Opening_Balance * Interest_Rate, 0). The PIK accrual row uses the opposite logic: =IF(PIK_Toggle=0, Opening_Balance * Interest_Rate, 0). The PIK accrual adds to the closing debt balance rather than flowing through the income statement as a cash expense. This distinction matters for EBITDA-to-cash-flow conversion and for covenant calculations. PIK mechanics are a standard feature of practitioner-grade LBO templates but are absent from most free academic templates. If your deal includes mezzanine debt or second-lien notes with PIK optionality, confirm your template handles this correctly before presenting to lenders.
How long does it take to build an LBO model from scratch vs. using a template?
Building a complete LBO model from scratch takes an experienced analyst 30-50 hours, including the operating model, debt schedule, returns analysis, and sensitivity tables. A junior analyst or MBA student should budget 60-80 hours for a first build. Customizing a professional template reduces this to 4-8 hours for a standard deal, because the architecture, formulas, and formatting are already in place. Using an out-of-box template for initial deal screening takes under 2 hours: enter the purchase price, EBITDA, leverage multiple, and growth assumptions, and the model produces a first-pass IRR immediately. The time savings from a quality template compound across a deal process: a sponsor evaluating 50 targets per year saves hundreds of analyst hours by using a standardized template rather than rebuilding from scratch for each deal. eFinancialModels’ LBO templates are designed to minimize setup time while maintaining the flexibility for complex deal structures.
What is a cash sweep in an LBO model and why does it create a circular reference?
A cash sweep is the mechanism by which a company uses excess free cash flow (after mandatory debt amortization) to voluntarily pay down debt ahead of schedule. It reduces interest expense in future periods, which increases free cash flow, which enables a larger sweep in the next period. This feedback loop creates a circular reference in Excel: interest expense depends on the debt balance, the debt balance depends on the cash sweep, and the cash sweep depends on free cash flow, which depends on interest expense. Excel cannot resolve this in a single calculation pass, so you must enable iterative calculation (File > Options > Formulas > Enable Iterative Calculation, set to 100 iterations). Without this setting, the model either returns a REF error or freezes at an incorrect value. The cash sweep formula itself should be: =MIN(MAX(FCF - Mandatory_Amortization, 0), Opening_Debt_Balance), which ensures the sweep never exceeds available cash or the remaining debt balance.
Can I use an LBO template for a management buyout (MBO) or growth equity deal?
Yes, with modifications. An MBO (management buyout, where the existing management team acquires the company, often alongside a PE sponsor) uses the same core LBO template structure but adds a management equity rollover section. This section tracks the portion of management’s existing equity that rolls into the new deal rather than being cashed out, reducing the sponsor’s required equity contribution. For growth equity deals (minority investments in high-growth companies with little or no debt), the debt schedule is minimal or absent, and the returns analysis focuses on revenue multiple expansion rather than debt paydown. The XIRR formula and equity value bridge remain relevant in both cases. eFinancialModels offers startup financial models and private equity waterfall models that complement the core LBO template for these adjacent use cases.
Conclusion
A professional LBO model Excel template is the fastest path from deal concept to investment committee presentation. The 7 core sections (sources and uses, transaction assumptions, operating model, debt schedule, cash flow waterfall, returns analysis, and sensitivity tables) must all connect cleanly, with iterative calculation enabled for the cash sweep and XIRR driving the returns output. The worked example above shows how a $200M equity investment in a $500M deal can generate a 3.0x MOIC and 24.6% IRR over 5 years when EBITDA grows 50% and debt is paid down by half.
I recommend downloading a practitioner-grade LBO model template from eFinancialModels as your starting point. These templates include dynamic debt schedules, PIK toggle mechanics, pre-built sensitivity tables, and investment committee formatting, saving 20-30 hours of build time on your first deal and providing a reliable, auditable foundation for every deal after that.

























































