
0 ITEMS

Hotel Development & Acquisition Model Pro (USALI P&L)
The Hotel Development & Acquisition Model Pro is an institutional-grade Excel template purpose-built for modeling the full lifecycle of a hotel investment — from greenfield construction and development through stabilized operations, refinancing, and exit. Whether you are underwriting a new-build hotel, acquiring an operating property, or stress-testing hold-period economics for a GP/LP joint venture, this model delivers the analytical rigor that lenders, equity investors, and asset managers require.
Overview
The Hotel Development & Acquisition Model Pro is an institutional-grade Excel template purpose-built for modeling the full lifecycle of a hotel investment — from greenfield construction and development through stabilized operations, refinancing, and exit. Whether you are underwriting a new-build hotel, acquiring an operating property, or stress-testing hold-period economics for a GP/LP joint venture, this model delivers the analytical rigor that lenders, equity investors, and asset managers require.
The model covers 10-year projections across 15 fully linked worksheets, with zero macros and zero circular references. It delivers three complete financial statements, a USALI-structured departmental P&L, a detailed construction budget, a fully parameterizable debt structure (including cash-out refinancing), a GP/LP equity waterfall, a DCF valuation with dual exit methodology, and an executive dashboard — all driven from a single Assumptions tab. An optional mixed-use module (ground-floor retail, parking, and branded residences) can be switched on for mixed-use deals or left off for a clean pure-play hotel underwrite, and a visible MODEL CHECKS panel surfaces the balance check and key integrity flags at a glance.
Why This Model
Most hotel financial models available online treat hotel revenue as a single line item and skip the operational depth that lenders and institutional investors actually need. This model was built from scratch with hospitality fundamentals at its core:
- Full USALI departmental structure — Rooms, Food & Beverage, and Other Operated Departments modeled separately, flowing through GOP (Gross Operating Profit) to NOI, exactly as hotel operators and lenders underwrite
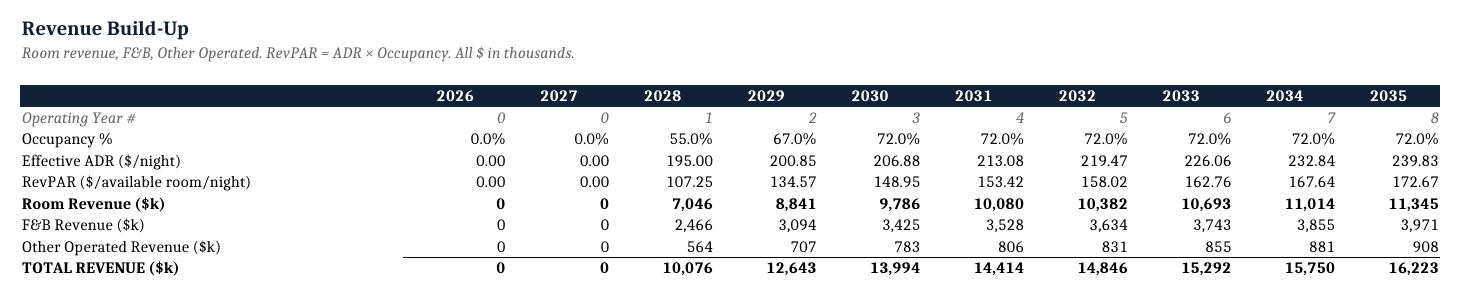
- ADR, occupancy, and RevPAR — the three KPIs every hotel investor tracks, modeled with an explicit ramp from opening through stabilization
- Management fee and franchise fee — modeled as percentages of total revenue, with operator and brand economics captured correctly
- FF&E Reserve — furniture, fixtures & equipment reserve modeled as a percentage of revenue, reflecting the ongoing capital requirement specific to hotels
- Optional mixed-use module (toggle, off by default) — add ground-floor retail, parking, and branded residences when the deal calls for it, or leave it off for a clean pure-play hotel. One workbook covers both, without forcing pure-hotel buyers through mixed-use complexity they do not need
- Visible MODEL CHECKS panel — the balance check and key integrity flags are surfaced in one place rather than buried, so you (and your lender or LP) can confirm the model ties out at a glance
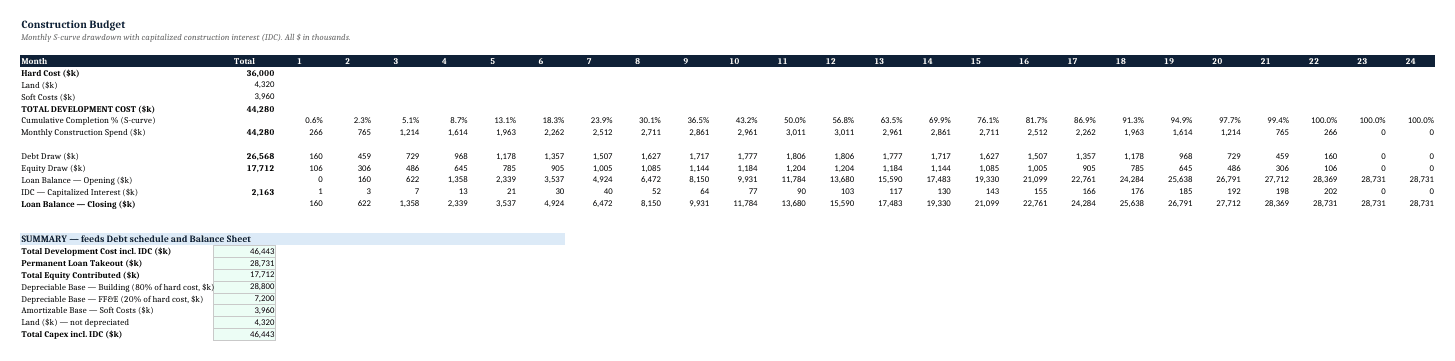
- Construction S-curve with capitalized IDC — monthly draw schedule flows automatically to the Balance Sheet
- Construction-to-permanent loan with IO period and cash-out refi — the financing structure that actually gets used in hotel development, with an optional Year 5 cash-out refinancing event
- Full 3-statement integration (P&L, Cash Flow, Balance Sheet) with automatic balance check — not just a cash flow model
What’s Inside (Tab by Tab)
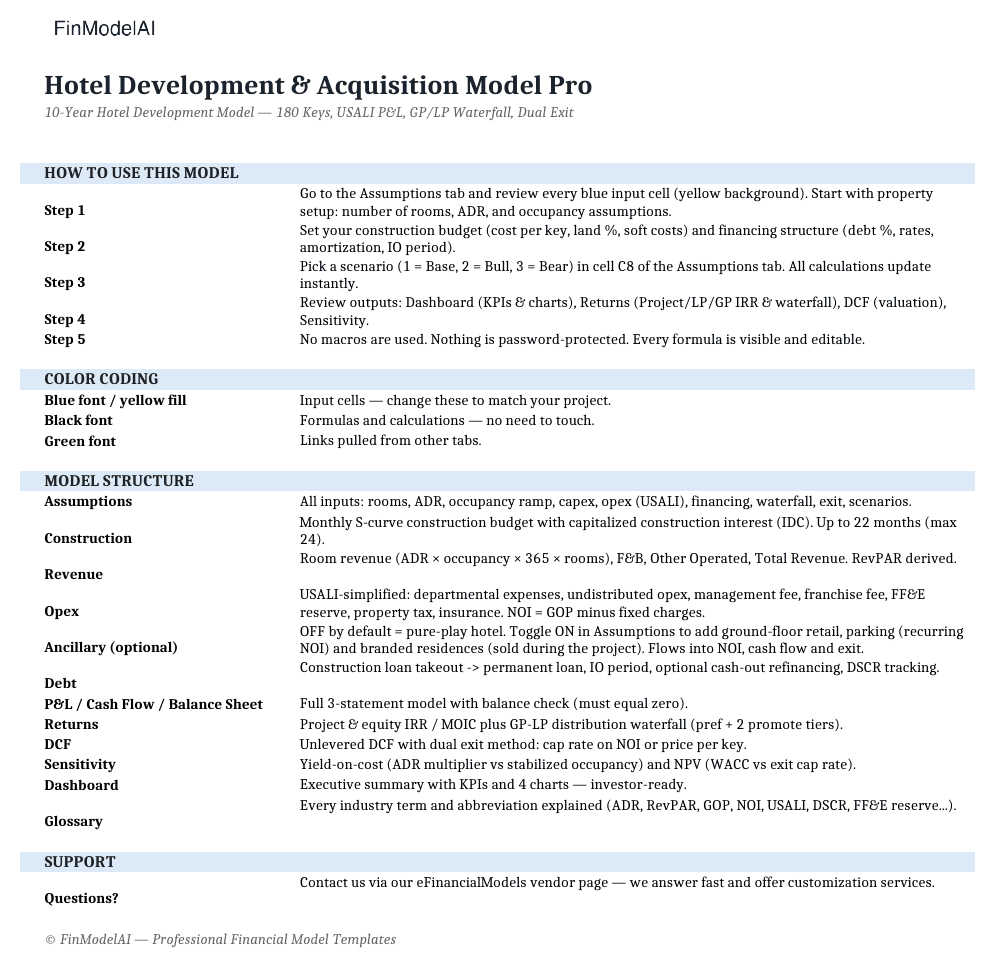
1) START HERE — Workflow guide, color code legend (blue = inputs, black = formulas, green = cross-sheet links), model structure overview, and key assumptions summary. Start here before touching anything else.
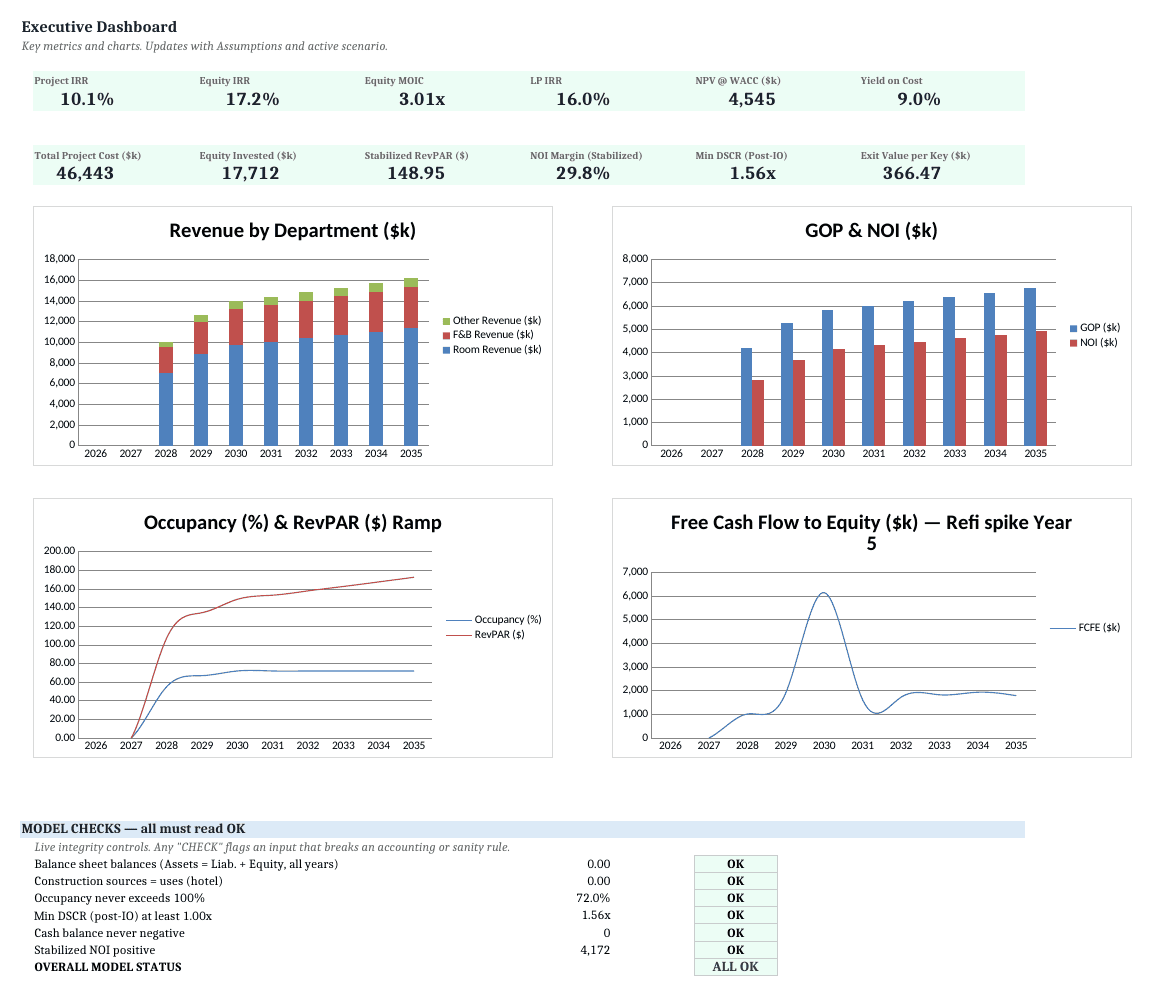
2) Dashboard — Executive summary with 4 auto-updating charts: revenue ramp by department, EBITDA/NOI margin evolution, DSCR over time, and project cash flow waterfall. Key metrics displayed at a glance: Project IRR, Equity IRR, MOIC, LP IRR, NPV, Yield on Cost, stabilized RevPAR, and minimum DSCR. A visible MODEL CHECKS panel reports the balance-sheet tie-out and key integrity flags so you can confirm the model is sound before presenting it.
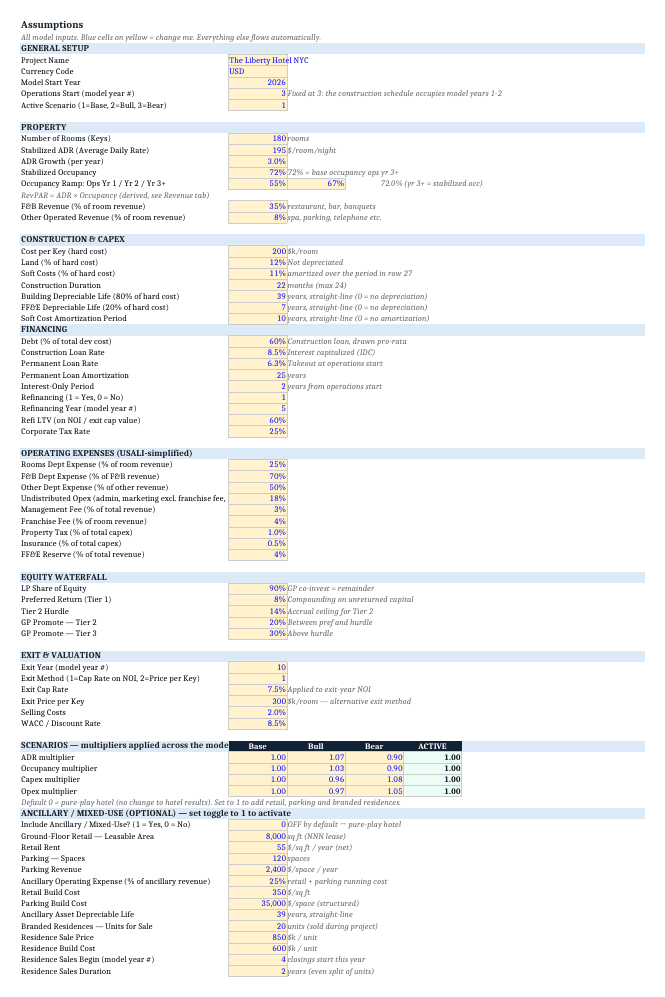
3) Assumptions — Centralized input hub for all model drivers: hotel size (keys, rooms, configuration), ADR ramp schedule, occupancy ramp by year through stabilization, departmental revenue mix (Rooms, F&B, Other), management fee %, franchise fee %, FF&E reserve %, operating expense assumptions, construction cost (hard costs, soft costs, FF&E), the mixed-use toggle and its inputs (retail GLA and rent, parking spaces and rate, branded-residence units and sell-out), financing terms (construction loan, permanent debt, IO period, cash-out refi), equity structure (GP/LP split, preferred return, promote hurdles), WACC, exit cap rate, and price-per-key exit assumption. All blue cells, all in one place.
4) Construction — Monthly construction budget with S-curve cost distribution across hard costs, soft costs, FF&E, and financing costs. IDC (Interest During Construction) is capitalized and flows automatically to the Balance Sheet cost basis.
5) Revenue — USALI-structured departmental revenue build: (1) Rooms Revenue driven by ADR × occupancy × available rooms, (2) Food & Beverage revenue as a function of occupancy and covers, (3) Other Operated Departments (spa, parking, ancillary). RevPAR (Revenue Per Available Room) calculated automatically at each point in the ramp. Occupancy and ADR ramp from opening through full stabilization. When the mixed-use module is enabled, ground-floor retail rent, parking income, and branded-residence sell-out are added as separate revenue lines that flow through to the financial statements, returns, and exit; when it is off, the model is a clean pure-play hotel.
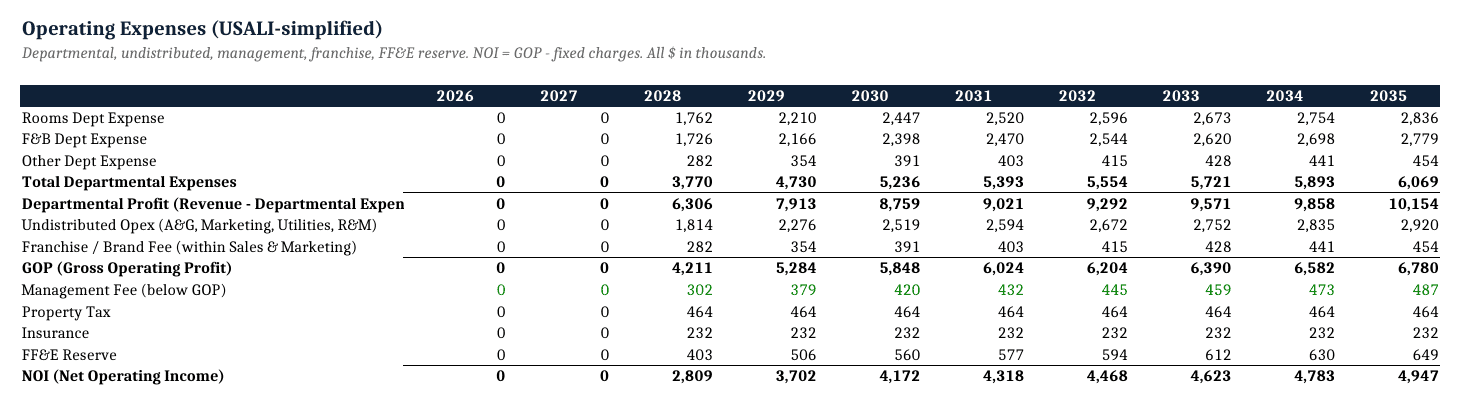
6) Opex — Departmental operating expenses following USALI structure: rooms department expenses (labor, amenities, laundry), F&B department expenses, undistributed expenses (admin & general, sales & marketing, property operations, utilities), management fee, franchise fee, FF&E reserve, insurance, and property taxes. Flow from departmental revenue to GOP to NOI.
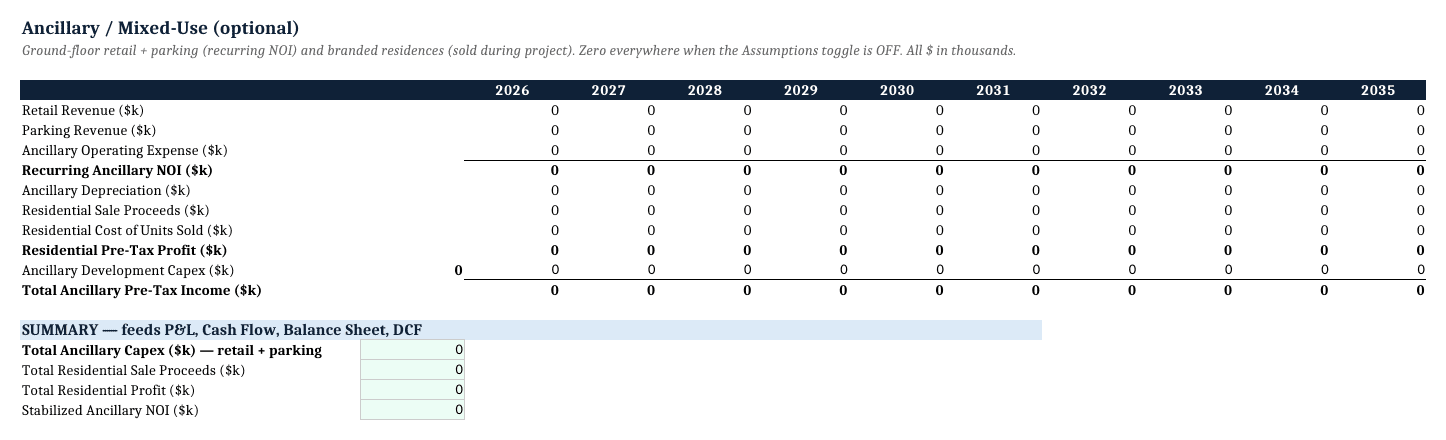
7) Ancillary — The optional mixed-use module in its own tab: ground-floor retail rent, parking income, and branded-residence sell-out (proceeds, cost of units sold, and pre-tax profit by year), with the associated development capex and depreciation. Produces the stabilized ancillary NOI and summary lines that feed the P&L, Cash Flow, Balance Sheet, and DCF. Leave the toggle off for a clean pure-play hotel underwrite.
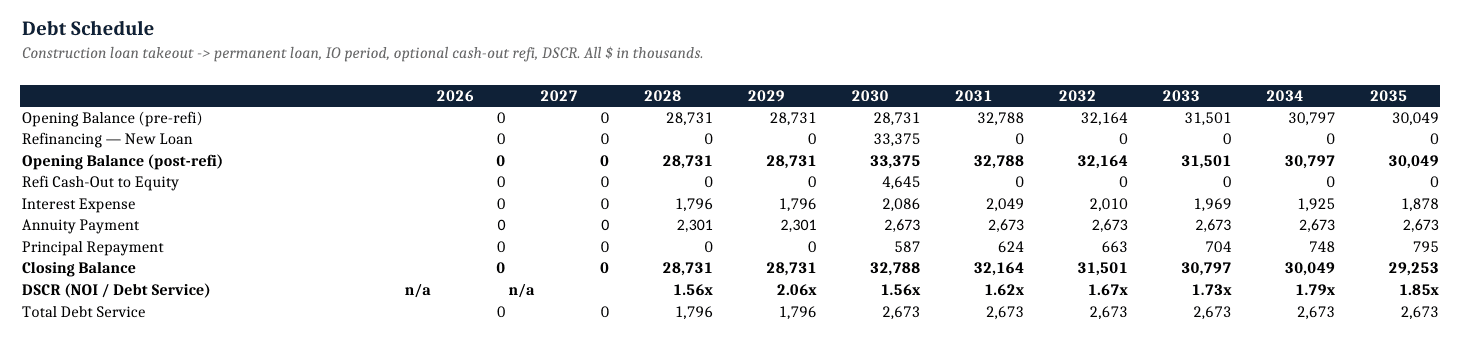
8) Debt — Construction loan draws and repayment, permanent debt takeout at stabilization, interest-only period (parameterizable length), optional cash-out refinancing event (Year 5 by default), and annual DSCR (Debt Service Coverage Ratio) tracking with covenant visualization. Minimum DSCR highlighted for lender presentation.
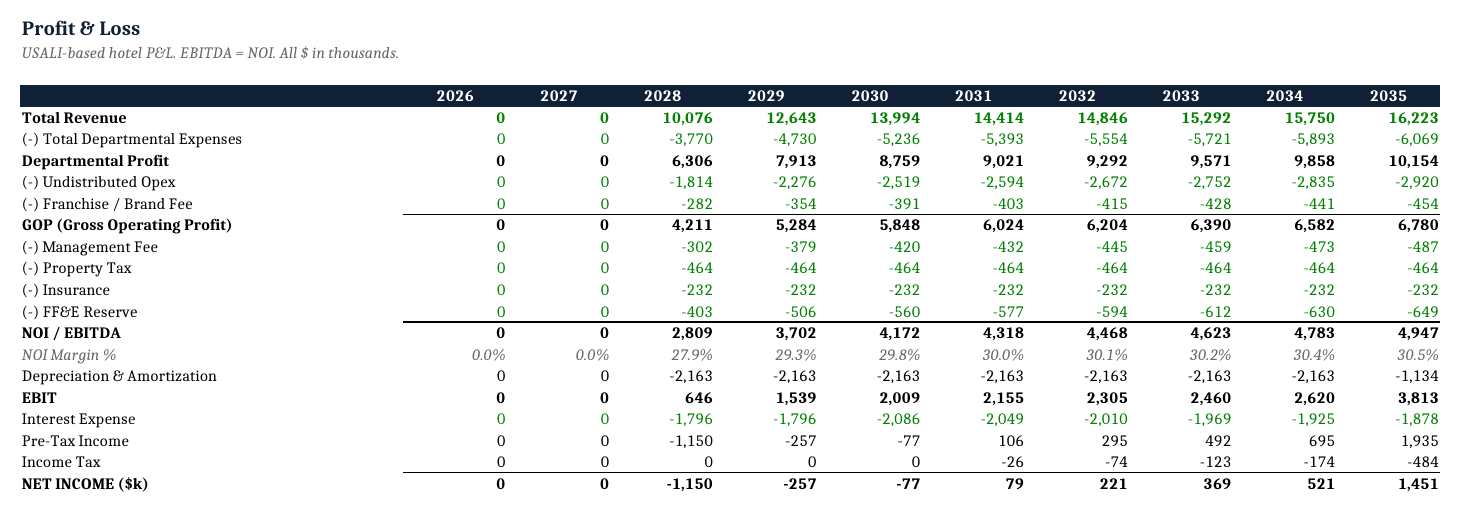
9) P&L — Full Income Statement from departmental revenues through GOP, NOI, depreciation, EBIT, interest expense, and net income. Automatically linked from Revenue and Opex tabs.
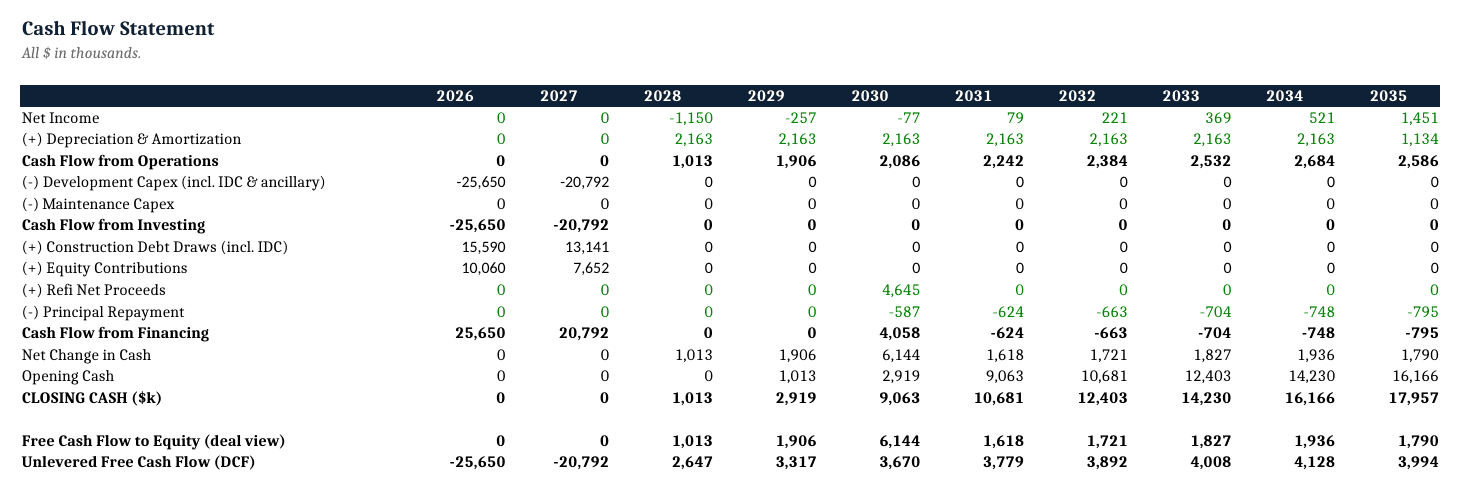
10) Cash Flow — Operating cash flow, investing cash flow (construction capex, FF&E capex, maintenance capex), financing cash flow (debt draws/repayments, equity contributions/distributions, cash-out refi proceeds), and free cash flow to equity. Feeds the Balance Sheet automatically.
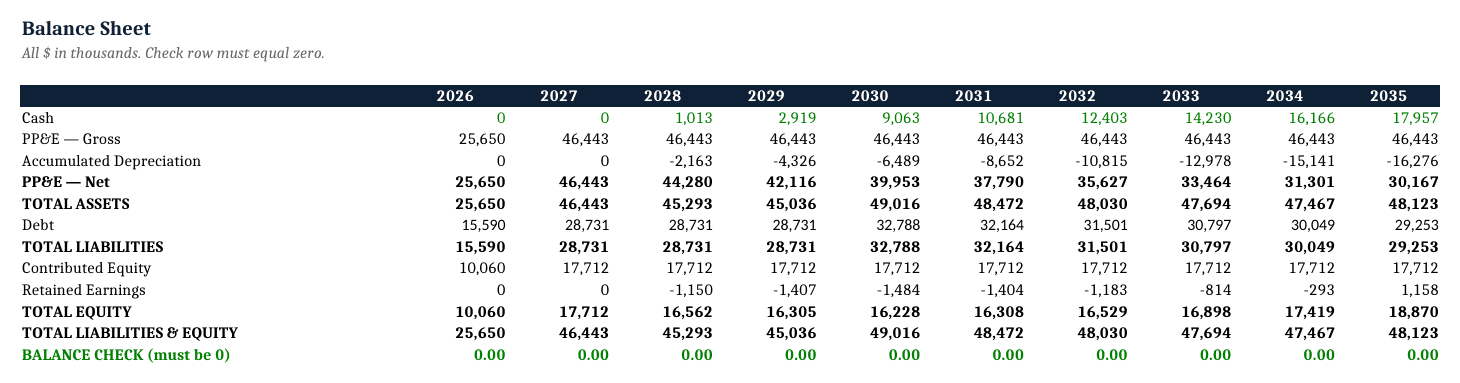
11) Balance Sheet — Fully integrated balance sheet with assets (capitalized construction costs, PP&E net of depreciation), liabilities (debt schedule, accruals), and equity (contributed capital, retained earnings). Automatic balance check displayed on every period — must equal zero.
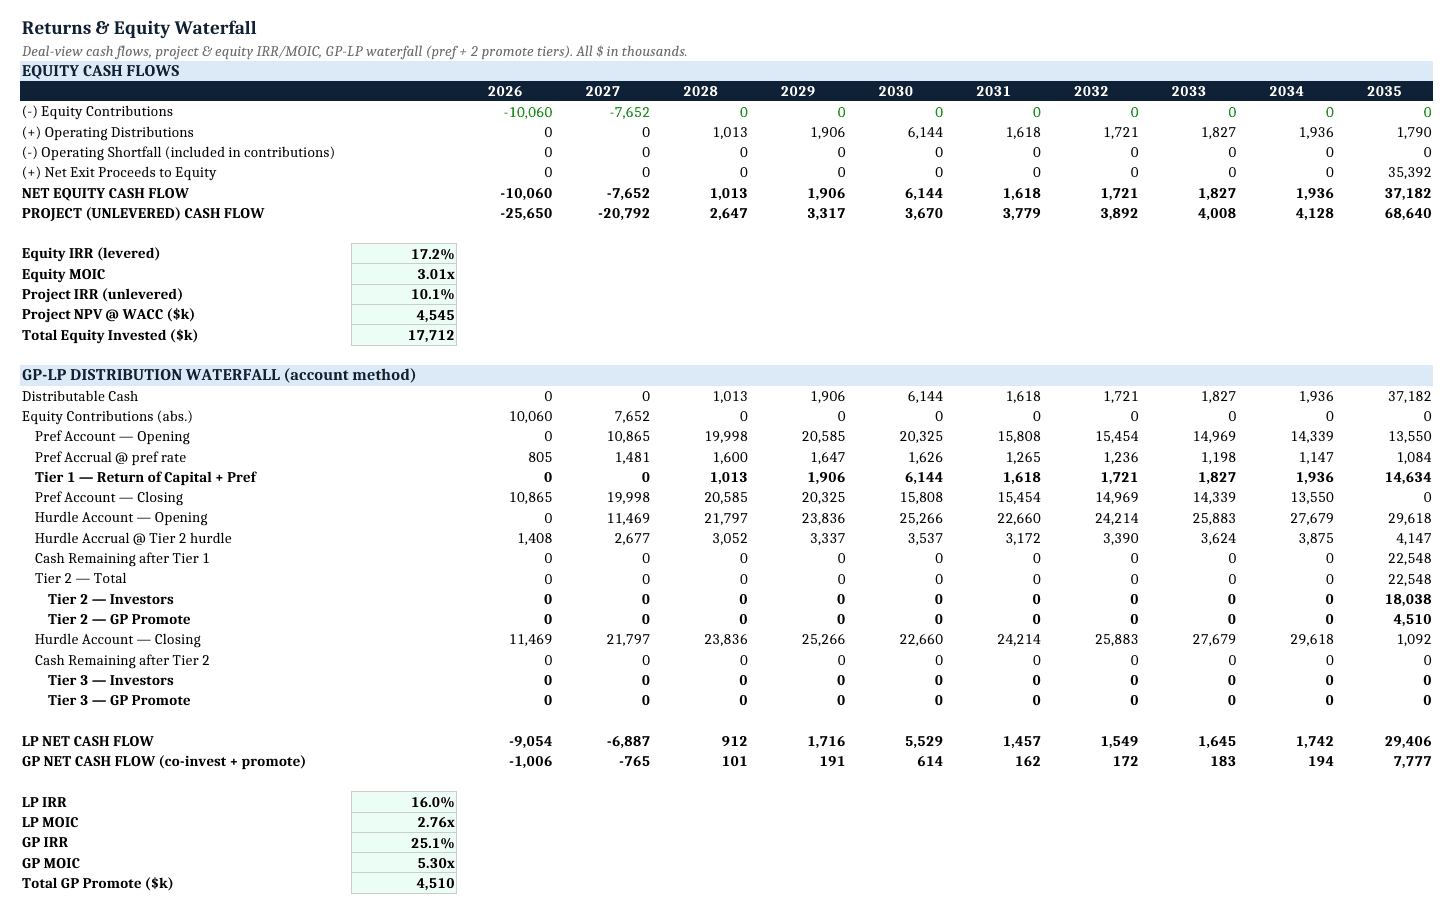
12) Returns — Project-level and equity-level return analysis: Project IRR, Equity IRR (unlevered and levered), MOIC, Cash Yield, and Yield on Cost (stabilized NOI / total project cost). GP/LP equity waterfall with preferred return (8%) and two IRR-based promote tiers showing GP economics and LP net returns. Refi cash-out distribution modeled in the waterfall.
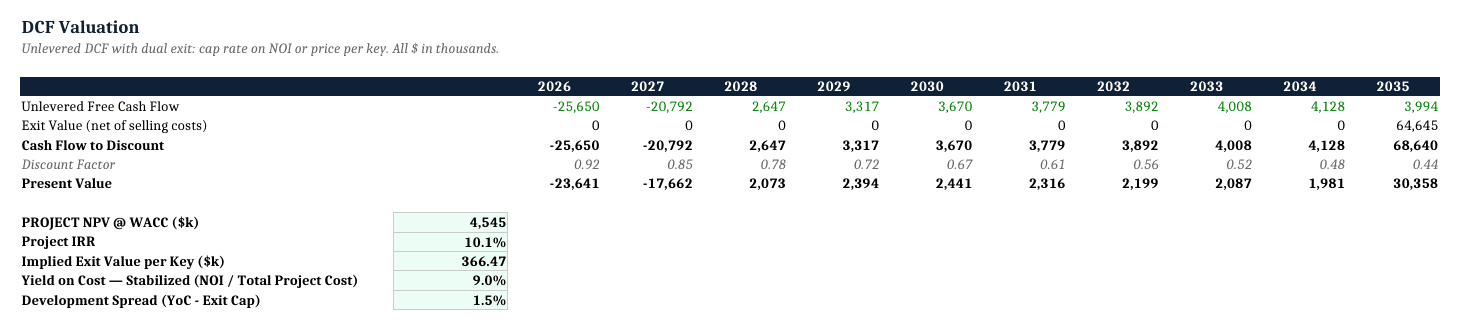
13) DCF — Discounted Cash Flow valuation with dual exit methodology: (1) Exit Cap Rate applied to stabilized NOI (industry standard for hotel assets) and (2) Price Per Key exit (the shorthand metric hotel investors use to size and compare deals). WACC calculation included. Outputs NPV and implied equity value under each exit scenario.
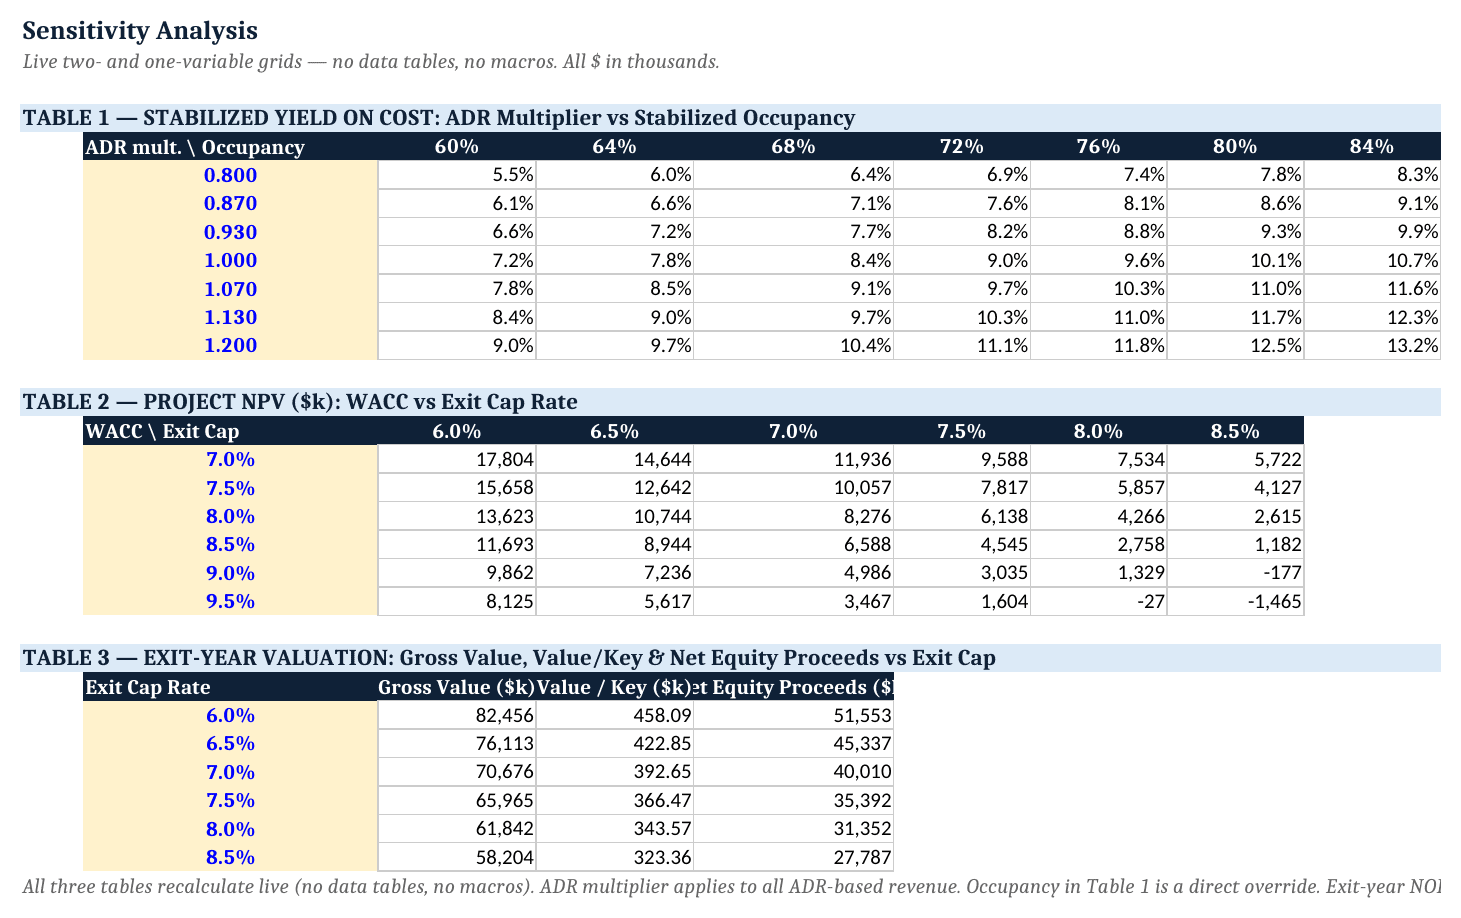
14) Sensitivity — Two live sensitivity tables (formula-based, no Excel Data Tables required): (1) Project IRR vs stabilized occupancy and ADR, (2) Equity IRR vs leverage ratio and exit cap rate. Base / Bull / Bear scenario toggle built into Assumptions.
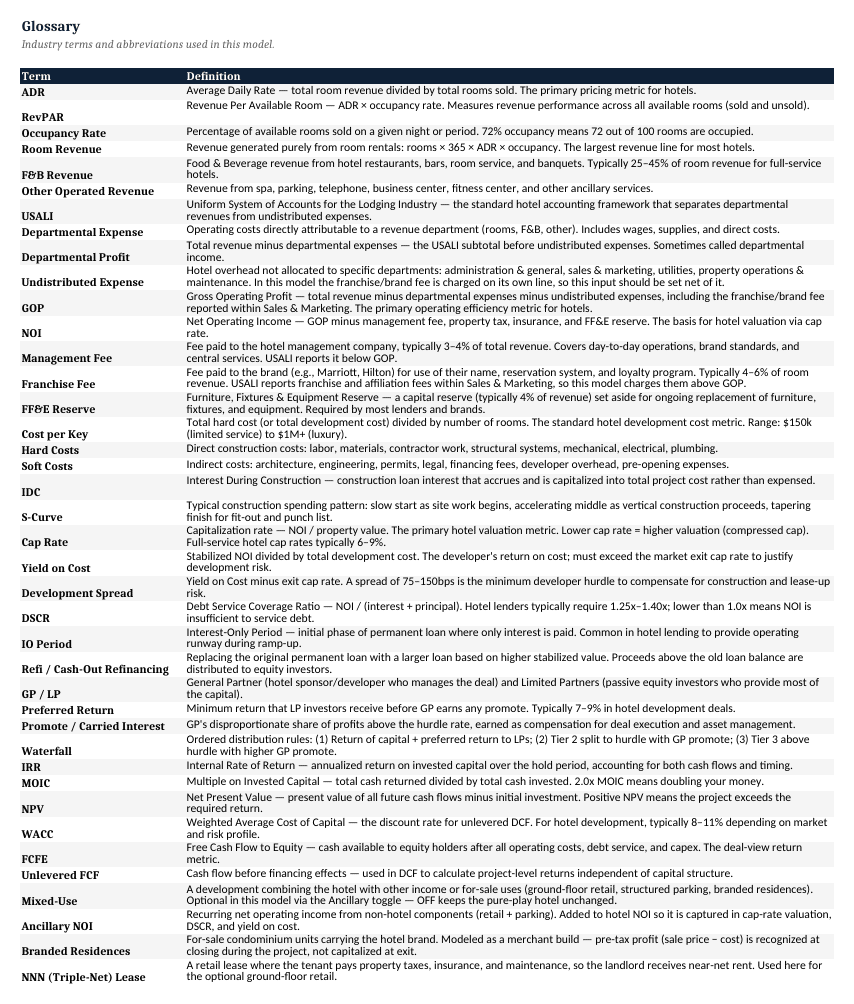
15) Glossary — Hospitality and project finance terms defined: ADR, RevPAR, occupancy rate, USALI, GOP, NOI, FF&E reserve, management fee, franchise fee, mixed-use, branded residences, cap rate, price per key, DSCR, IDC, IRR, MOIC, and more.
Key Outputs
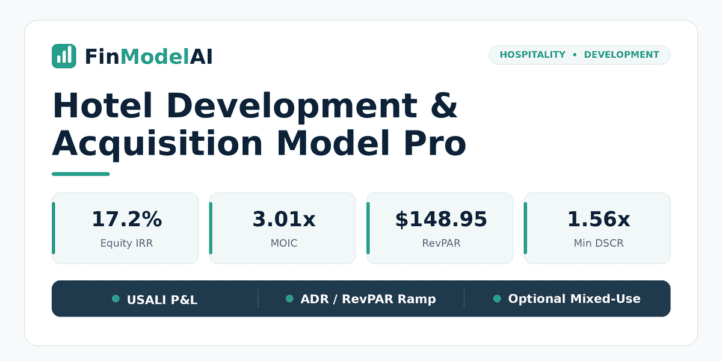
Metric Demo Scenario (Base Case) Project IRR 10.1% Equity IRR (Levered) 17.2% MOIC 3.01x LP Net IRR 16.0% DCF NPV +$4.5M @ 8.5% WACC Yield on Cost (Stabilized) 9.0% Min DSCR 1.56x Stabilized RevPAR $148.95 Cash-Out Refi (Year 5) $4.6M Total Capex $46.4M Exit Value per Key $366K Hotel Size 180 keys
Who It’s For
- Real estate private equity and family offices underwriting hotel development or acquisition investments
- Hotel developers and owner-operators building their first or next property and needing a financial model for lender and LP presentations
- Investment banks and advisors modeling hotel transactions, sale-leaseback structures, or portfolio financings
- Debt funds and construction lenders evaluating DSCR, debt sizing, and hotel construction loan risk
- Asset managers and REITs stress-testing hold-period economics and waterfall distributions
- MBA students and analysts learning hospitality finance, USALI accounting, and real estate development modeling
What Makes It Different
What this model offers is flexibility and integration: one workbook that does either a clean pure-play hotel or a full mixed-use deal, with a fully integrated 3-statement core and a visible integrity panel.
Pure-Play or Mixed-Use in One Workbook — A single toggle switches the model between a clean pure-play hotel underwrite and a mixed-use deal that adds ground-floor retail, parking, and branded residences. Premium mixed-use hotel models on the market force every buyer through that complexity even when they only need a hotel; here it is optional and off by default. For the majority of buyers underwriting a straightforward hotel, that means a simpler model — and for the minority doing a mixed-use scheme, the capability is one switch away.
Visible MODEL CHECKS Panel — The balance-sheet tie-out and key integrity flags are surfaced in a dedicated, visible panel rather than hidden in a corner of a calculation tab. You — and your lender or LP — can confirm at a glance that the three statements reconcile and the model is internally consistent.
USALI Departmental Structure — The model follows the Uniform System of Accounts for the Lodging Industry: Rooms, F&B, and Other Operated Departments each have their own revenue and expense build, flowing to departmental profit, then to GOP, then to NOI. This is how hotel lenders, brands, and institutional owners actually read a P&L.
ADR / RevPAR / Occupancy Ramp — The three metrics every hospitality investor tracks are modeled explicitly, year by year, from pre-opening through full stabilization. RevPAR is calculated automatically at every point in the ramp, so you can benchmark against comp set data from STR or CBRE.
Management Fee + Franchise Fee — Correctly modeled as percentages of total revenue, not lumped into undistributed expenses. This matters for lenders who underwrite to operator and brand economics separately.
FF&E Reserve — The capital reserve that is often missed in generic real estate models but is essential for hotel underwriting. Modeled as a percentage of revenue, accruing annually, with correct treatment in the Cash Flow and Balance Sheet.
Construction Loan + Permanent Takeout + Cash-Out Refi — The full financing lifecycle: construction draws, permanent debt takeout at stabilization with a parameterizable IO period, and an optional cash-out refinancing event at Year 5 that recapitalizes the equity stack and flows through the GP/LP waterfall.
GP/LP Waterfall with Dual Promote — The waterfall models preferred return, return of capital, and two IRR-based promote tiers that reflect how hotel JV economics are actually structured between sponsors and institutional limited partners. Refi distributions are modeled in the waterfall, not netted out.
Dual Exit Methodology — Exit Cap Rate on NOI (lender and REIT standard) and Price Per Key (operator and broker shorthand) are both modeled, giving you two independent exit valuation anchors for sensitivity and negotiation.
Sensitivity Without Data Tables — Both sensitivity tables are formula-driven rather than Excel Data Table-dependent, ensuring full compatibility across Excel versions, operating systems, and shared workbooks.
Technical Notes / Compatibility
- Built for Microsoft Excel (Windows and Mac)
- No VBA / macros, no circular references
- Automatic balance check (must equal zero every period)
- Compatible with Google Sheets (some charts may render differently)
- Currency and start year are parameterizable from the Assumptions tab
Files Included
You download a single Excel workbook (.xlsx) — 15 linked worksheets, no macros, no add-ins, no circular references. It opens in Excel 2016 or later, Microsoft 365, and Mac Excel, and is compatible with Google Sheets (some charts may render differently).
The workbook opens on a START HERE tab that walks you through the model in the order it was built, and closes on a Glossary defining every term and metric used. A short README accompanies the file with the quick start, the tab list, and the license terms.
Disclaimer
This template is provided for educational and analytical purposes only. It does not constitute financial, investment, legal, or engineering advice. Users are responsible for verifying all assumptions and outputs against project-specific data. Consult qualified professionals before making investment or financing decisions.
Similar ProductsOther customers were also interested in...



 eFinancialModels
Electric Vehicle (EV) Charging Station Financial M...
With this comprehensive 5- or 10-year monthly tool, investors can assess the viability of setting up... Read more

Financial Model for Mobile App | Mobile App Busine...
The Mobile App Financial Plan Template in Excel allows you to develop financial projections when lau... Read more

 HenrySheykin
Food Truck Financial Model Excel Template
The Food Truck Financial Model helps entrepreneurs, founders, business owners, consultants, and anal... Read more

Green Hydrogen Production from Wind Energy Financi...
The Green Hydrogen from Wind Financial Model aims to comprehensively forecast a horizon of 40 years ... Read more

Simple Mutual Non-Disclosure Agreement Template
Protect your business secrets with ease using our Simple Mutual Non-Disclosure Agreement Template. S... Read more

Solar Energy Financial Model
The Solar Energy Financial Model Spreadsheet Template in Excel assists you in preparing a sophistica... Read more

 Peter Graf
The Customer-Centric Financial Model for Restauran...
Starting a restaurant without a financial plan is like driving a car blindfolded. You wouldn´t do i... Read more
You must log in to submit a review.