
0 ITEMS

12-Month Operating Budget: Build and Monitor It

Nearly half of small businesses — 46% — run without a formal budget, and 82% of failed companies point to cash flow problems as a contributing cause. A 12-month operating budget closes that gap, but only if you treat it as a monthly management tool rather than a document you build once in January and never open again.
Key Takeaways
- Small business owners who budget annually are 2.5 times more likely to feel confident about their cash flow than those who don’t (Intuit QuickBooks, 2019).
- 46% of small businesses operate without a formal budget, creating a direct competitive disadvantage (Clutch, 2018).
- 82% of failed businesses cite cash flow problems as a contributing factor, making monthly monitoring as critical as the budget itself (U.S. Bank via SCORE, 2016).
- Businesses that review their budget monthly report 59% revenue growth, versus 31% for infrequent reviewers (SBA via Journal of Accountancy, 2018).
- Q4 spending runs 23% above the average quarter, so a flat monthly budget will always produce misleading variances (QuickBooks, 2019).
- Formal budgets increase the likelihood of hitting financial targets by 33% (CIMA, 2013).
- Build your budget in five layers: revenue forecast, cost of goods sold, fixed operating expenses, variable operating expenses, and cash flow bridge.
Why a 12-Month Operating Budget Is Non-Negotiable
A 12-month operating budget is a forward-looking financial plan that maps every dollar of expected revenue and spending across a full calendar year, giving you a baseline to measure actual performance against each month. Without one, you’re reacting to financial surprises instead of anticipating them.
The data makes the case plainly. Only 54% of small businesses had a documented annual budget in place, while 46% operated without a formal budget (Clutch, 2018). That 46% is flying blind. Meanwhile, firms that prepare formal budgets are about 33% more likely to achieve their financial targets than firms that skip the process (CIMA, 2013).
The cash flow angle is even more urgent. Up to 61% of small businesses regularly struggle with cash flow, with nearly one-third unable to pay themselves or their vendors (Intuit QuickBooks, 2019). A 12-month budget doesn’t just track spending — it forecasts the timing of cash in and cash out, so you see a vendor payment crunch in October before it becomes a crisis in November.
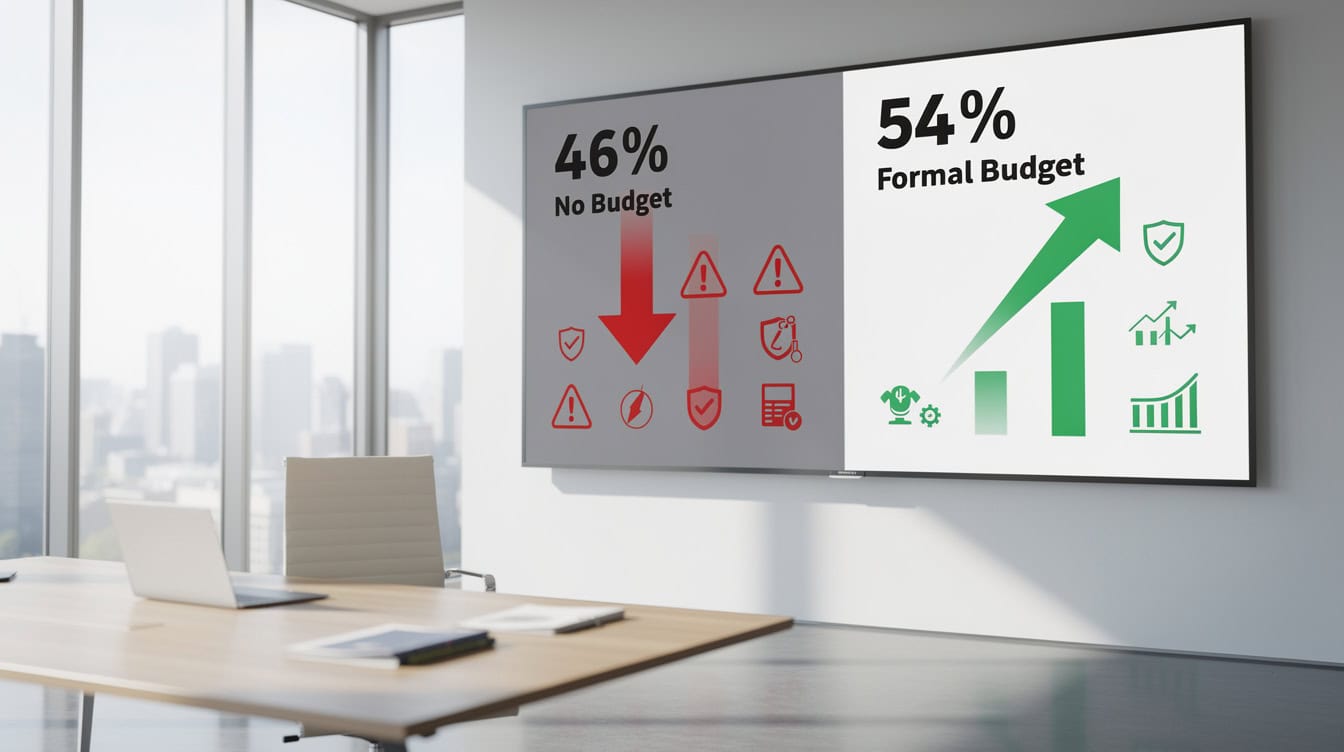
46% of small businesses operate without a formal budget — the group that is 2.5x less confident about their cash flow.
The Complete Anatomy of a 12-Month Operating Budget
A complete 12-month operating budget has five core layers, each feeding into the next. Think of it as a stack: revenue sits at the top, costs flow down, and the cash flow bridge at the bottom shows what’s actually left in the bank.
Layer 1: Revenue Projections
Revenue forecasting (estimating future sales based on historical data, market conditions, or a bottom-up pipeline) is the foundation. Three methods work for small businesses:
- Historical growth method: Take last year’s monthly revenue and apply a growth rate. Formula:
Projected Revenue = Prior Year Revenue × (1 + Growth Rate). - Market-based method: Estimate total addressable market share you can realistically capture.
- Bottom-up pipeline method: Sum your active deals by close probability. Formula:
Projected Revenue = Σ (Deal Value × Close Probability).
Layer 2: Cost of Goods Sold (COGS)
COGS (the direct costs of producing your product or delivering your service) moves with revenue. Express it as a percentage of revenue: COGS = Revenue × COGS %. For a services business, COGS typically runs 30-50% of revenue; for product businesses, 40-60%.
Layer 3: Fixed Operating Expenses
Fixed costs (expenses that don’t change with sales volume, such as rent, salaries, insurance, and software subscriptions) are the easiest to budget. List each line item with its monthly amount and sum them.
Layer 4: Variable Operating Expenses
Variable costs (expenses that scale with activity, such as marketing spend, commissions, shipping, and utilities) need a driver-based formula. Example: Marketing Spend = Revenue × 8%.
Layer 5: Cash Flow Bridge
The cash flow bridge converts your profit forecast into actual bank balance movement by accounting for accounts receivable lag (the delay between invoicing and collecting cash), accounts payable timing, and capital expenditures. Formula: Ending Cash = Beginning Cash + Cash Receipts - Cash Disbursements.
The five-layer budget framework: each layer feeds into the next, with the cash flow bridge converting profit into bank balance.
Step-by-Step: Building Your First 12-Month Operating Budget
Building a 12-month operating budget takes four focused sessions, not four weeks. Here’s the exact sequence with real numbers for a hypothetical $600,000/year services business.
Step 1: Anchor on last year’s actuals.
Pull 12 months of income statement data. If you’re a startup without history, use industry benchmarks from your trade association or SBA industry profiles.
Step 2: Set your revenue forecast.
Our example business earned $600,000 last year and expects 15% growth. Annual target: $690,000. Divide by 12 for a flat monthly baseline of $57,500, then apply seasonal weights (covered in the next section).
Step 3: Calculate COGS.
At a 40% COGS ratio: $57,500 × 40% = $23,000/month. Annual COGS budget: $276,000.
Step 4: List fixed operating expenses.
For our example business:
| Line Item | Monthly Budget |
|---|---|
| Rent | $4,500 |
| Salaries (non-COGS) | $18,000 |
| Insurance | $800 |
| Software subscriptions | $600 |
| Loan repayment | $1,200 |
| Total Fixed OpEx | $25,100 |
Step 5: Estimate variable operating expenses.
At 10% of revenue for marketing and 3% for commissions: $57,500 × 13% = $7,475/month.
Step 6: Calculate operating income.
Here’s the math: $57,500 (Revenue) - $23,000 (COGS) - $25,100 (Fixed OpEx) - $7,475 (Variable OpEx) = $1,925 operating income per month on a flat basis. That’s a 3.3% operating margin — thin, which is exactly why monitoring matters.
Step 7: Build the cash flow bridge.
If customers pay on 30-day terms, January’s $57,500 in revenue arrives as cash in February. Add a row for Cash Receipts = Prior Month Revenue. This single adjustment often reveals months where the business is technically profitable but cash-negative.
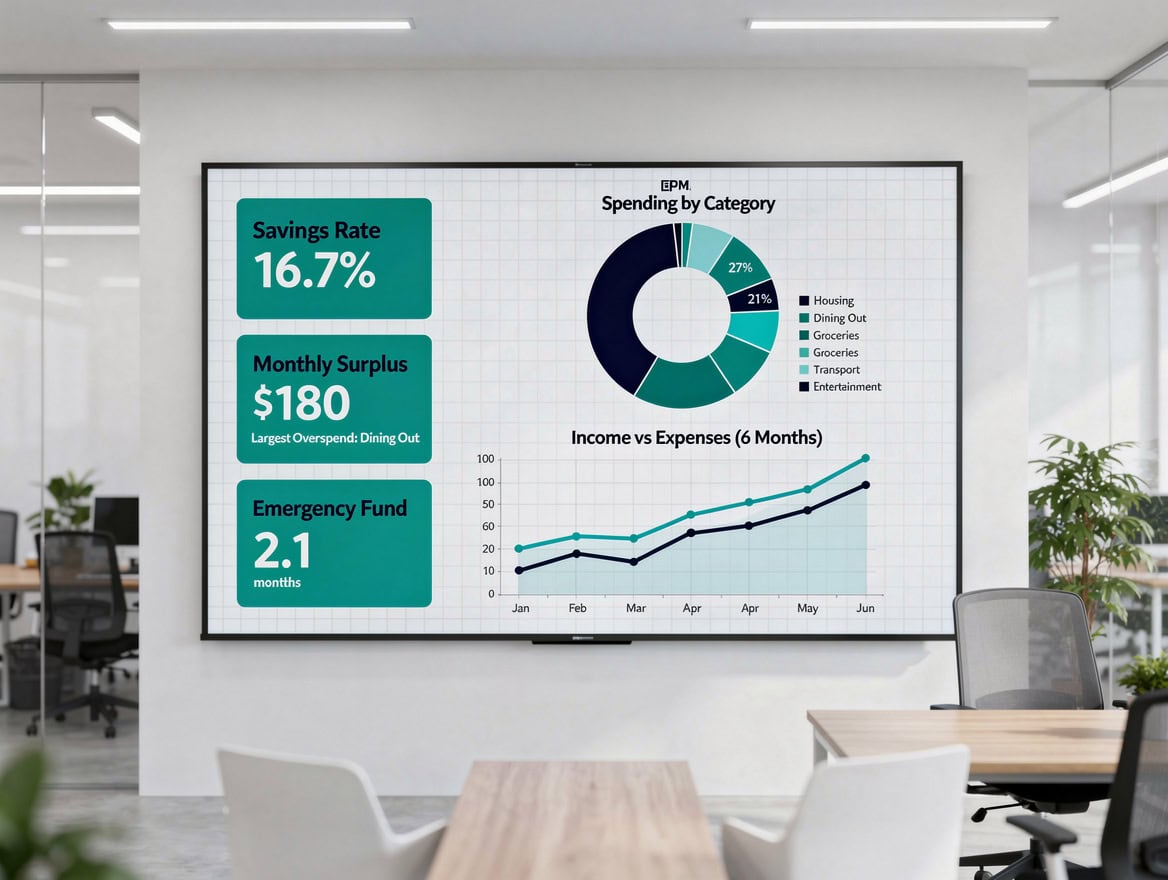
A properly structured budget workbook separates fixed and variable costs so seasonal adjustments flow through automatically.
Accounting for Seasonality and Quarterly Spending Patterns
A flat monthly budget is almost always wrong. Seasonal adjustment means distributing your annual budget unevenly across months to reflect real-world demand and spending patterns.
Small businesses spend 23% more in Q4 than in the average quarter (QuickBooks, 2019). For our $690,000 revenue business, that means Q4 operating costs will run roughly $8,000-$10,000 above the monthly average. Budget for it explicitly or you’ll show a false variance every November and December.
How to build seasonal weights:
- Calculate each month’s share of last year’s total revenue. Example: if December was $72,000 of $600,000, its weight is 12%.
- Multiply your annual budget by each month’s weight:
Monthly Budget = Annual Budget × Monthly Weight. - Apply the same weights to variable costs, since they track revenue.
- Keep fixed costs flat — rent doesn’t spike in December.
Quarterly spending adjustment example:
If Q4 (Oct-Dec) historically represents 30% of annual revenue for a retail-adjacent business, budget $207,000 of the $690,000 annual revenue target into those three months, versus $172,500 if spread evenly. The $34,500 difference is real money that needs to be in your cash plan.
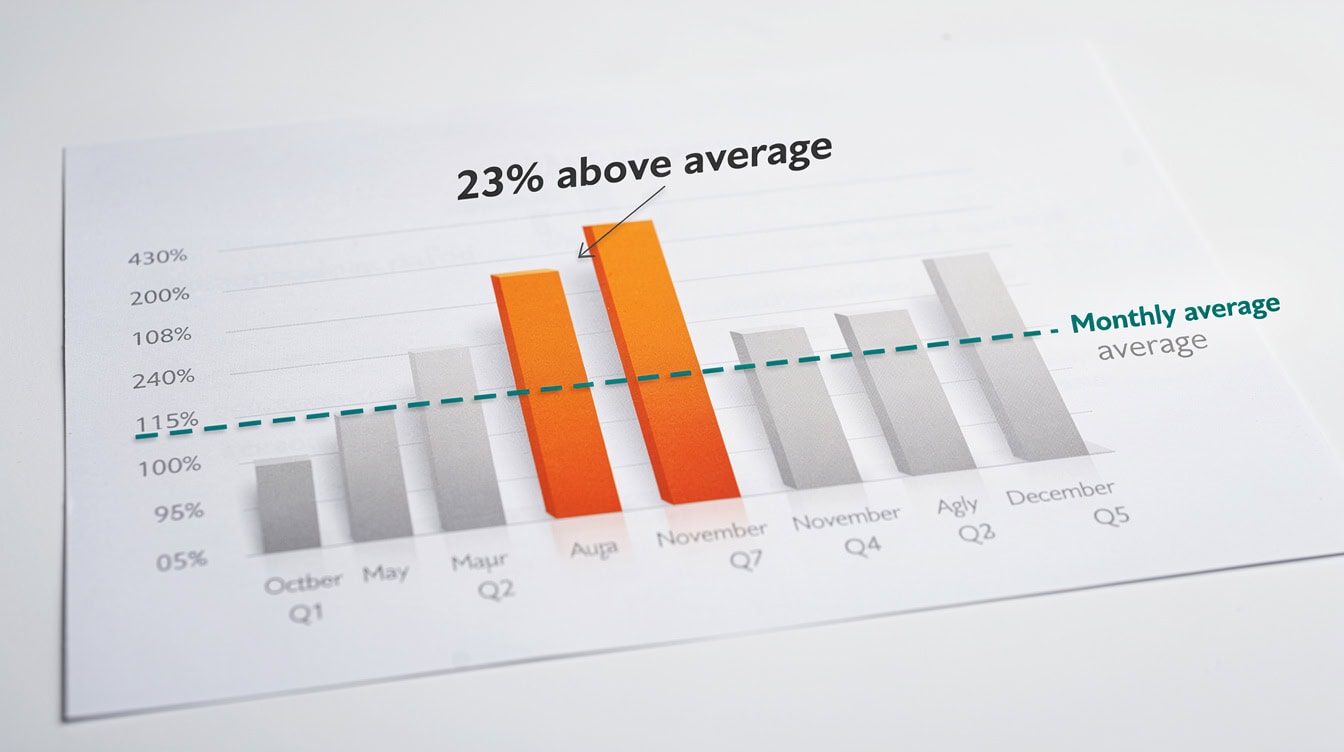
Q4 spending runs 23% above the average quarter — a flat monthly budget will always produce misleading variances in November and December.
Budget Monitoring: Turning Your Plan Into a Management Tool
A budget you build once and never review is a document. A budget you review monthly is a management tool. The monitoring discipline is what drives the 59% revenue growth rate seen in businesses that track metrics at least monthly, compared to 31% for infrequent reviewers (SBA via Journal of Accountancy, 2018).
Set a fixed monthly review date, ideally within 10 business days of month-end when your accounting data is fresh. Your monthly review should cover four questions:
- Did revenue hit the budget? By how much, and why?
- Did operating expenses stay within budget? Which lines overspent?
- Is cash flow tracking to the forecast?
- Does the full-year forecast need updating?
The 5% variance rule: Any line item that deviates more than 5% from budget in a given month warrants a written explanation. Deviations above 10% require a corrective action plan. This threshold keeps your review focused on meaningful signals rather than rounding noise.
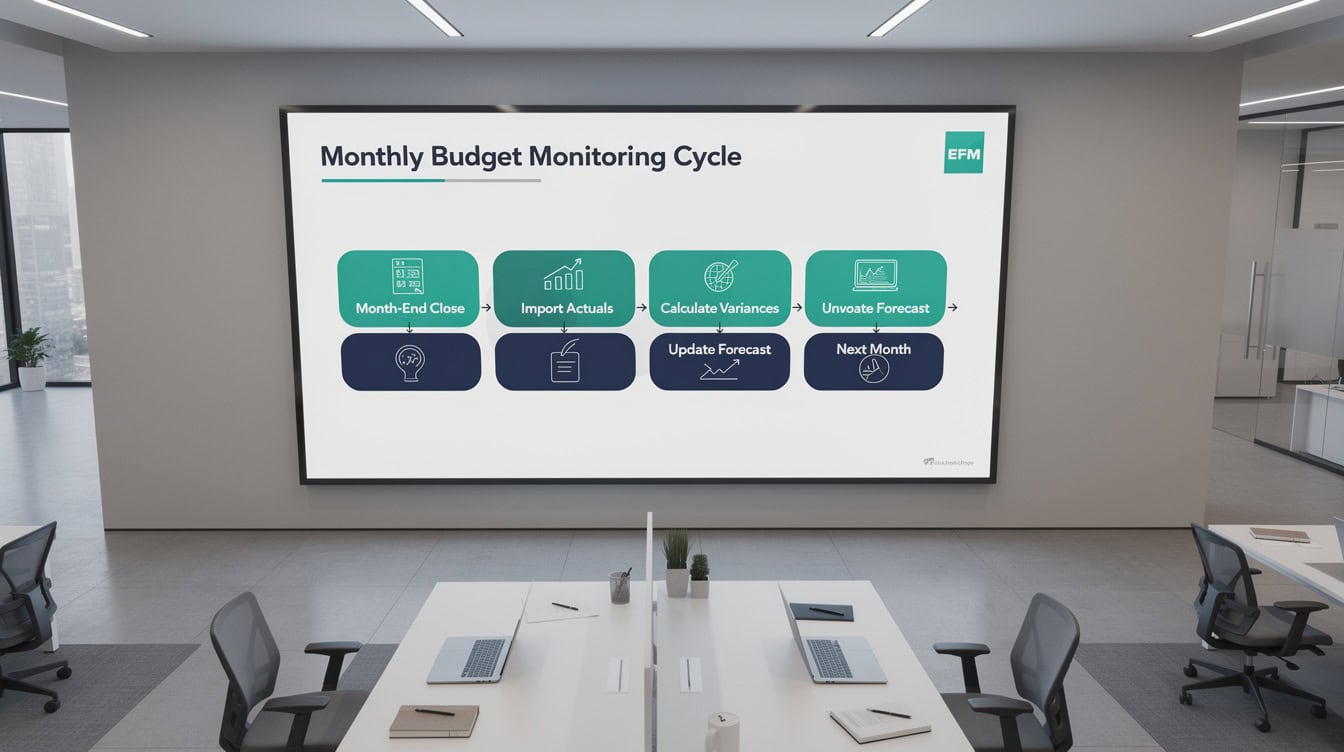
Monthly budget monitoring is a repeatable 5-step cycle, not a one-time annual event.
Monthly Variance Analysis and Performance Tracking
Variance analysis (the process of comparing budgeted figures to actual results and quantifying the difference) is the core skill of budget monitoring. The formula is simple: Variance = Actual - Budget. A positive variance on revenue is favorable; a positive variance on expenses is unfavorable.
Variance analysis dashboard: key KPIs to track monthly
| KPI | Formula | Alert Threshold | ||
|---|---|---|---|---|
| Revenue variance % | (Actual – Budget) / Budget | > ±5% | ||
| Gross margin % | (Revenue – COGS) / Revenue | < prior month by 2pts | ||
| Operating expense ratio | Total OpEx / Revenue | > budget by 3pts | ||
| Cash runway | Current Cash / Monthly Burn | < 3 months | ||
| Accounts receivable days | AR / (Revenue / 30) | > 45 days | ||
| Budget accuracy score | 1 – ( | Variance | / Budget) | < 90% |
For our example business, if November actual revenue comes in at $54,000 against a budget of $60,000, the variance is -$6,000 or -10%. That triggers an investigation: Was it a lost deal, a delayed payment, or a market shift? The answer determines whether you adjust December’s forecast or simply note a one-time timing issue.
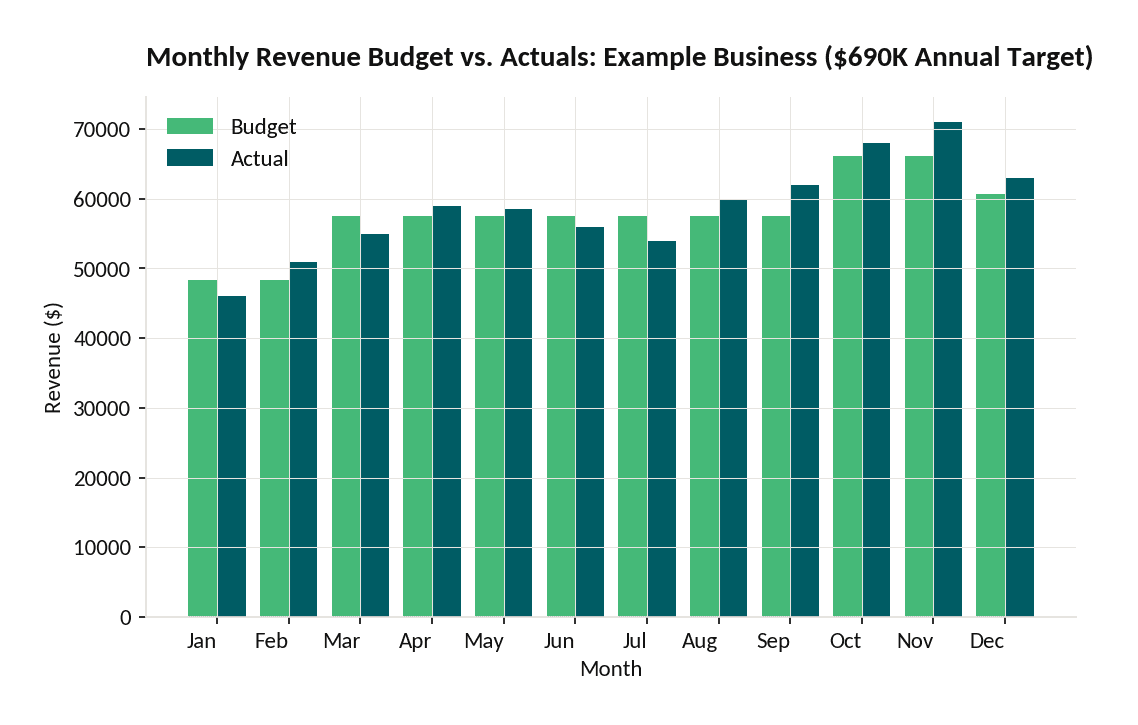
Monthly budget vs. actual comparison reveals Q4 outperformance and Q1 underperformance — both require forecast adjustments.
Technology Stack: Tools for Budget Building and Monitoring
The right tool depends on your business complexity and the team’s comfort level. Excel and Google Sheets handle most small business budgets effectively when built with proper formulas. Accounting software adds real-time actuals integration.
| Tool Type | Best For | Budget vs. Actual Integration |
|---|---|---|
| Excel / Google Sheets | Businesses under $2M revenue, custom models | Manual import from accounting software |
| QuickBooks Online | Businesses already on QBO, automated actuals | Native budget vs. actual reports |
| Xero | Multi-currency, project-based businesses | Native tracking categories |
| Dedicated FP&A tools (e.g., Jirav, Mosaic) | $5M+ businesses with finance teams | Automated GL sync |
For the 46% of businesses currently without any formal budget, a well-structured Excel template is the fastest path to implementation. You can connect it to QuickBooks or Xero by exporting a monthly P&L and pasting actuals into a variance tab. The Budget vs Actual Excel Template from EFM automates this comparison with pre-built variance formulas.
If you’re already using accounting software, activate its budgeting module first. QuickBooks Online’s budget feature lets you enter monthly targets by account and generates a Budget vs. Actuals report with one click — no manual reconciliation needed.
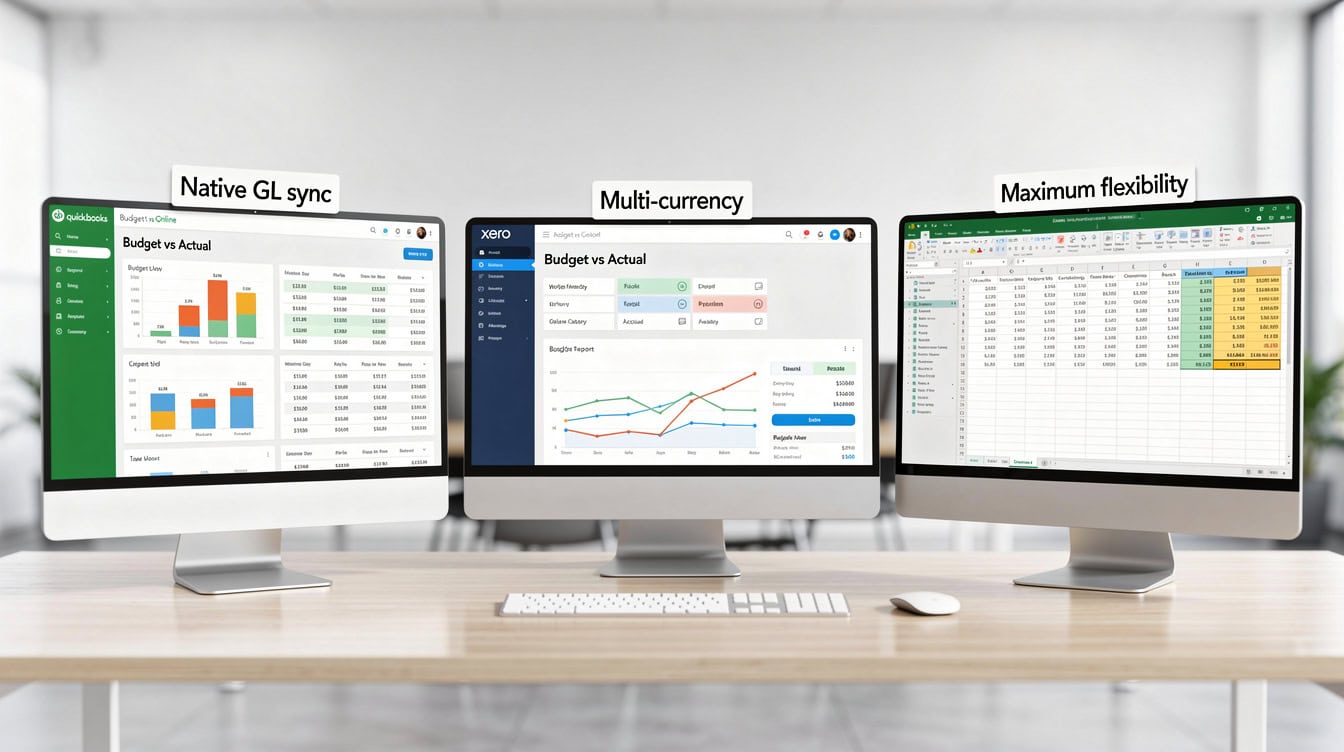
For businesses under $2M in revenue, Excel with a monthly P&L import often outperforms dedicated software for budget flexibility.
Common Budget Pitfalls and How to Avoid Cash Flow Crises
Most budget failures come from five predictable mistakes. Each has a specific fix.
Pitfall 1: Budgeting profit, not cash.
A business can be profitable on paper while running out of cash if customers pay late. Fix: always build a separate cash flow forecast alongside your P&L budget, accounting for 30-60 day receivables lag. This is the root cause behind the statistic that 82% of failed businesses cite cash flow problems (U.S. Bank via SCORE, 2016).
Pitfall 2: Using last year’s numbers without adjustment.
Inflation, headcount changes, and new contracts all shift your cost structure. Fix: review every fixed cost line item for known changes before copying prior-year figures.
Pitfall 3: Ignoring seasonality.
Flat monthly budgets create phantom variances in high and low seasons. Fix: apply historical monthly weights as described in the seasonality section above.
Pitfall 4: No contingency reserve.
Unexpected costs hit every business. Fix: add a contingency line equal to 3-5% of total operating expenses. For our example business at $25,100/month in fixed OpEx, that’s a $750-$1,255 monthly buffer.
Pitfall 5: Building the budget but skipping the review.
A budget reviewed quarterly instead of monthly loses most of its value. Fix: schedule 12 monthly review meetings at the start of the year and treat them as non-negotiable. The businesses that review monthly grow revenue at nearly twice the rate of those that don’t (SBA via Journal of Accountancy, 2018).
For a ready-to-use monitoring framework, the Cash Flow Statement Template with Budget Versus Actuals Analysis combines both the P&L budget and cash flow tracking in one workbook.
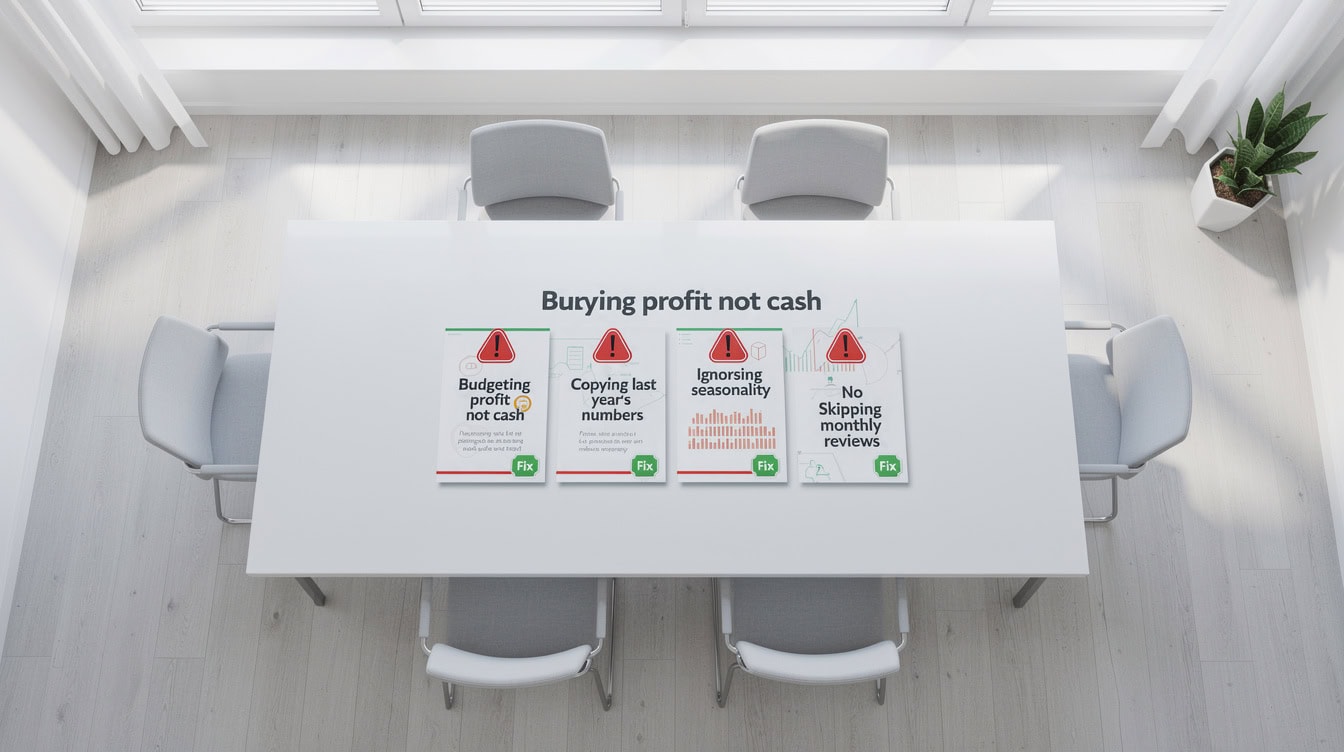
82% of failed businesses cite cash flow problems — most trace back to one of these five avoidable budgeting mistakes.
Quarterly Budget Reviews and Rolling Forecast Adjustments
A rolling forecast (a budget that updates forward-looking projections each quarter based on actual results, rather than staying locked to the original annual plan) keeps your numbers relevant as conditions change. It’s the difference between a static plan and a live management tool.
At the end of each quarter, run a three-step update:
- Lock the quarter’s actuals. Replace Q1 budget figures with Q1 actuals in your model.
- Reforecast the remaining quarters. Adjust revenue and variable cost assumptions based on what you’ve learned. If Q1 revenue came in 8% below budget, decide whether to revise the full-year target or plan a recovery strategy for Q2-Q4.
- Update the cash flow bridge. Recalculate ending cash for each remaining month using the revised forecasts.
For businesses with strong seasonality, also revisit your Q4 spending plan each October. The 23% Q4 spending spike means that a business that hasn’t pre-planned its holiday inventory, year-end bonuses, or Q4 marketing push will face cash pressure precisely when it can least afford surprises.
The Budget Vs. Actual: 3-Year template is purpose-built for this rolling review process, with tabs for each year and automated variance calculations that carry forward into the next planning cycle.
Frequently Asked Questions
What is a 12-month operating budget and how does it differ from a cash flow forecast?
A 12-month operating budget is an income-statement-based plan that projects revenue, cost of goods sold, and operating expenses for each month of the year. It shows whether the business is expected to be profitable. A cash flow forecast, by contrast, tracks the actual timing of cash moving in and out of the bank account, accounting for payment terms and receivables lag. The two tools are complementary: the operating budget tells you if you’re making money; the cash flow forecast tells you if you’ll have money in the bank to pay your bills. Most small businesses need both, and the best practice is to build them in the same workbook so changes to revenue assumptions flow through to both automatically.
How do I forecast revenue if my business is less than one year old?
Without 12 months of history, use a bottom-up pipeline method: list every active sales opportunity, assign a close probability (0-100%), and multiply deal value by probability. Sum the results for each month. For example, a $10,000 deal at 60% probability contributes $6,000 to your forecast. Supplement this with industry benchmarks from SBA industry profiles or trade association data for your sector. Build in a 20% haircut on your first-year forecast to account for the learning curve — most new businesses overestimate early revenue by 15-30% according to common financial planning practice.
What percentage variance should trigger a budget review?
Use a 5% threshold for line-item variances as your standard alert level, and a 10% threshold as your escalation trigger requiring a corrective action plan. On a $57,500 monthly revenue budget, a 5% variance equals $2,875 — meaningful but potentially explainable by timing. A 10% variance ($5,750) signals a structural issue worth investigating. Apply the same thresholds to expense lines. For cash flow specifically, any month where ending cash falls below three months of operating expenses (your cash runway) should trigger an immediate review regardless of the percentage variance.
How do I handle seasonal businesses where some months have near-zero revenue?
For highly seasonal businesses (ski resorts, tax preparers, holiday retailers), build your budget using monthly revenue weights derived from prior-year actuals rather than dividing the annual total by 12. If January represents 2% of annual revenue and December represents 18%, your budget should reflect that. More importantly, your cash flow bridge must show how you fund fixed costs during low-revenue months. The standard approach is to build a cash reserve during peak months: if your fixed costs run $25,000/month and you have three near-zero months, you need a $75,000 cash buffer funded from peak-season profits. The Simple Budget Planner Template includes seasonal weighting inputs for exactly this scenario.
How often should I update my 12-month operating budget?
Review actuals versus budget monthly, within 10 business days of month-end. Update forward-looking projections quarterly using the rolling forecast method: lock the completed quarter’s actuals, then reforecast the remaining months based on what you’ve learned. Don’t revise the original annual budget document itself — preserve it as your baseline for year-end performance evaluation. Instead, maintain a separate “revised forecast” column alongside the original budget. This lets you track both how well you planned (budget vs. actual) and how well you adapted (revised forecast vs. actual). Businesses that follow this monthly review cadence report 59% revenue growth rates, nearly double the 31% seen in infrequent reviewers (SBA via Journal of Accountancy, 2018).
What line items do most small businesses forget to include in their operating budget?
The five most commonly omitted line items are: (1) employer payroll taxes, typically 7.65% of gross wages in the U.S. for FICA contributions; (2) annual insurance renewals that spike in a single month rather than spreading evenly; (3) software subscription renewals billed annually; (4) professional services fees (accounting, legal) that are irregular but predictable; and (5) the contingency reserve of 3-5% of total operating expenses. Together, these omissions can add 10-15% to actual costs versus the initial budget, which is why so many businesses show unfavorable expense variances in the months these costs hit.
Can I use a spreadsheet template instead of accounting software for budget monitoring?
Yes, and for businesses under $2 million in annual revenue, a well-built Excel or Google Sheets template often outperforms accounting software for budget monitoring because it’s more flexible. The key is building a variance tab that pulls actuals from a monthly P&L export and automatically calculates the difference against your budget. Set up conditional formatting to highlight cells where variance exceeds 5% in red. The limitation of spreadsheets is manual data entry — you’ll spend 30-60 minutes per month importing actuals. Accounting software with native budgeting modules (QuickBooks Online, Xero) eliminates that step but requires you to enter your budget directly into the platform, which is less flexible for scenario modeling.
Build the Budget, Then Work the Budget
A 12-month operating budget earns its value not on the day you build it but on the 12 days each year you sit down to compare plan to reality. The businesses that do this consistently grow revenue at nearly twice the rate of those that don’t, avoid the cash flow crises that sink 82% of failed companies, and hit their financial targets 33% more often.
Start with the five-layer framework: revenue forecast, COGS, fixed operating expenses, variable operating expenses, and cash flow bridge. Apply seasonal weights so your Q4 numbers reflect the real 23% spending spike. Set your 5% variance threshold and schedule 12 monthly reviews before the year begins.
I recommend downloading the free 12-month operating budget template from EFM to implement this system today. It includes pre-built variance formulas, seasonal adjustment inputs, and a cash flow bridge tab — everything covered in this guide, ready to populate with your own numbers.
























































