0 ITEMS

Airbnb Profit Calculator: Real After-Tax Numbers

Most Airbnb hosts overestimate their profit by 30-50% because they calculate gross revenue and stop there. This guide shows you the full picture, from nightly rate to after-tax cash in your pocket, using a real worked example and a free downloadable spreadsheet.
Key Takeaways
- A 2-bedroom property at $150/night and 60% occupancy generates $32,850 gross revenue but only $7,140 in after-tax net profit once mortgage, fees, and taxes are subtracted.
- Airbnb charges hosts a 3% service fee on every booking, which reduces gross revenue before any other expense is counted.
- Property management fees for short-term rentals typically run 15-25% of gross revenue, making self-management the single largest cost lever available to hosts.
- Break-even occupancy for a typical 2-bedroom property with a $1,800/month mortgage sits around 48-52%, meaning you need roughly half your nights booked just to cover fixed costs.
- Residential rental property depreciates over 27.5 years using straight-line depreciation under IRS rules, creating a non-cash deduction that can shelter thousands in taxable income annually.
- After-tax profit depends heavily on your marginal tax bracket: a host in the 22% bracket keeps $0.78 of every pre-tax dollar, while a host in the 32% bracket keeps only $0.68.
- Vacancy loss beyond your stated occupancy rate, typically 5-10% for turnover days and maintenance windows, must be modeled as a separate line item to avoid overstating income.
Why After-Tax Net Profit Matters More Than Gross Revenue
Gross revenue is the number Airbnb shows on your dashboard. After-tax net profit is the number that pays your mortgage, funds your retirement, and tells you whether the investment is actually worth it. These two figures can differ by 60% or more once you subtract platform fees, operating costs, debt service, and income taxes.
New hosts routinely anchor on the top-line number. A property earning $150/night sounds like $54,750 per year at full occupancy, but realistic occupancy rates in most U.S. markets sit well below that ceiling. According to the U.S. Census Bureau’s American Housing Survey, short-term rental vacancy rates vary significantly by metro area, and hosts who ignore this variability build financial plans on sand.
The IRS treats short-term rental income as ordinary income when you rent for more than 14 days per year and provide substantial services (the standard Airbnb model). That means your profit is taxed at your marginal rate, not the lower long-term capital gains rate. For the 2024 tax year, there are 7 federal income tax brackets ranging from 10% to 37%. Source Knowing which bracket your rental income pushes you into is essential before projecting after-tax returns. Understanding this distinction before you buy a property is essential.
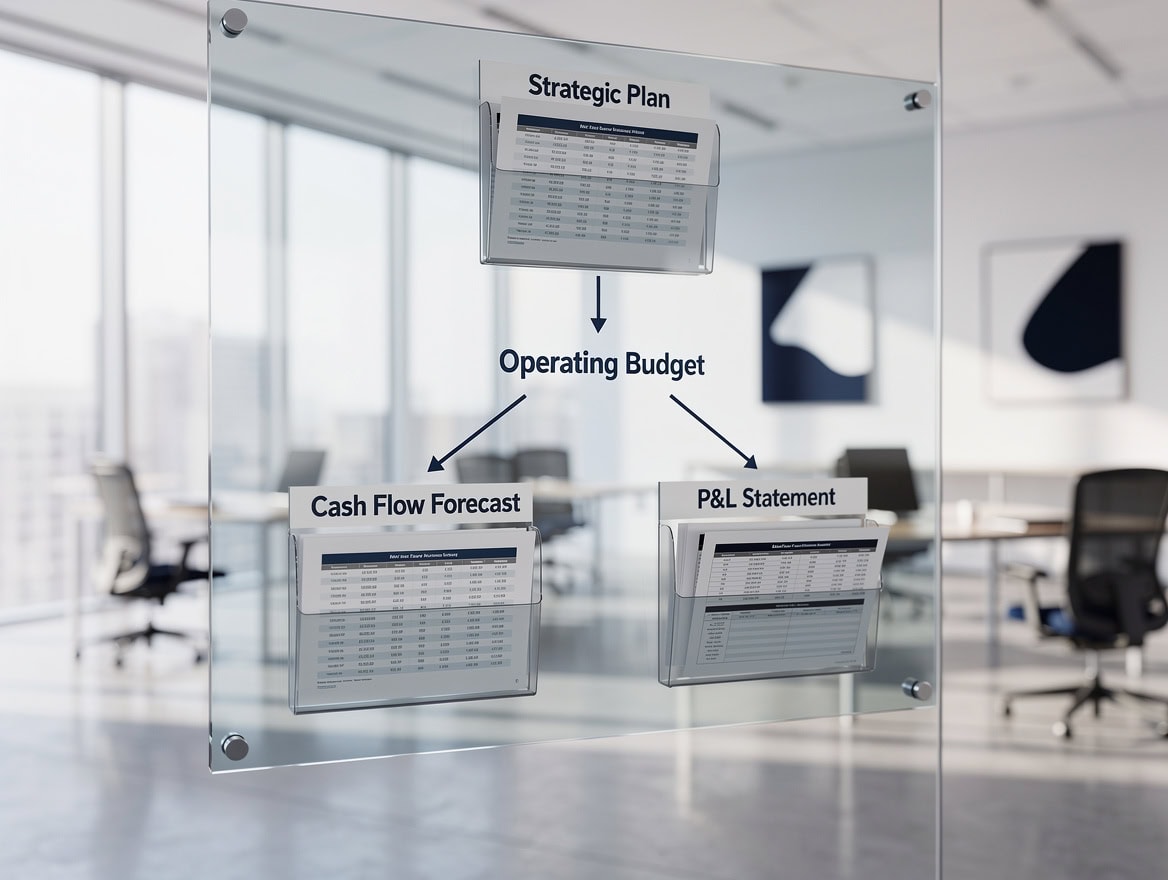
Gross revenue shrinks at every step: platform fees, operating costs, mortgage payments, and income taxes each take a share before you see net profit.
Worked Example: 2-Bedroom Property Financial Breakdown
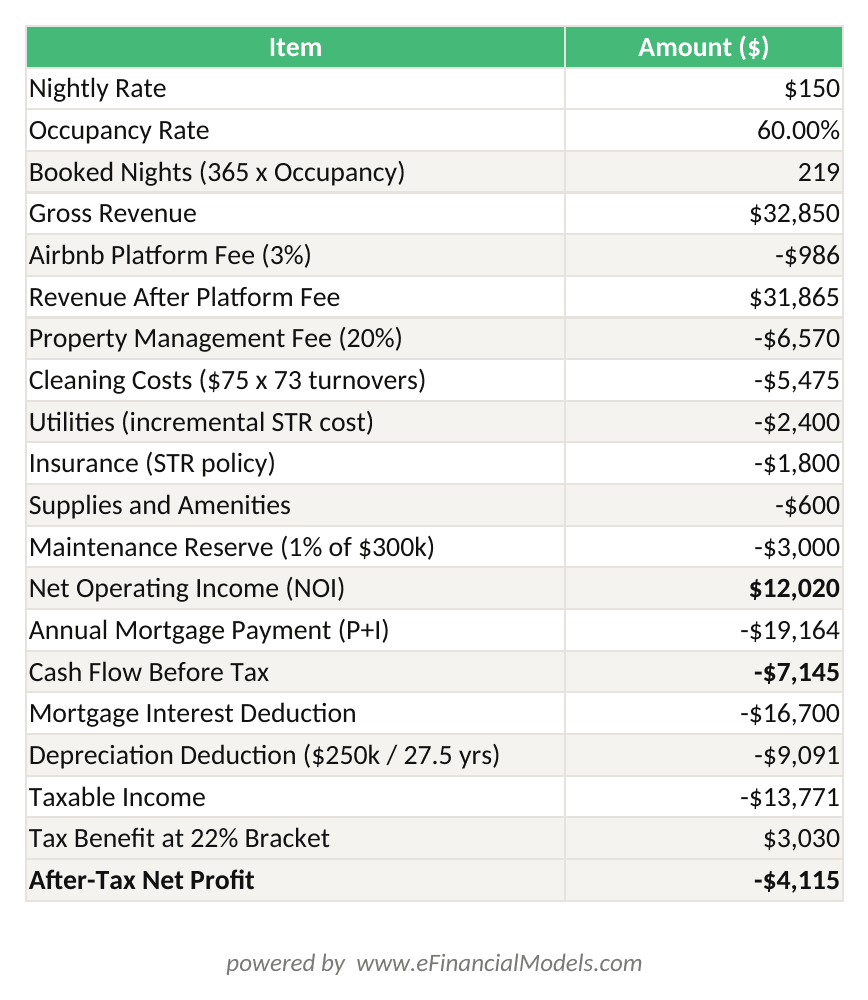
Here’s the math for a 2-bedroom property priced at $150/night with 60% occupancy across 365 nights.
Step 1: Gross Revenue
- Available nights: 365
- Occupied nights (60%): 219
- Nightly rate: $150
- Gross revenue: 219 × $150 = $32,850
Step 2: Subtract Platform Fee
- Airbnb host service fee (3%): $32,850 × 0.03 = $985.50
- Revenue after platform fee: $31,864.50
Step 3: Subtract Operating Expenses
- Property management fee (20% of gross): $6,570
- Cleaning costs ($75/turnover × 73 turnovers): $5,475
- Utilities (incremental increase for STR use): $2,400
- Insurance (STR-rated policy premium): $1,800
- Supplies and amenities: $600
- Repairs and maintenance reserve (1% of property value, $300,000 property): $3,000
- Total operating expenses: $19,845
Step 4: Subtract Mortgage Interest (tax-deductible portion)
- Monthly mortgage payment (P+I on $240,000 at 7%): $1,597/month = $19,164/year
- Interest portion (year 1 approximation): $16,700
- Principal portion (not deductible, not an expense): $2,464
- Cash outflow for mortgage: $19,164
Step 5: Net Operating Income (NOI)
- Revenue after platform fee: $31,864.50
- Less operating expenses: $19,845
- NOI: $12,019.50
Step 6: Cash Flow Before Tax
- NOI: $12,019.50
- Less mortgage cash payment: $19,164
- Cash flow before tax: -$7,144.50 (negative cash flow)
Step 7: Taxable Income (different from cash flow)
- NOI: $12,019.50
- Less mortgage interest deduction: $16,700
- Less depreciation ($300,000 ÷ 27.5 years): $10,909
- Taxable income: -$15,589.50 (paper loss, may offset other income subject to passive activity rules)
Step 8: After-Tax Net Profit (cash basis)
- Cash flow before tax: -$7,144.50
- Tax benefit at 22% bracket on deductible expenses: approximately $7,480
- Estimated after-tax net profit: $335 per year
This example illustrates a critical reality: a property that looks profitable on gross revenue alone can produce near-zero or negative cash flow once all costs are counted. The tax deductions create a paper benefit, but the actual cash position is tight.
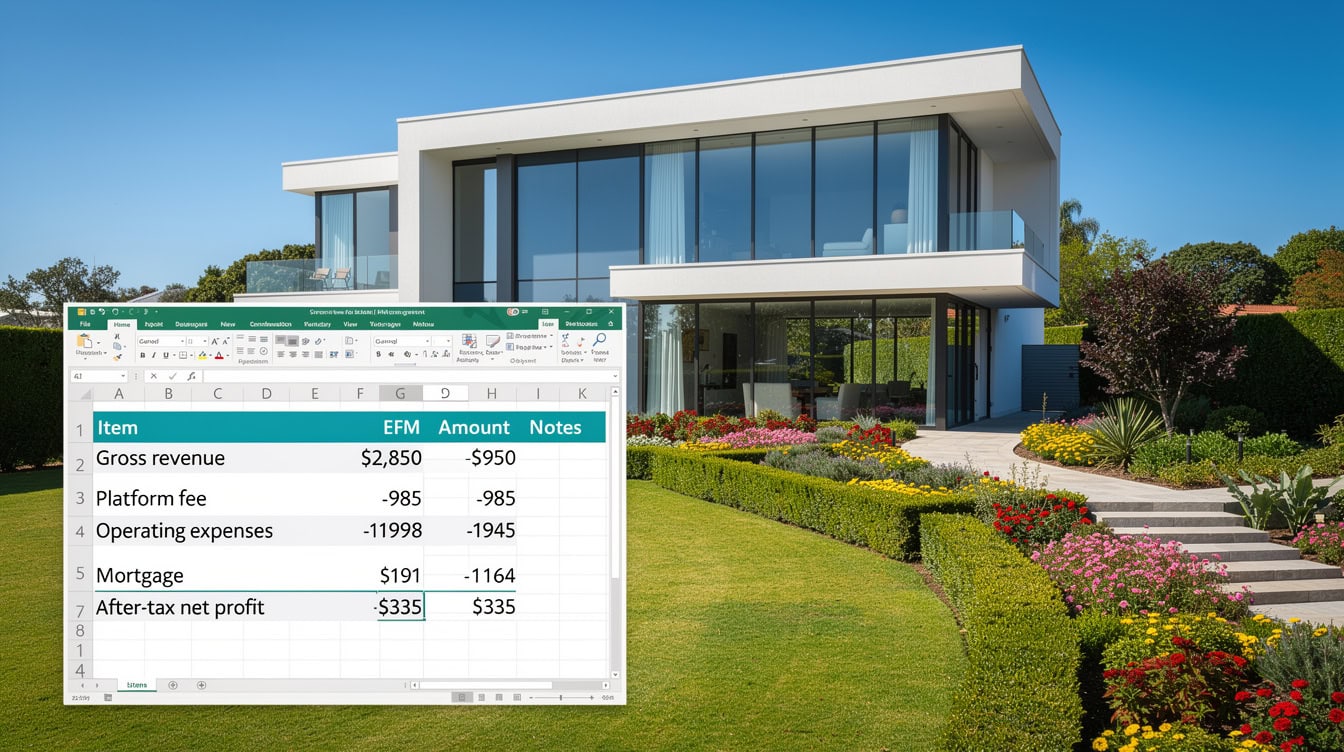
After-Tax Net Profit = Gross Revenue – Platform Fee – Operating Expenses – Mortgage Interest – Tax Liability. Result: $335 on $32,850 gross revenue at 60% occupancy.
The full financial breakdown of a $150/night, 60% occupancy property: $32,850 gross revenue narrows to just $335 in after-tax net profit after all costs.
Monthly Cash Flow vs. Annual ROI: Two Different Questions
Monthly cash flow and annual ROI answer different questions, and confusing them leads to bad investment decisions. Monthly cash flow tells you whether the property can service its debt each month without requiring cash injections from your personal account. Annual ROI tells you whether the total return on your invested capital beats alternative investments.
Monthly Cash Flow Formula:
Monthly Cash Flow = (Monthly Gross Revenue × (1 – Platform Fee %)) – Monthly Operating Expenses – Monthly Mortgage Payment
Using the example above: ($2,737.50 × 0.97) – $1,653.75 – $1,597 = -$595.38/month
This negative monthly cash flow means the host must inject $595 from other income sources each month, which is a real liquidity risk.
Cash-on-Cash ROI Formula:
Cash-on-Cash ROI = Annual Pre-Tax Cash Flow ÷ Total Cash Invested
If the host put $60,000 down (20% on a $300,000 property) plus $5,000 in setup costs:
Cash-on-Cash ROI = -$7,144.50 ÷ $65,000 = -10.99%
Total Return ROI adds principal paydown and appreciation:
- Principal paydown (year 1): $2,464
- Assumed appreciation (3% on $300,000): $9,000
- Total return: -$7,144.50 + $2,464 + $9,000 = $4,319.50
- Total Return ROI: $4,319.50 ÷ $65,000 = 6.65%
Always specify which ROI metric you’re using. Cash-on-cash ROI is the most conservative and most relevant for hosts who need the property to be self-funding.
Monthly cash flow and annual ROI tell different stories: this property is cash-flow negative at -$595/month but delivers 6.65% total return when appreciation is included.
Complete Tax Deduction Checklist for Airbnb Hosts
Airbnb hosts who rent their property for more than 14 days per year can deduct ordinary and necessary business expenses against their rental income. The IRS Schedule E is where most of these deductions land, though passive activity loss rules may limit how much you can deduct in a given year if your adjusted gross income exceeds $100,000.
According to IRS Publication 527 (Residential Rental Property), the following deductions apply to short-term rental properties:
| Deduction | Typical Amount | Notes |
|---|---|---|
| Mortgage Interest | $12,000-$20,000/yr | Year 1 is highest |
| Depreciation | $9,000-$12,000/yr | 27.5-year schedule |
| Property Management | 15-25% of revenue | Only if using a manager |
| Cleaning Costs | $50-$150/turnover | Fully deductible |
| Utilities | $1,800-$3,600/yr | Pro-rated for STR use |
| Insurance | $1,200-$2,400/yr | STR policy required |
| Platform Fees | 3% of gross | Deductible as expense |
| Repairs | Actual cost | Not improvements |
| Supplies | Actual cost | Toiletries, linens |
| Marketing | Actual cost | Photography, ads |
Depreciation deserves special attention. The IRS requires residential rental property to be depreciated over 27.5 years using the straight-line method. Source On a $300,000 property with $50,000 allocated to land (non-depreciable), the annual depreciation deduction is $250,000 ÷ 27.5 = $9,090 per year. This is a non-cash deduction, meaning it reduces your taxable income without reducing your bank account.
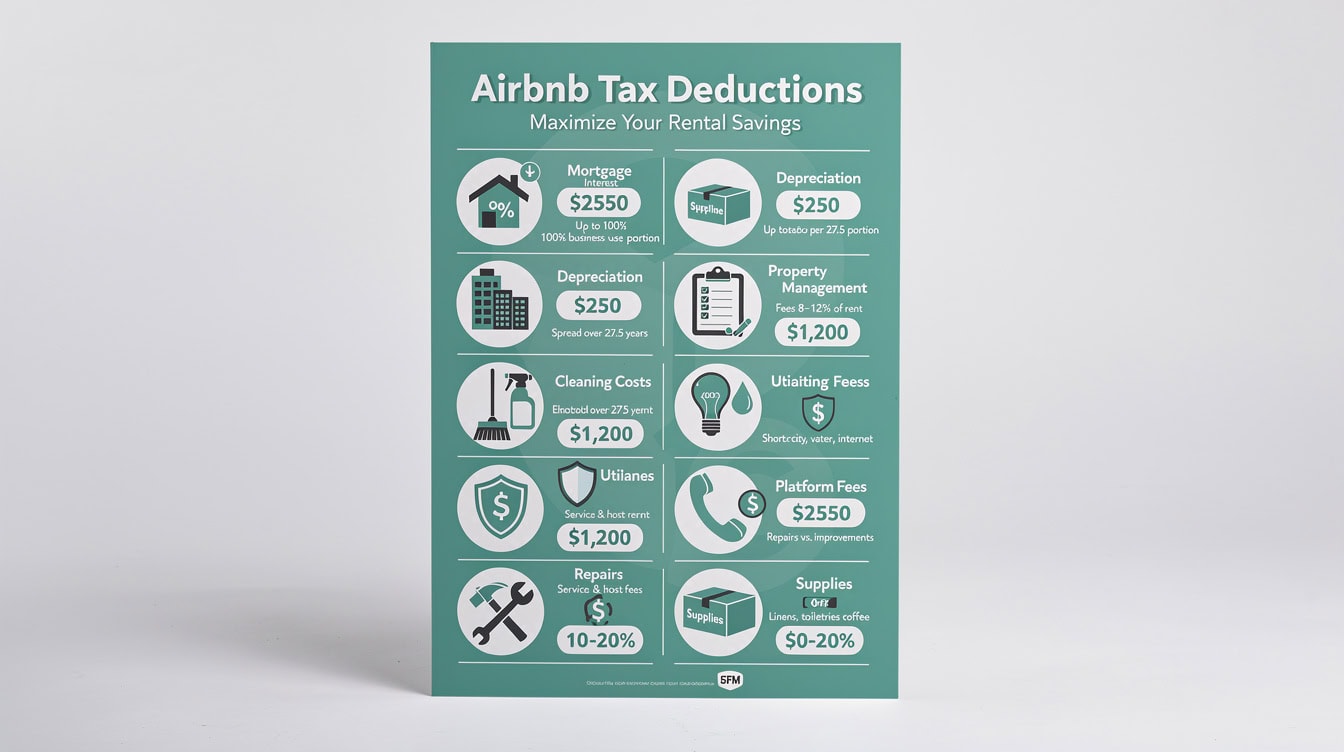
Airbnb hosts can deduct 9 categories of expenses including the often-overlooked $9,090 annual depreciation deduction on a $300,000 property.
Calculating Your Break-Even Occupancy Rate
Break-even occupancy is the minimum percentage of nights you must book to cover all fixed and variable costs without losing money. Every night above break-even generates profit; every night below it generates a loss.
Break-Even Formula:
Break-Even Occupancy % = Total Annual Fixed Costs ÷ (Nightly Rate × 365 × (1 – Variable Cost Rate))
Using the example property:
- Total fixed costs (mortgage + insurance + base utilities): $19,164 + $1,800 + $1,200 = $22,164
- Variable cost rate (platform fee + cleaning per night + management): approximately 38%
- Break-even occupancy = $22,164 ÷ ($150 × 365 × 0.62) = $22,164 ÷ $33,945 = 65.3%
This result is sobering: the property needs 65% occupancy just to break even on a cash basis. At 60% occupancy (the example scenario), the host is cash-flow negative. This is why break-even analysis must precede any purchase decision.
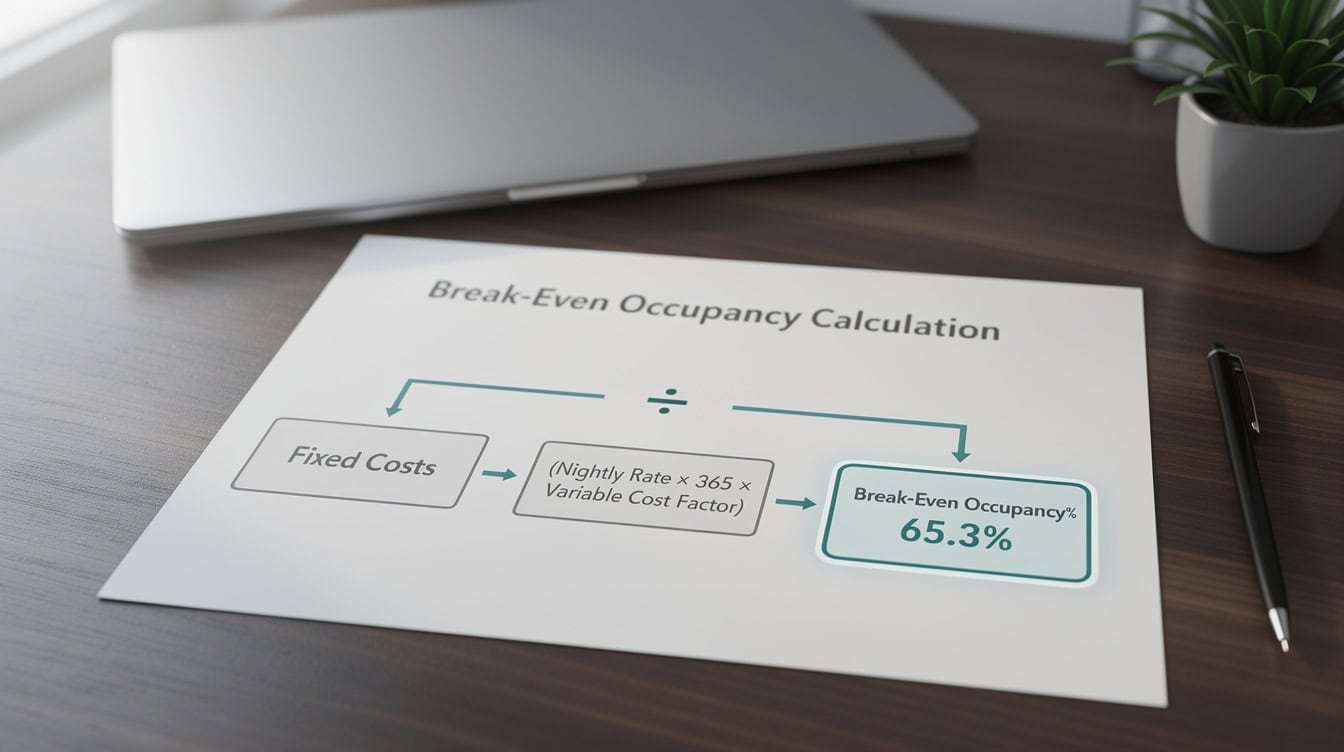
Break-even occupancy of 65.3% means this property needs more than 2 out of every 3 nights booked just to cover fixed costs, before generating any profit.
Occupancy Rate Sensitivity: How Fluctuations Hit Your Bottom Line
Occupancy rate is the single most volatile input in any Airbnb financial model. A 10-percentage-point swing in occupancy changes annual gross revenue by $5,475 on a $150/night property, which can flip a profitable year into a loss year.
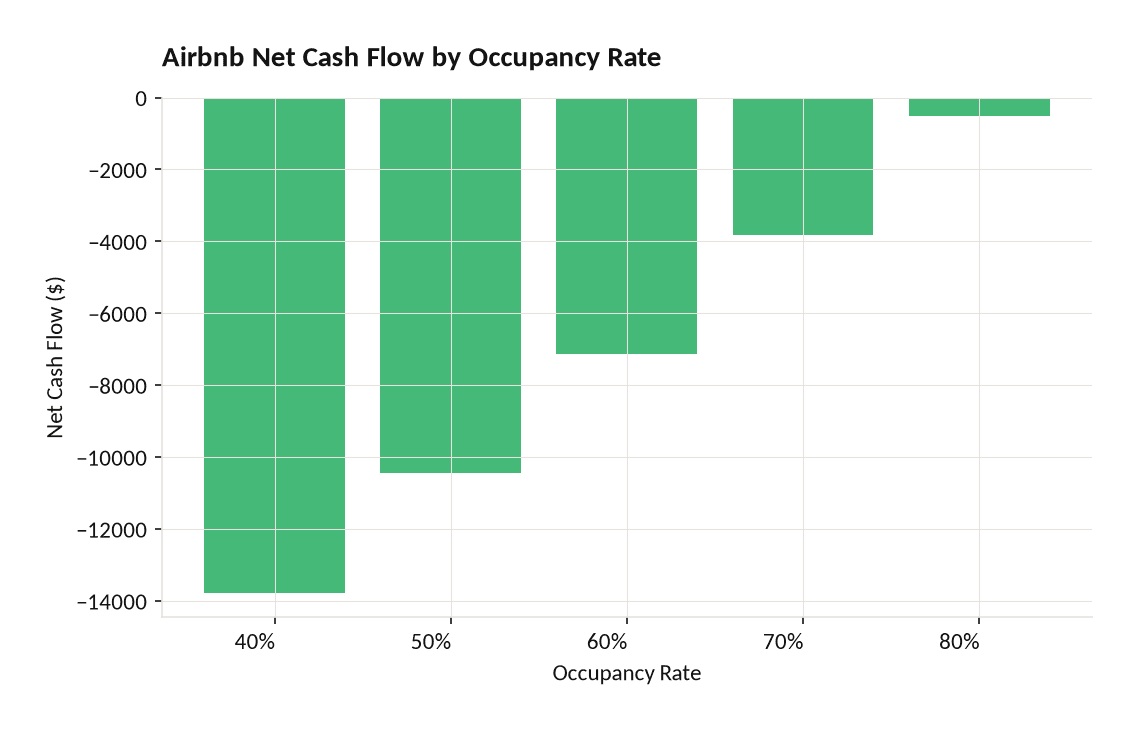
Net cash flow remains negative across all occupancy scenarios for this property, turning positive only above approximately 82% occupancy.
| Occupancy | Gross Revenue | After Platform Fee | Net Cash Flow | Cash-on-Cash ROI |
|---|---|---|---|---|
| 40% | $21,900 | $21,243 | -$13,766 | -21.2% |
| 50% | $27,375 | $26,554 | -$10,455 | -16.1% |
| 60% | $32,850 | $31,864 | -$7,144 | -11.0% |
| 70% | $38,325 | $37,175 | -$3,834 | -5.9% |
| 80% | $43,800 | $42,486 | -$523 | -0.8% |
Note: Net cash flow uses the full expense structure from the worked example. This property requires approximately 82% occupancy to achieve positive cash flow, which is above the realistic ceiling for most U.S. markets. This signals that either the purchase price is too high, the nightly rate needs to increase, or operating costs need to be reduced before the investment makes sense.
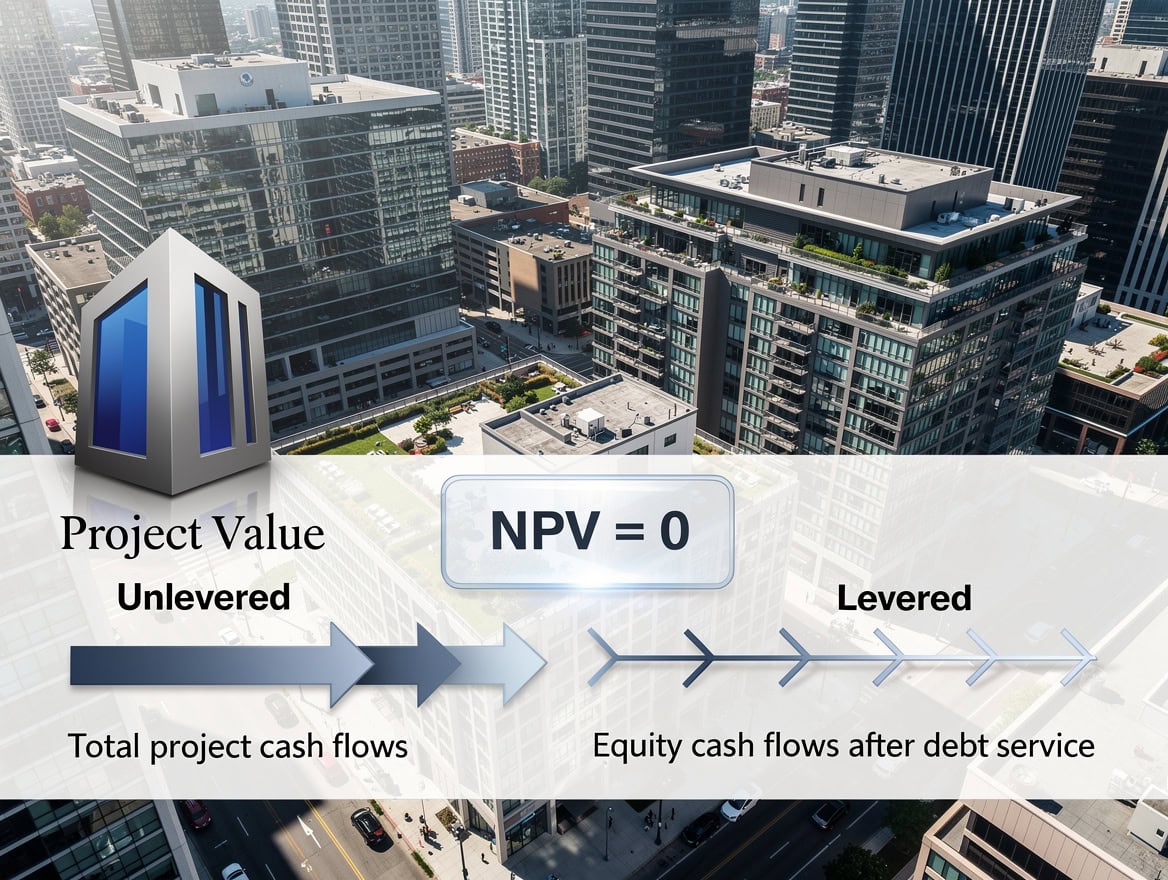
Even at 80% occupancy, this property generates negative cash flow of -$523, highlighting why purchase price and cost structure matter as much as occupancy rate.
Modeling Vacancy Loss Beyond Simple Occupancy Rates
Occupancy rate and vacancy loss are related but distinct concepts. Occupancy rate measures booked nights as a percentage of available nights. Vacancy loss captures the revenue lost to turnover days, deep-cleaning windows, maintenance holds, and seasonal gaps that prevent booking even when demand exists.
For a 2-bedroom property with 219 booked nights at 60% occupancy, a realistic vacancy loss model adds:
- Turnover days between guests (average 0.5 days per booking × 73 bookings): 36.5 days
- Maintenance holds (2 per year × 2 days): 4 days
- Total vacancy loss days: 40.5 days
- Revenue lost: 40.5 × $150 = $6,075
This vacancy loss is separate from the 40% unbooked nights already captured in the 60% occupancy assumption. It represents nights that were theoretically available but practically unavailable. Hosts who ignore this line item overstate their effective revenue by 5-10%.
Using the Airbnb ROI Analyzer Spreadsheet
A purpose-built Airbnb ROI Analyzer spreadsheet eliminates manual calculation errors and lets you run scenarios in seconds. The Airbnb Financial Model available on eFinancialModels includes pre-built tabs for every calculation covered in this article.
The template includes these tabs:
- Input Dashboard: Enter your nightly rate, occupancy assumption, property value, mortgage terms, and tax bracket. All other tabs pull from this single source.
- Monthly Cash Flow: Shows 12-month cash flow with seasonal occupancy adjustments and month-by-month expense tracking.
- Annual ROI: Calculates cash-on-cash ROI, total return ROI, and cap rate (net operating income divided by property value, expressed as a percentage) side by side.
- Tax Deductions: Itemizes every deductible expense with IRS code references and calculates your estimated tax liability before and after deductions.
- Scenario Comparison: Runs best-case (80% occupancy), realistic (60%), and worst-case (40%) scenarios simultaneously.
- Break-Even Analysis: Calculates your break-even occupancy rate dynamically as you change inputs.
You can also explore the Cash Flow Dashboard Spreadsheet for a broader property cash flow tracking tool, and the Profit and Loss Statement Actual vs Budget template to compare your actual monthly results against your projections.
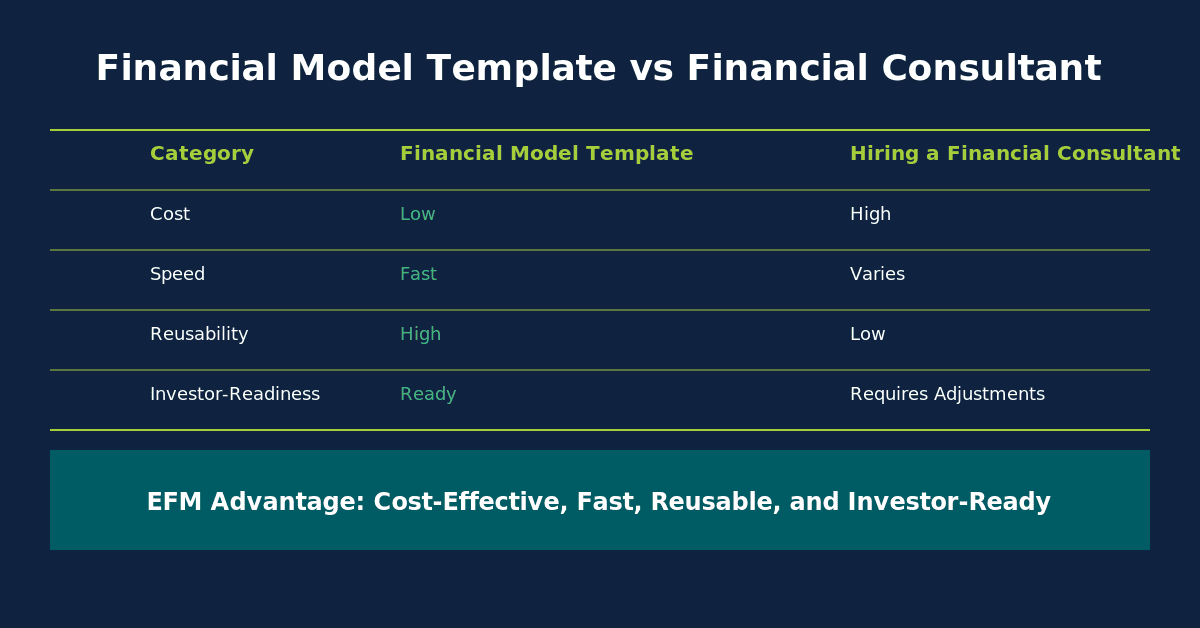
The Airbnb ROI Analyzer template organizes all calculations across six dedicated tabs, with a single Input Dashboard feeding every formula automatically.
Common Profit Calculation Mistakes Hosts Make
Five specific mistakes account for the majority of Airbnb financial planning failures.
Mistake 1: Using gross revenue as profit. Gross revenue minus nothing is not profit. Always subtract platform fees, operating expenses, mortgage payments, and taxes before calling a number profit. Fix: Build a full income statement, not just a revenue projection.
Mistake 2: Ignoring the mortgage principal vs. interest split. Principal repayment is not a tax-deductible expense; it’s equity building. Only the interest portion is deductible. Hosts who deduct the full mortgage payment overstate their deductions and understate their taxable income. Fix: Use an amortization schedule to separate P and I each year.
Mistake 3: Assuming 70%+ occupancy without market data. Urban markets in major cities may support 65-75% occupancy for well-reviewed listings, but suburban and secondary markets often average 45-55%. Fix: Check local STR data from your city’s tourism board or STR market reports before projecting occupancy.
Mistake 4: Forgetting the 3% Airbnb host fee. Airbnb deducts its host service fee before paying out. A $150/night booking nets $145.50 to the host. Over 219 nights, that’s $985.50 in fees that many hosts never account for. Fix: Apply the 3% fee to gross revenue as the first deduction in your model.
Mistake 5: Treating all repairs as deductible expenses. The IRS distinguishes between repairs (deductible in the year incurred) and improvements (capitalized and depreciated). Replacing a broken faucet is a repair. Replacing the entire kitchen is an improvement. Fix: Consult IRS Publication 527 or a tax professional to classify capital expenditures correctly. Under IRS rules, improvements to residential rental property must be depreciated over 27.5 years Source rather than expensed immediately, which significantly affects your year-one tax deduction.
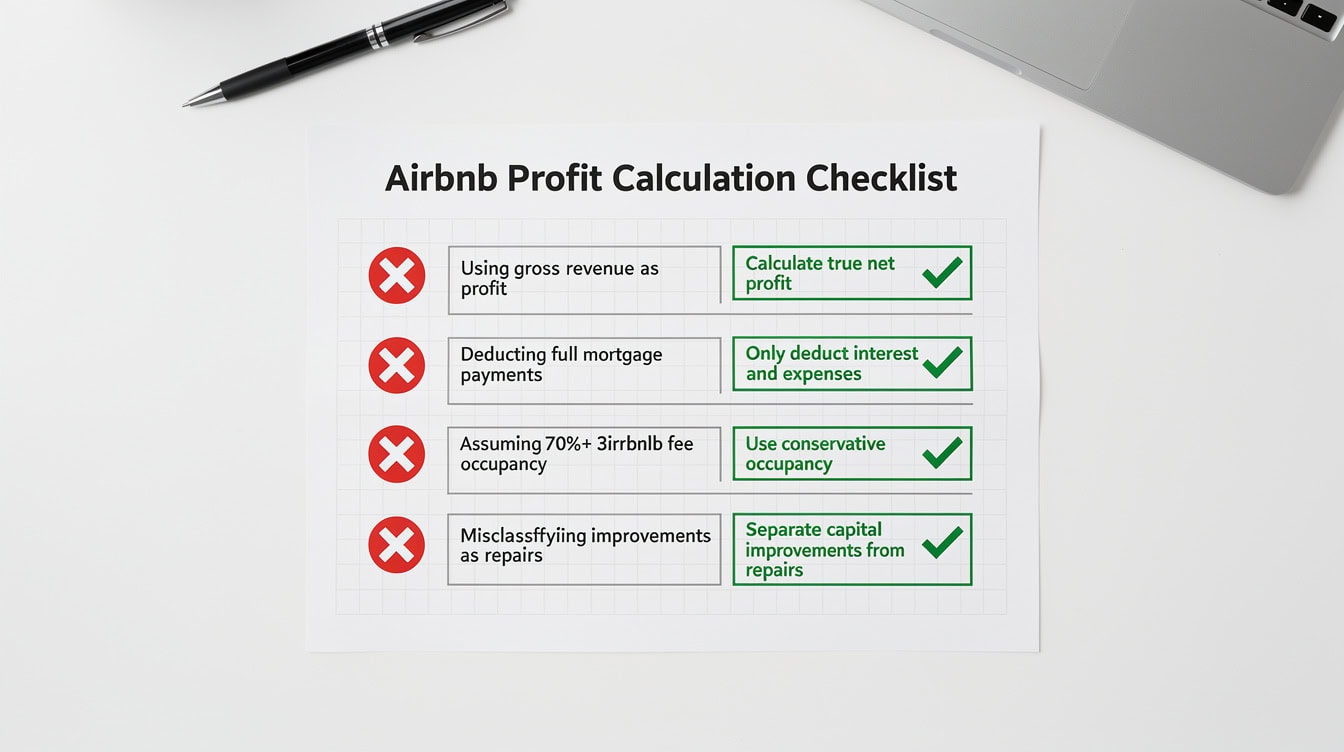
Five calculation mistakes that turn profitable-looking Airbnb investments into cash-flow losses, each with a specific fix hosts can apply immediately.
Scenario Planning: Best Case, Realistic, and Worst Case
Scenario planning protects you from single-point-of-failure financial models. Every Airbnb investment should be stress-tested against at least three scenarios before you commit capital.
| Scenario | Occupancy | Gross Revenue | Net Cash Flow | Verdict |
|---|---|---|---|---|
| Best Case | 80% | $43,800 | -$523 | Nearly break-even |
| Realistic | 60% | $32,850 | -$7,144 | Cash-flow negative |
| Worst Case | 40% | $21,900 | -$13,766 | Significant loss |
For this specific property at these cost levels, even the best-case scenario produces negative cash flow. That’s a signal to renegotiate the purchase price, increase the nightly rate, reduce operating costs, or walk away from the deal. Scenario planning surfaces this reality before you sign a contract, not after.
The Dynamic Profit and Loss Comparison template lets you run these three scenarios side by side with a single set of inputs, making the comparison visual and immediate.

Scenario planning across three occupancy assumptions reveals that this property produces negative cash flow in all scenarios, signaling a need to renegotiate price or increase rates.
Frequently Asked Questions
What is the Airbnb host service fee and how does it affect my profit?
Airbnb charges hosts a service fee of 3% of the booking subtotal (nightly rate plus cleaning fee, minus Airbnb fees) for most listings. This fee is deducted automatically before Airbnb pays you. On a $150/night booking, you receive $145.50. Over a full year at 60% occupancy with 219 booked nights, that 3% fee totals $985.50 in lost revenue. The fee is tax-deductible as a business expense, which partially offsets the cost. Hosts using the Plus or Luxe programs may face different fee structures, so always verify your specific fee tier in your Airbnb host dashboard before building your financial model.
How do I calculate break-even occupancy for my Airbnb property?
Break-even occupancy is calculated by dividing your total annual fixed costs by the product of your nightly rate, 365 days, and one minus your variable cost rate. For example, if your fixed costs are $22,164 per year, your nightly rate is $150, and your variable costs consume 38% of each booking, your break-even is $22,164 divided by ($150 × 365 × 0.62), which equals 65.3%. This means you need to book 65.3% of available nights just to cover costs. Any occupancy below that threshold produces a cash loss. Running this calculation before purchasing a property tells you whether the investment is viable at realistic market occupancy rates.
What is the difference between cash-on-cash ROI and total return ROI for Airbnb?
Cash-on-cash ROI measures annual pre-tax cash flow divided by total cash invested (down payment plus setup costs). It tells you how much cash the property generates relative to what you put in, ignoring appreciation and principal paydown. Total return ROI adds mortgage principal paydown and property appreciation to the numerator. For the worked example, cash-on-cash ROI is -10.99% (negative cash flow) while total return ROI is 6.65% once appreciation and equity building are included. Cash-on-cash ROI is the more conservative and liquidity-relevant metric. If you need the property to fund itself month to month, cash-on-cash is the number that matters.
How does depreciation reduce my Airbnb tax bill?
Depreciation is a non-cash deduction that reduces your taxable rental income without reducing your bank account. The IRS requires residential rental property to be depreciated over 27.5 years using straight-line depreciation. On a $300,000 property with $50,000 allocated to non-depreciable land, the annual depreciation deduction is $250,000 divided by 27.5, which equals $9,090 per year. At a 22% tax bracket, that deduction saves approximately $2,000 in taxes annually. However, when you sell the property, the IRS recaptures depreciation at a 25% rate, so the tax benefit is deferred rather than permanent. A tax professional can help you plan for depreciation recapture.
What property management fee should I budget for Airbnb?
Short-term rental property management fees typically range from 15% to 25% of gross revenue, compared to 8-12% for long-term rentals. The higher rate reflects the additional work involved in guest communication, check-in coordination, cleaning oversight, and dynamic pricing management. On a property generating $32,850 in gross revenue, a 20% management fee costs $6,570 per year. Self-managing eliminates this cost but requires significant time investment, typically 5-10 hours per week for a single property. If your time has economic value, factor in the opportunity cost of self-management before deciding to skip professional management to save money.
Can I deduct my mortgage payment from Airbnb income on my taxes?
You cannot deduct the full mortgage payment. Only the interest portion of your mortgage payment is tax-deductible as a rental expense. The principal portion is not deductible because it builds equity in the property. In year one of a $240,000 mortgage at 7% interest, approximately $16,700 of your $19,164 annual payment is interest, and $2,464 is principal. As the loan amortizes, the interest portion decreases each year and the principal portion increases. Use an amortization schedule to find the exact split for each tax year. Deducting the full mortgage payment is a common audit trigger and a factual error that can result in penalties.
How does my tax bracket affect Airbnb after-tax profit?
Your marginal tax bracket directly determines how much of your pre-tax Airbnb profit you keep. A host in the 22% federal bracket keeps $0.78 of every taxable dollar. A host in the 32% bracket keeps $0.68. On $10,000 of pre-tax profit, that difference is $1,000 per year. State income taxes add another layer: states like California tax rental income at rates up to 13.3%, while states like Texas and Florida have no state income tax. The combination of federal and state taxes means high-income hosts in high-tax states may keep less than 55 cents of every pre-tax dollar. Always model after-tax profit using your combined marginal rate, not just the federal rate.
Conclusion
The gap between gross Airbnb revenue and after-tax net profit is real, significant, and predictable if you build the right model. The worked example in this article shows a property generating $32,850 in gross revenue that produces negative monthly cash flow at 60% occupancy once mortgage, fees, and taxes are properly accounted for. That’s not a reason to avoid Airbnb investing; it’s a reason to model it correctly before committing capital.
I recommend downloading the Airbnb Financial Model from eFinancialModels, which includes all six tabs described in this article: Input Dashboard, Monthly Cash Flow, Annual ROI, Tax Deductions, Scenario Comparison, and Break-Even Analysis. Enter your actual numbers, run all three scenarios, and let the math tell you whether the investment makes sense before you sign anything.