
0 ITEMS

Independent Retail Pharmacy Acquisition & SBA Underwriting Financial Model
Underwrite the purchase of an independent retail pharmacy the way a lender will: prescription-level gross profit split generic vs brand, a PBM reimbursement reconciliation, an owner-pharmacist add-back, a full SBA 7(a) capital stack and a DSCR gate. Shows the industry 20%-of-sales asking price beside the cash-flow price, and three DSCRs.
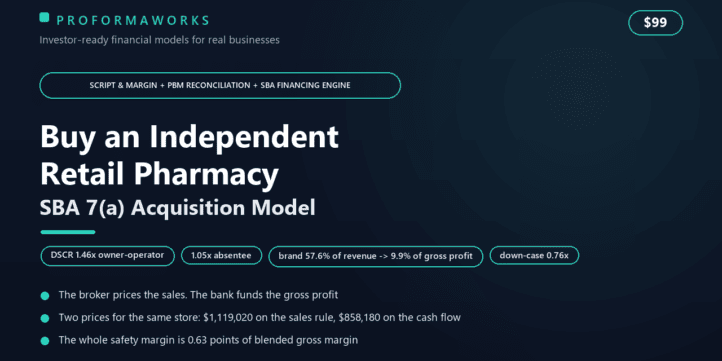

Brand drugs are 57.6% of this pharmacy’s sales and 9.9% of its gross profit. The asking price is a percentage of the first number. The loan is repaid out of the second.
The pharmacy trade prices a store on a percentage of annual sales – 15% to 25%, quoted by every specialist broker and every free valuation calculator. That rule was never a valuation method. A brand prescription bills roughly eleven times what a generic bills and returns about a twelfth of the margin rate, and roughly 60% of retail revenue growth over the last five years came from GLP-1 medicines, which most independent pharmacies dispense at a loss. Price on sales and you pay a multiple on dollars that never reach the bank.
This model underwrites the purchase of a single independent retail pharmacy the way an SBA 7(a) lender will. It is not a startup forecast and not an operating projection: it is an acquisition underwrite, built for the pharmacist buying the store he or she works in, for a searcher, or for a small multi-store operator adding a location.
The script-mix gross-profit engine. Revenue is built from prescription count, not typed in. 65,000 scripts a year at an 84% generic dispensing rate split into 54,600 generic and 10,400 brand, each line carrying its own revenue per script and its own gross margin: generic at $28.50 and 42.7%, brand at $310.00 and 3.5%. Front-end retail, compounding and clinical services are separate lines with their own margins. The result: $5,595,100 of sales becomes $1,140,995 of gross profit, and you can see exactly which line produced it. After an explicit PBM effective-rate and DIR reconciliation of $35,851, net gross profit is $1,105,144 – 19.75% of sales, or $11.96 per prescription.
Two prices, side by side. The 20%-of-sales convention implies $1,119,020. The cash-flow price at 2.25x SDE is $858,180. Overpay avoided: $260,840, or 30.4%. And at the sales-based price the DSCR lands at 1.23x – below the 1.25x floor, declined. Across the three profiles the same rule overprices a brand-heavy volume store by $523,495 and underprices a compounding pharmacy by $69,516. It errs in both directions.
Three DSCRs, because the pharmacist is a legal precondition. A pharmacy cannot dispense without a licensed pharmacist present, so the owner’s labour cannot be assumed away. The model computes 2.23x naive (the broker’s SDE, owner free), 1.46x owner-operator (you behind the counter on a declared draw) and 1.05x absentee (a market pharmacist-in-charge hired at $189,174 – and that one fails). If you are not going to stand behind the counter, the absentee ratio is the only one your lender should see.
The coverage split and the down-case. Generic gross profit covers the debt service 3.88x; brand gross profit covers it 0.66x. The down-case runs two documented mechanisms – reimbursement compression and a network exclusion – and drives coverage to 0.76x. Break-even blended gross margin is 19.76% against an actual 20.39%: a cushion of 0.63 points of margin, with one point of gross margin worth 0.33x of DSCR.
The debt that earns nothing. Inventory sits at cost above the price by universal convention ($387,314), and the working capital bridging the PBM payment lag sits above that. Together they are 39% of the $1,455,529 project: debt service on assets that produce no gross profit. The SBA 7(a) stack is $1,091,647 at 75% leverage over ten years, with a full-standby versus amortizing seller-note toggle as a DSCR lever.
Honest by design. NCPA publishes revenue and script counts per store but not the 2024 gross margin, gross profit per script or owner’s discretionary profit; those and several cost inputs are declared model inputs with reference bands, not statistics. SBA 7(a) loan volume is not published separately for pharmacy, so none is claimed. The base case is deliberately calibrated above the industry-median margin, and the model shows what happens to a median store on the same deal: DSCR 0.60x. There is no live IRR by design, and the 5-year MOIC of 3.15x is flagged as leverage-amplified. Educational planning tool – not financial, lending, legal or medical advice.
Inside: Excel model, 11 sheets, Google Sheets compatible with no macros or add-ins; a 25-page PDF guide with sources; every assumption editable and highlighted.
Similar ProductsOther customers were also interested in...



 eFinancialModels
Electric Vehicle (EV) Charging Station Financial M...
With this comprehensive 5- or 10-year monthly tool, investors can assess the viability of setting up... Read more

Financial Model for Mobile App | Mobile App Busine...
The Mobile App Financial Plan Template in Excel allows you to develop financial projections when lau... Read more

 HenrySheykin
Food Truck Financial Model Excel Template
The Food Truck Financial Model helps entrepreneurs, founders, business owners, consultants, and anal... Read more

Green Hydrogen Production from Wind Energy Financi...
The Green Hydrogen from Wind Financial Model aims to comprehensively forecast a horizon of 40 years ... Read more

Simple Mutual Non-Disclosure Agreement Template
Protect your business secrets with ease using our Simple Mutual Non-Disclosure Agreement Template. S... Read more

Solar Energy Financial Model
The Solar Energy Financial Model Spreadsheet Template in Excel assists you in preparing a sophistica... Read more

 Peter Graf
The Customer-Centric Financial Model for Restauran...
Starting a restaurant without a financial plan is like driving a car blindfolded. You wouldn´t do i... Read more
You must log in to submit a review.