
0 ITEMS

Cap Table & Dilution: Formulas, Benchmarks, Examples

Key Takeaways
- Founders typically give up 15% to 25% of their company in their first priced equity round, according to Rebel Fund’s analysis of thousands of VC deals.
- Dilution percentage = new shares issued divided by total post-money shares. Every round shrinks your slice, but a smaller slice of a larger pie can still mean more dollars at exit.
- Seed rounds dilute founders by 10% to 20%, Series A by roughly 20%, Series B by 15% to 20%, and Series C by 10% to 15%.
- A standard 10% employee option pool created before a priced round dilutes founders, not investors, because it is carved out of the pre-money valuation.
- Anti-dilution provisions (weighted average vs. full ratchet) protect investors in down rounds and can dramatically reduce founder ownership if triggered.
- Modeling dilution before you sign a term sheet is the single most powerful thing a founder can do to protect long-term equity value.
- Founders who reach Series A while retaining 50% or more of fully diluted equity are in a strong negotiating position for later rounds.
What Is a Cap Table and Why It Matters
A capitalization table, or cap table, is a spreadsheet that records every equity owner in a company: who owns what, in which share class, and at what percentage of the fully diluted total. It is the single source of truth for ownership, and every funding round, option grant, and convertible instrument changes it.
A complete cap table tracks four core components:
- Shareholders: founders, investors, employees, advisors, and any other equity holders.
- Share classes: common stock (typically held by founders and employees), preferred stock (typically held by investors), and options or warrants not yet exercised.
- Ownership percentages: each holder’s shares divided by total fully diluted shares outstanding.
- Option pool: a reserved block of shares set aside for future employee grants, usually 10% to 20% of fully diluted equity.
Why does it matter? Investors review the cap table before writing a check. A messy or over-diluted cap table signals poor governance and can kill a deal. Founders who don’t model their cap table before raising often discover, too late, that they own less than 10% of their company by Series B. You can explore the mechanics of building one in our guide on how to build a capitalization table.

Every cap table tracks four components. Missing any one of them produces an inaccurate picture of ownership.
Understanding Dilution: Mechanics and Core Formulas
Dilution occurs when a company issues new shares, reducing each existing shareholder’s ownership percentage. The math is straightforward: your percentage after a round equals your existing shares divided by the new, larger total of shares outstanding.
Core formula:
Post-round ownership (%) = Existing shares / (Existing shares + New shares issued)
To find the dilution percentage itself:
Dilution (%) = New shares issued / (Existing shares + New shares issued)
Or equivalently:
Dilution (%) = Investment amount / Post-money valuation
Pre-money vs. post-money valuation (two terms every founder must know):
- Pre-money valuation: the agreed value of the company before new investment arrives.
- Post-money valuation: pre-money valuation plus the new investment. This is the denominator investors use to calculate their ownership stake.
Example: if your pre-money valuation is $8 million and an investor puts in $2 million, your post-money valuation is $10 million. The investor owns $2M / $10M = 20% of the company.
Convertible notes and SAFEs (Simple Agreements for Future Equity) delay this math. They convert into equity at a future priced round, usually at a discount (typically 15% to 20%) or subject to a valuation cap. Founders often underestimate the dilution from these instruments because the share count isn’t fixed until conversion. Microsoft Excel supports up to 64 levels of nested functions (Microsoft), which matters when building complex cap table models with multiple conditional scenarios stacked inside one another.

Post-money valuation is the denominator investors use to calculate their ownership stake. Getting this number right is the foundation of every dilution calculation.
Dilution Benchmarks by Funding Stage
Knowing typical dilution ranges by stage gives founders a negotiating anchor. Accepting more dilution than the market norm at any stage compounds painfully across subsequent rounds.
Typical seed-round dilution is around 10% to 20% of equity (Alejandro Cremades, 2023). Analysis of thousands of venture capital rounds shows that founders typically give up between 15% and 25% in their first priced equity round. Typical Series A dilution is around 20% of equity, Series B runs 15% to 20%, and Series C narrows to 10% to 15% (Alejandro Cremades, 2023).
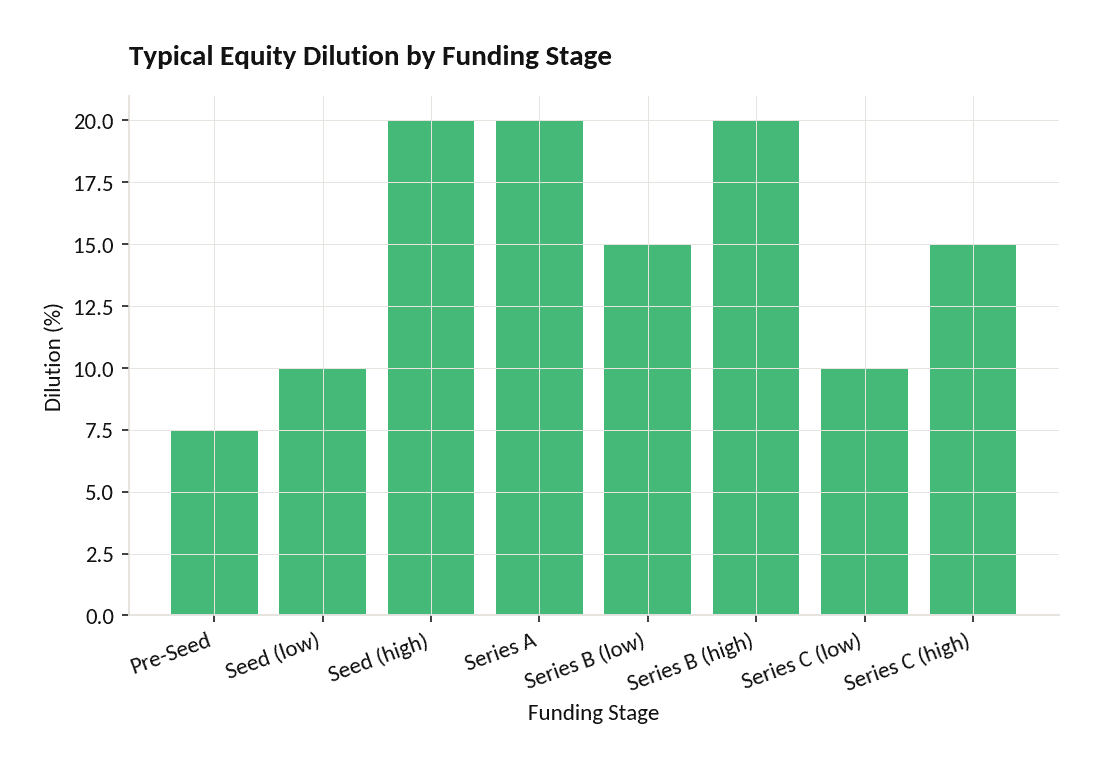
Dilution benchmarks by stage. Seed rounds carry the widest range (10-25%); Series C narrows to 10-15% as valuations mature. Sources: Rebel Fund (2025), Cremades (2023).
| Funding Stage | Typical Dilution Range | Notes |
|---|---|---|
| Pre-Seed / Friends & Family | 5% to 10% | Often via SAFEs or convertible notes |
| Seed | 10% to 20% | First priced round often 15% to 25% |
| Series A | ~20% | Institutional lead investor sets terms |
| Series B | 15% to 20% | Growth capital; option pool refresh common |
| Series C | 10% to 15% | Later-stage; higher valuations compress dilution |
| Employee Option Pool | 10% to 20% | Created pre-round; dilutes founders, not investors |
The key insight: dilution percentages shrink at later stages not because investors become more generous, but because valuations grow faster than check sizes. A 15% Series C stake on a $200M pre-money valuation is a $30M investment, which is a large check by any measure.

Dilution percentages compress at later stages as valuations grow faster than check sizes. Series C investors often accept 10-15% for large investments.
How Employee Option Pools Dilute Founders
Employee option pools are blocks of shares reserved for future grants to employees, advisors, and consultants. They dilute founders, not investors, because investors insist the pool be created before the round closes, inside the pre-money valuation.
A standard equity vesting structure is a 4-year schedule with a 1-year cliff (The VC Corner, 2024). This means an employee earns nothing for the first 12 months, then 25% vests at the cliff, and the remaining 75% vests monthly over the following 36 months. When modeling these vesting schedules in Excel, it is worth noting that a single worksheet can contain up to 1,048,576 rows (Microsoft), giving founders ample room to track every grant and vesting event across hundreds of employees without splitting data across multiple sheets.
How the pool shuffle works:
Suppose your company has 10 million shares outstanding and an investor agrees to a $10M pre-money valuation. The investor requires a 10% option pool be created first. Here’s what happens:
- You create 1,111,111 new shares for the option pool (10% of the new total of 11,111,111 shares).
- The investor then calculates their stake based on the $10M pre-money on 11,111,111 shares.
- Founders absorb the full dilution from the pool before the investor’s money even arrives.
Option pools are typically refreshed at later rounds, often expanding to 10% to 15% of fully diluted equity to accommodate hiring plans. Each refresh dilutes all existing shareholders proportionally, but founders feel it most acutely in early stages when their percentage is highest.
For a deeper look at how equity structures interact with venture capital financing, the mechanics above apply across virtually every institutional deal.

The option pool shuffle: investors require the pool be created inside the pre-money valuation, so founders absorb all the dilution before the check arrives.
Step-by-Step Cap Table Modeling Example
The best way to understand dilution is to run the numbers yourself. Below is a worked example starting from founding through Series A.
Starting point: Two founders, no outside capital
- Founder A: 5,000,000 shares (50%)
- Founder B: 5,000,000 shares (50%)
- Total shares: 10,000,000
Round 1: Seed round
- Pre-money valuation: $4,000,000
- Investment: $1,000,000
- Post-money valuation: $5,000,000
- Investor ownership: $1,000,000 / $5,000,000 = 20%
- New shares issued: 10,000,000 × (20% / 80%) = 2,500,000
- Total shares post-seed: 12,500,000
Post-seed ownership:
- Founder A: 5,000,000 / 12,500,000 = 40%
- Founder B: 5,000,000 / 12,500,000 = 40%
- Seed investor: 2,500,000 / 12,500,000 = 20%
Option pool creation before Series A
- Investor requires a 10% option pool on a fully diluted basis.
- New option pool shares: 12,500,000 × (10% / 90%) = 1,388,889
- Total shares pre-Series A: 13,888,889
Round 2: Series A
- Pre-money valuation: $12,000,000 (on 13,888,889 shares)
- Investment: $3,000,000
- Post-money valuation: $15,000,000
- Series A investor ownership: $3,000,000 / $15,000,000 = 20%
- New shares issued: 13,888,889 × (20% / 80%) = 3,472,222
- Total shares post-Series A: 17,361,111
Post-Series A ownership:
- Founder A: 5,000,000 / 17,361,111 = 28.8%
- Founder B: 5,000,000 / 17,361,111 = 28.8%
- Seed investor: 2,500,000 / 17,361,111 = 14.4%
- Option pool: 1,388,889 / 17,361,111 = 8.0%
- Series A investor: 3,472,222 / 17,361,111 = 20.0%
Here’s the key insight from these numbers: each founder started at 50% and now holds 28.8% after two rounds and an option pool. That’s a 42% reduction in percentage ownership. But the company’s post-money valuation grew from $0 to $15,000,000. If the company exits at $60,000,000, each founder’s 28.8% stake is worth $17,280,000, far more than 50% of a company worth $0.
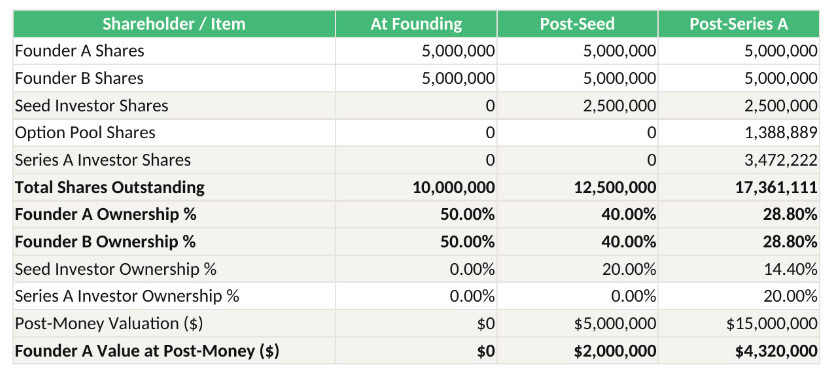
Cap table dilution from founding through Series A. Founder A and B each drop from 50% to 28.8% after a $1M seed round, 10% option pool, and $3M Series A.
After two rounds and a 10% option pool, each founder holds 28.8% — down from 50%. The company’s $15M post-money valuation makes that stake worth $4.3M.
Anti-Dilution Provisions and Down Round Protection
Anti-dilution provisions protect preferred stockholders (investors) when a company raises money at a lower valuation than a previous round, known as a down round. They adjust the conversion ratio of preferred shares to common shares, effectively giving investors more shares and diluting founders further.
Two main types exist:
1. Full ratchet anti-dilution: the investor’s conversion price resets to the new, lower price per share. This is the most aggressive form and can devastate founder ownership in a down round. If an investor paid $2.00 per share in Series A and the Series B prices shares at $1.00, the Series A investor’s shares convert as if they had paid $1.00, doubling their share count.
2. Weighted average anti-dilution: the conversion price adjusts based on a formula that accounts for both the new price and the number of new shares issued. This is far more common and more founder-friendly.
Weighted average formula (broad-based):
New conversion price = Old conversion price × (Old shares + Shares issuable at old price) / (Old shares + New shares actually issued)
Most institutional term sheets use broad-based weighted average anti-dilution, which includes all fully diluted shares in the denominator. Narrow-based weighted average uses only outstanding shares, which is more protective for investors.
Pro rata rights give existing investors the right to participate in future rounds to maintain their ownership percentage. These rights don’t prevent dilution but allow investors to buy enough new shares to stay flat.
For a full breakdown of how WACC and return on invested capital interact with equity structure decisions, those metrics become especially relevant when modeling down-round scenarios.

Full ratchet anti-dilution resets the conversion price to the new low, doubling investor shares. Weighted average is far more founder-friendly and is the market standard.
Common Dilution Mistakes and How to Avoid Them
Most dilution damage is self-inflicted. These are the 5 mistakes founders make most often, and the fix for each.
Mistake 1: Raising too much too early. A larger check at a low valuation means more dilution. Raising $3M at a $6M pre-money (33% dilution) is far more expensive than raising $1.5M at a $6M pre-money (20% dilution) and returning for more once you’ve hit milestones. Fix: raise the minimum needed to reach your next valuation inflection point.
Mistake 2: Ignoring option pool expansion. Founders often negotiate the pre-money valuation but forget that a larger option pool requirement has the same economic effect as a lower valuation. Fix: model the fully diluted cap table including the option pool before agreeing to any valuation.
Mistake 3: Accepting full ratchet anti-dilution. Full ratchet provisions are rare in modern term sheets but still appear in bridge rounds and down rounds. Fix: push for broad-based weighted average anti-dilution as a non-negotiable term.
Mistake 4: Not modeling convertible note conversion. SAFEs and convertible notes with low valuation caps can convert into surprisingly large ownership stakes at a priced round. Fix: model every outstanding convertible instrument at multiple conversion scenarios before closing a priced round.
Mistake 5: Failing to track fully diluted shares. Founders sometimes track only issued shares and forget about the option pool, warrants, and unconverted notes. Fix: always calculate ownership on a fully diluted basis, including all reserved but unissued shares. A single Excel workbook can hold up to 255 sheets (Microsoft), so there is no practical reason to maintain separate files for each funding scenario — keep every round’s fully diluted share count in one consolidated workbook for easy cross-scenario comparison.

Most dilution damage is self-inflicted. Modeling your cap table before every round eliminates the five most common mistakes.
Building Your Own Dilution Forecast Model
A dilution forecast model projects your ownership percentage through multiple funding rounds and to a potential exit. You need five inputs per round: pre-money valuation, investment amount, option pool size (as a percentage of post-money), any convertible instruments converting in the round, and the number of new shares issued.
Key assumptions to track:
- Current fully diluted share count (including all options, warrants, and convertible instruments)
- Pre-money valuation for each projected round
- Investment amount per round
- Option pool percentage required by investors
- Conversion terms for any outstanding SAFEs or notes
Excel formulas for a dilution model:
- Post-Money Valuation = Pre-Money Valuation + Investment
- Investor Ownership % = Investment / Post-Money
- New Shares to Issue = Existing Shares × (Investor Ownership % ÷ (1 – Investor Ownership %))
- Post-Round Founder Ownership % = Founder Shares / (Existing Shares + New Shares + Option Pool Shares)
- Fully Diluted Shares = Common Shares + Preferred Shares (as Converted) + Options Outstanding + Warrants
A well-built model also projects the dollar value of your ownership at exit. If you own 22% of a company that exits at $80M, your pre-tax proceeds are $17.6M. But liquidation preferences (the right of preferred stockholders to receive their investment back before common stockholders get anything) can reduce that number significantly in a modest exit. Modeling liquidation waterfalls is the next layer of sophistication beyond basic dilution tracking.
You can use our cap table template or the transactional financial model with cap table included to build this forecast without starting from scratch.

A dilution forecast model needs five inputs per round: pre-money valuation, investment amount, option pool size, convertible instruments, and new shares issued.
Frequently Asked Questions
What is a cap table in simple terms?
A cap table is a spreadsheet that lists every person or entity that owns equity in your company, how many shares they hold, what class of shares those are, and what percentage of the total company they represent. Think of it as the ownership ledger for your startup. It changes every time you issue new shares, grant options, or convert a note into equity. Investors, lawyers, and acquirers all request the cap table during due diligence. A clean, accurate cap table signals good governance. A messy one with unexplained gaps or missing option grants can delay or kill a financing round. Most early-stage companies maintain their cap table in Excel or a dedicated platform like Carta.
How do I calculate dilution from a funding round?
Dilution equals the new shares issued divided by the total shares outstanding after the round. Here’s the math for a concrete example: you have 10,000,000 shares outstanding. An investor puts in $2,000,000 at a $8,000,000 pre-money valuation, giving a $10,000,000 post-money valuation. The investor owns 20% ($2M / $10M). New shares issued = 10,000,000 × (0.20 / 0.80) = 2,500,000. Your dilution is 2,500,000 / 12,500,000 = 20%. Your existing ownership percentage drops by exactly that 20% dilution factor: if you owned 100% before, you now own 80%. If you owned 50%, you now own 40%.
What percentage of equity should founders retain through Series A?
Most experienced investors and advisors suggest founders should aim to retain at least 50% combined ownership through Series A, though this varies by deal structure and how much capital was raised pre-Series A. Founders who have taken a seed round at 15% to 20% dilution and then a Series A at 20% dilution, plus a 10% option pool, will typically find themselves at 45% to 55% combined founder ownership post-Series A. Retaining above 50% combined gives founders majority voting control on most matters and preserves negotiating leverage for Series B. Below 20% combined, founders may struggle to attract top talent who want to see founders still meaningfully invested in the outcome.
What is the difference between weighted average and full ratchet anti-dilution?
Both are mechanisms that protect investors when a company raises money at a lower valuation than a previous round. Full ratchet resets the investor’s conversion price to the new lower price, regardless of how many shares are issued at that price. This is the most aggressive form and can dramatically increase an investor’s share count at the founder’s expense. Weighted average anti-dilution adjusts the conversion price using a formula that accounts for both the new price and the volume of shares issued at that price. Broad-based weighted average is the most common and most founder-friendly version. For example, if a Series A investor paid $2.00 per share and a down round prices shares at $1.50, a weighted average adjustment might reset their conversion price to $1.80 rather than $1.50, limiting the dilutive impact on founders.
How does an employee option pool affect my ownership before a funding round?
Investors typically require that the option pool be created or topped up before the round closes, inside the pre-money valuation. This means the dilution from the option pool comes entirely from existing shareholders, primarily founders. Here’s the practical impact: if your company is valued at $10M pre-money and the investor requires a 10% option pool, you must create those shares before the investor calculates their stake. If you had 10,000,000 shares, you now have 11,111,111 shares (to make the pool exactly 10% of the new total). The investor’s 20% stake is then calculated on top of that larger base. Founders absorb the full pool dilution before the investor’s money arrives. Always model the option pool as part of your pre-round dilution calculation, not as a separate event.
What is a SAFE and how does it create dilution?
A SAFE (Simple Agreement for Future Equity) is a contractual right to receive equity in a future priced round. It is not a loan and does not accrue interest. SAFEs typically include a valuation cap (the maximum valuation at which the SAFE converts) and sometimes a discount rate (typically 15% to 20% off the priced round’s share price). Dilution from SAFEs is invisible until conversion: the SAFE holder receives shares at the priced round, often at a lower price per share than new investors, which means they receive more shares for the same dollar amount. Founders who raise multiple SAFEs at low caps can be surprised by how much dilution materializes at their first priced round. Always model SAFE conversion at multiple valuation scenarios before closing a Series A.
What is a liquidation preference and how does it affect founder proceeds at exit?
A liquidation preference gives preferred stockholders (investors) the right to receive their investment back before common stockholders (founders and employees) receive anything in an exit. A 1x non-participating liquidation preference means investors get their money back first, then remaining proceeds go to all shareholders pro rata. A participating preferred provision means investors get their money back AND participate in the remaining proceeds as if they had converted to common, which can dramatically reduce founder proceeds in a modest exit. For example, if a company exits for $20M and investors have $15M in participating preferred, they collect $15M first, then share the remaining $5M pro rata with founders. Modeling the liquidation waterfall alongside dilution percentages gives you the true picture of what you’ll receive at exit.
Conclusion
Cap table management is not a one-time task. It’s an ongoing discipline that shapes every major decision from your first hire to your eventual exit. The founders who protect their equity most effectively are the ones who model dilution before every round, understand the full economic impact of option pools and anti-dilution provisions, and negotiate from a position of informed clarity rather than guesswork.
I recommend downloading the EFM Cap Table and Dilution Model to forecast your ownership across multiple funding rounds, model different fundraising scenarios, and stress-test your equity position before you sign your next term sheet.

Founders who model dilution before every round negotiate from a position of informed clarity rather than guesswork.

























































