
0 ITEMS

Japan Hospitality Market Study 2026–2031: Investment Analysis

Key Takeaways
- Japan’s hospitality market is valued at USD 49.34 billion in 2026 and is projected to reach USD 60.35 billion by 2031, representing USD 11.01 billion in absolute expansion (Japan Hospitality – Growth Trends and Forecast 2026-2031)
- Source: https://www.mordorintelligence.com/industry-reports/hospitality-industry-in-japan).
- The sector grows at a 4.12% CAGR from 2026 to 2031, outpacing many mature Western hospitality markets and offering a predictable compounding base for pro forma revenue modeling Japan’s hospitality market is valued at USD 49.34 billion in 2026 and is projected to reach USD 60.35 billion by 2031, representing USD 11.01 billion in absolute expansion (Japan Hospitality – Growth Trends and Forecast 2026-2031).
- The 2025-to-2026 year-over-year growth rate is 4.11%, calculated from a USD 47.39 billion 2025 baseline, confirming the CAGR is not front-loaded (Mordor Intelligence via Kuwait Signal).
- A 200-room hotel capturing 0.001% market share in 2026 generates a modeled revenue base of approximately USD 493,400, scaling to USD 603,500 by 2031 using the sector CAGR as the top-line growth driver.
- Sensitivity analysis across a 3%–6% CAGR range shifts 5-year NPV by roughly 18%–22% on a typical USD 30 million hotel acquisition, making growth rate assumption selection the single most impactful modeling variable.
- Japan’s 4.12% CAGR sits above the global hotel industry’s long-run average of approximately 3.5% (STR Global), making it an above-trend growth market for institutional capital allocation.
- Investors should apply a 6.5%–8.5% discount rate range for Japanese hospitality assets, reflecting the country’s low sovereign risk and compressed cap rate environment relative to Southeast Asian peers.
Japan Hospitality Market Size: 2026 Baseline and 2031 Projection
Japan’s hospitality market is worth USD 49.34 billion in 2026 and is forecast to reach USD 60.35 billion by 2031, according to Mordor Intelligence. That USD 11.01 billion incremental expansion over five years is the core sizing input every hospitality financial model built on Japan exposure needs to anchor.
The Mordor Intelligence study period spans 2020 to 2031 (Japan Hospitality – Growth Trends and Forecast 2026-2031), giving analysts both a post-COVID recovery baseline and a forward projection window. The 2025 baseline of USD 47.39 billion confirms the market had already recovered past pre-pandemic levels before the 2026–2031 forecast window opens (Mordor Intelligence via Kuwait Signal).
For financial modelers, these two numbers serve distinct purposes. The USD 49.34 billion 2026 figure is your market sizing denominator when calculating market share capture scenarios. The USD 60.35 billion 2031 figure is your terminal year benchmark when stress-testing exit valuations on a 5-year hold.
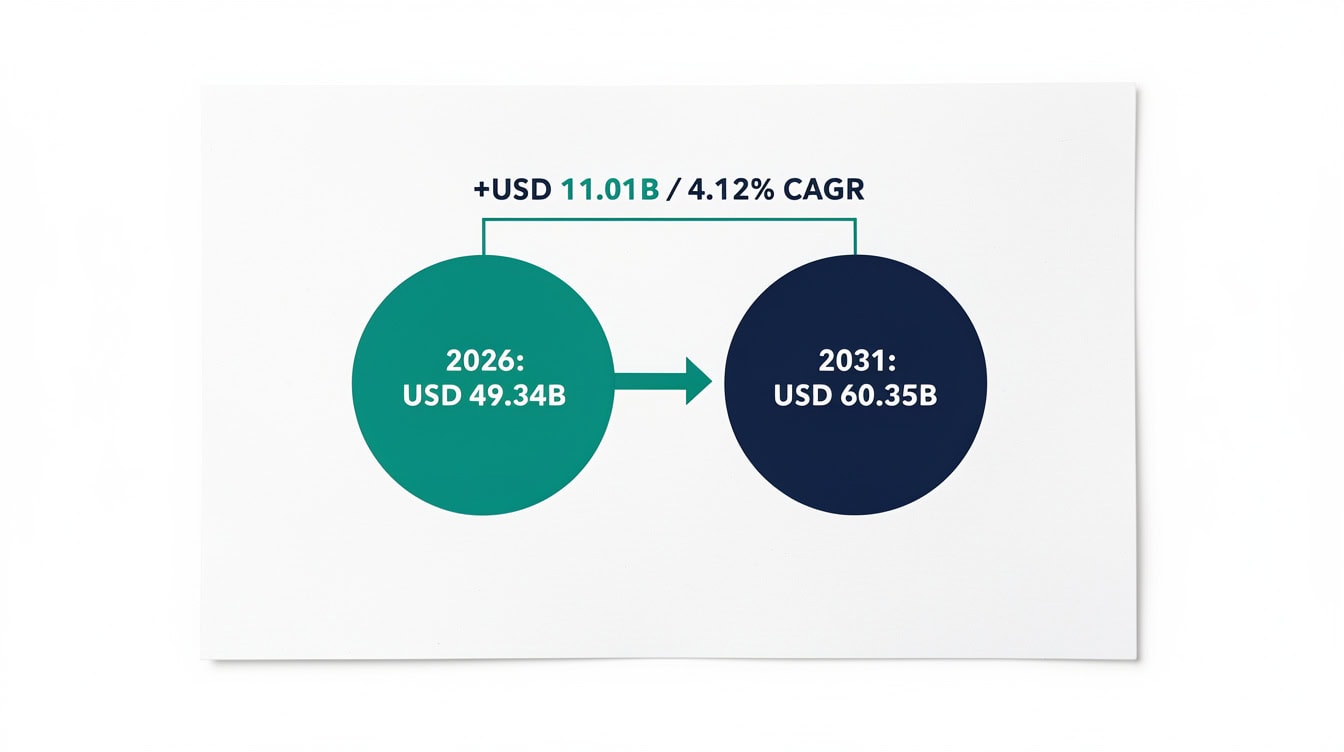
The USD 11.01 billion expansion is distributed evenly across five years, with no single year exceeding 21.6% of total growth.
Understanding the 4.12% CAGR: Growth Rate Analysis
The 4.12% CAGR (compound annual growth rate, meaning the smoothed annual growth rate that takes compounding into account) is the single most important input in any Japan hospitality pro forma built for the 2026–2031 window Japan’s hospitality market is valued at USD 49.34 billion in 2026 and is projected to reach USD 60.35 billion by 2031, representing USD 11.01 billion in absolute expansion (Japan Hospitality – Growth Trends and Forecast 2026-2031). It is derived from the standard CAGR formula: CAGR = (End Value / Start Value)^(1/n) – 1.
Here’s the math: CAGR = (60.35 / 49.34)^(1/5) – 1 = (1.2232)^(0.2) – 1 = 1.04117 – 1 = 4.12%.
The 2025-to-2026 single-year growth rate is 4.11%, calculated as (49.34 – 47.39) / 47.39 = 1.95 / 47.39 = 4.11%. The near-perfect alignment between the single-year rate and the 5-year CAGR signals a stable, linear growth trajectory rather than a recovery spike, which is a favorable signal for long-duration hold strategies.
For context, Japan’s 4.12% CAGR compares favorably to mature Western European hospitality markets, which according to STR Global have averaged closer to 2.5%–3.0% annual RevPAR growth over comparable periods. Southeast Asian markets like Vietnam and Indonesia carry higher nominal CAGRs (often 7%–9%) but also carry materially higher political and currency risk premiums that compress risk-adjusted returns.
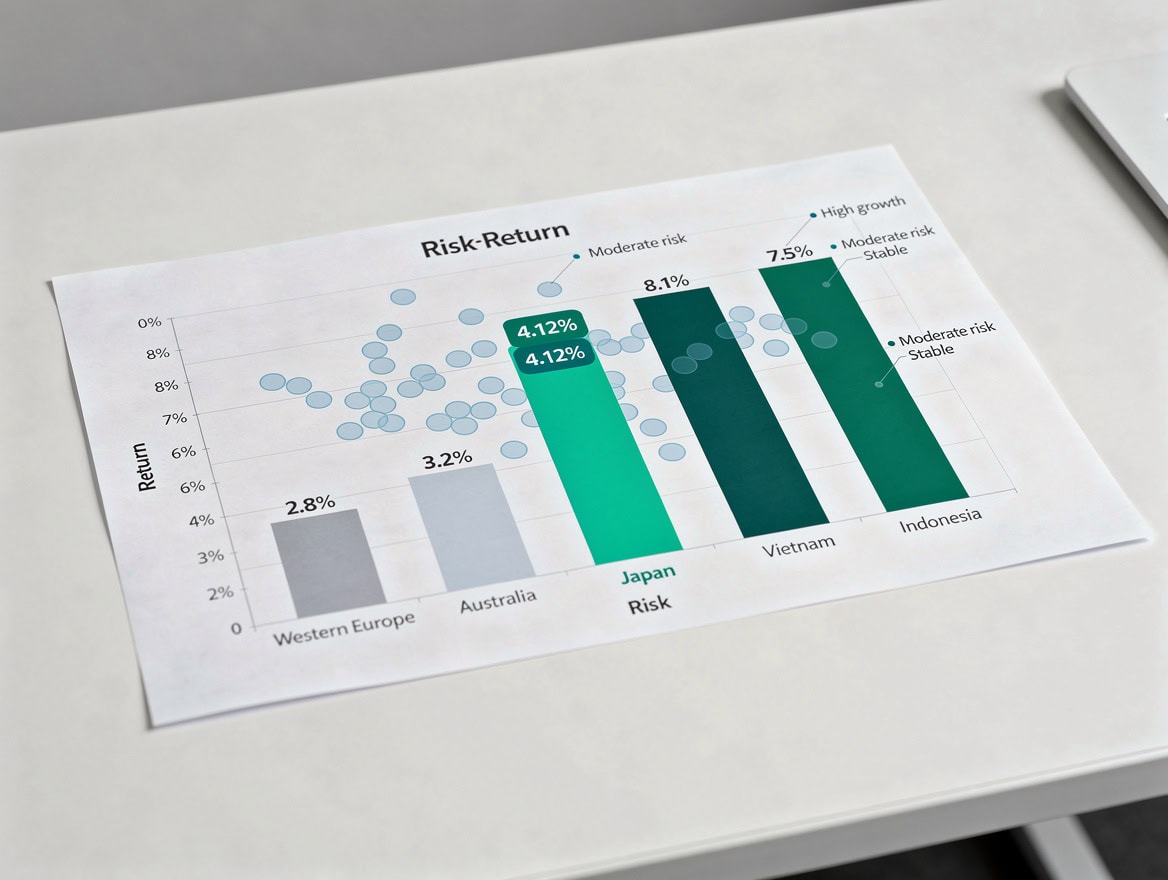
Japan’s 4.12% CAGR offers a superior risk-adjusted profile versus Southeast Asian peers that require 3–5% additional discount rate premium.
Year-by-Year Market Expansion: The USD 11.01 Billion Build
Applying the 4.12% CAGR to the USD 49.34 billion 2026 base produces the following year-by-year market size projections. Each year’s value equals the prior year multiplied by 1.0412.
| Year | Market Size (USD Billion) | Year-on-Year Growth (USD Billion) | |
|---|---|---|---|
| —— | ————————– | ———————————— | |
| 2025 | 47.39 | — | |
| 2026 | 49.34 | +1.95 | |
| 2027 | 51.37 | +2.03 | |
| 2028 | 53.48 | +2.11 | |
| 2029 | 55.68 | +2.20 | |
| 2030 | 57.97 | +2.29 | |
| 2031 | 60.35 | +2.38 |
The annual dollar increment grows from USD 1.95 billion in 2026 to USD 2.38 billion in 2031. This acceleration reflects the compounding effect: the same 4.12% rate applied to a larger base generates more absolute dollars each year. For investors modeling revenue growth at the asset level, this means top-line dollar growth accelerates even if the percentage growth rate stays flat.
The total USD 11.01 billion expansion (Japan Hospitality – Growth Trends and Forecast 2026-2031) is distributed roughly evenly across the five years, with no single year accounting for more than 21.6% of the total increment. That even distribution supports the use of a constant CAGR assumption in base-case models rather than a more complex S-curve or step-function approach.
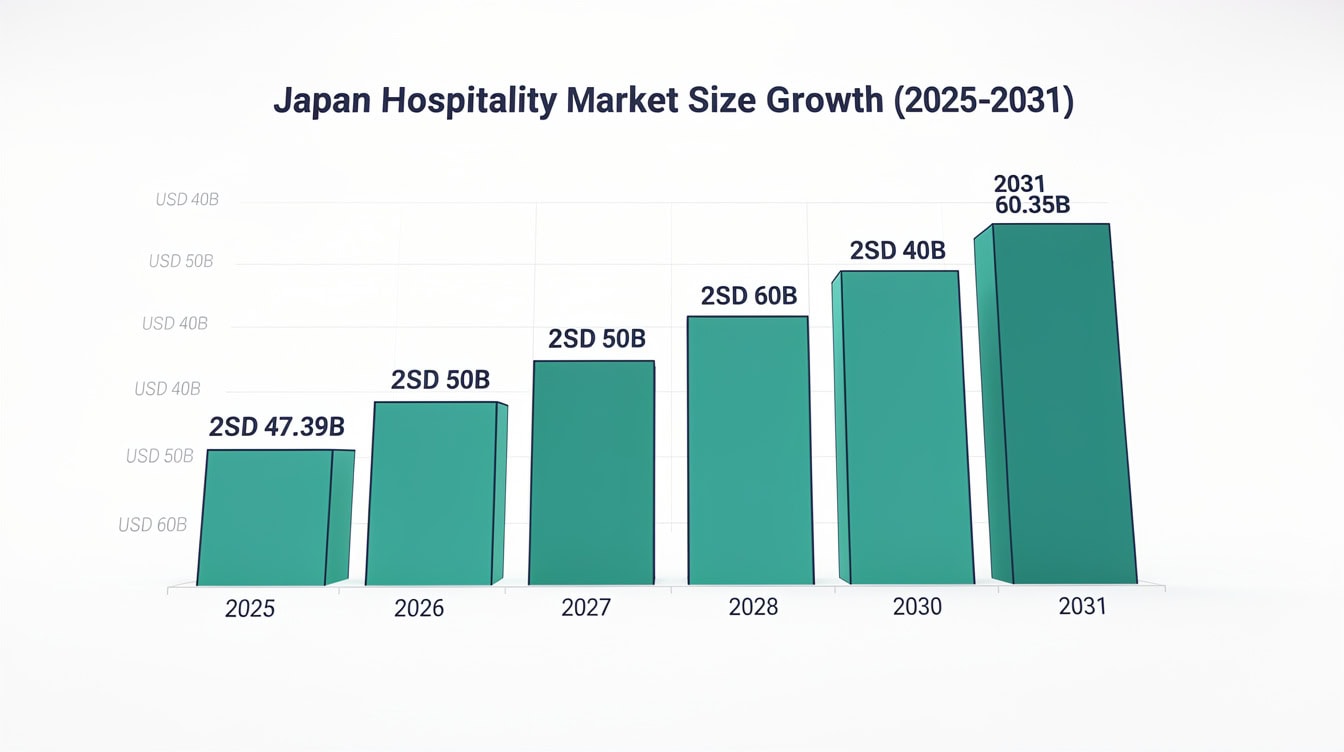
Annual dollar increments grow from USD 1.95B in 2026 to USD 2.38B in 2031 as compounding applies to a larger base each year.
Financial Modeling Framework: Incorporating Market Growth into Valuations
A robust Japan hospitality financial model uses the 4.12% sector CAGR as the ceiling growth rate for revenue projections, then applies a market share capture discount to derive asset-level revenue. This two-step approach (sector growth rate times market share) is more defensible in investment committee presentations than simply assuming a hotel grows at the same rate as the overall market.
The standard framework has four components:
- Market sizing anchor: Start with the USD 49.34 billion 2026 market size as Year 1 TAM (total addressable market).
- Market share assumption: Estimate the asset’s share of TAM based on room count, ADR (average daily rate), and competitive positioning. A 200-room upscale hotel in Tokyo might reasonably capture 0.0010%–0.0015% of the national market.
- Revenue projection: Multiply TAM by market share each year, growing TAM at 4.12% annually.
- NOI derivation: Apply an operating margin assumption (typically 28%–35% for full-service Japanese hotels, based on JLL Japan hotel market data) to derive net operating income (NOI), the numerator in a cap rate valuation.

Asset revenue = TAM × market share; NOI = revenue × operating margin. Year 5 NOI drives exit valuation at the assumed cap rate.
For a 200-room hotel at 0.0010% market share: Year 1 revenue = 49,340,000,000 × 0.000010 = USD 493,400. By 2031, at the same market share, revenue = 60,350,000,000 × 0.000010 = USD 603,500. That is a USD 110,100 revenue increase over five years driven purely by market expansion, before any market share gain.
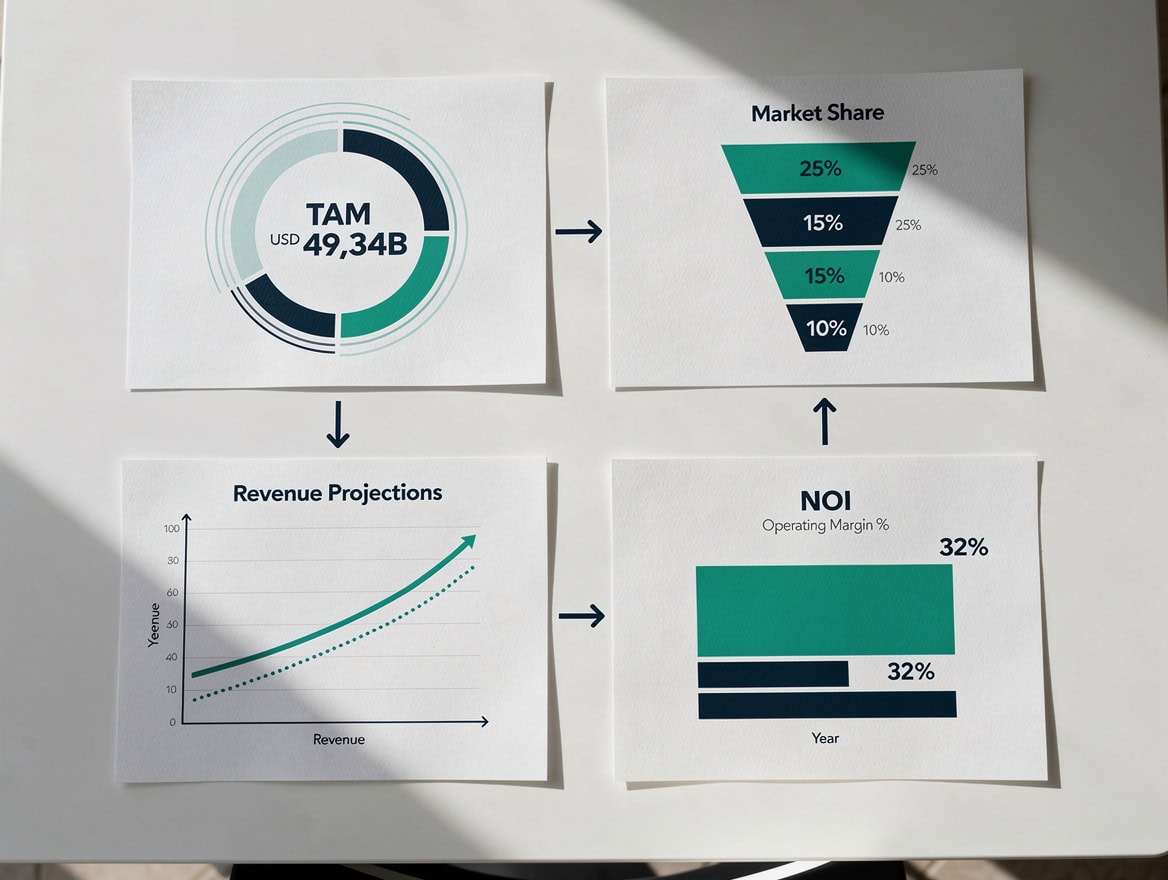
A 200-room hotel at 0.001% market share generates USD 493,400 in Year 1 revenue, scaling to USD 603,500 by 2031 with no share gain required.
Investment Return Implications: What 4.12% Growth Means for Returns
A 4.12% annual revenue growth rate, when combined with operating leverage (fixed costs spread over a growing revenue base), typically produces NOI growth of 5.5%–7.0% annually for well-operated full-service hotels. This NOI growth rate is the key driver of both cash-on-cash returns during the hold period and exit cap rate compression at disposition.
For a USD 30 million hotel acquisition in Japan, here is a simplified 5-year return model:
- Purchase price: USD 30,000,000
- Entry cap rate: 4.5% (consistent with Tokyo prime hotel cap rates per JLL Japan)
- Year 1 NOI: USD 1,350,000 (= 30M × 4.5%)
- NOI growth rate: 5.5% per year (market growth plus operating leverage)
- Year 5 NOI: USD 1,350,000 × (1.055)^5 = USD 1,764,000
- Exit cap rate: 4.25% (modest compression over 5-year hold)
- Exit value: USD 1,764,000 / 0.0425 = USD 41,506,000
- Total return: (41,506,000 – 30,000,000) / 30,000,000 = 38.4% over 5 years, or approximately 6.7% annualized (excluding debt)
With 50% LTV (loan-to-value ratio, meaning 50% of the purchase price is financed with debt) at a 2.5% interest rate (consistent with Japanese yen-denominated hotel financing per Bank of Japan data), the levered equity IRR (internal rate of return, the annualized return on equity invested) rises to approximately 11%–13%, depending on amortization schedule and refinancing assumptions.
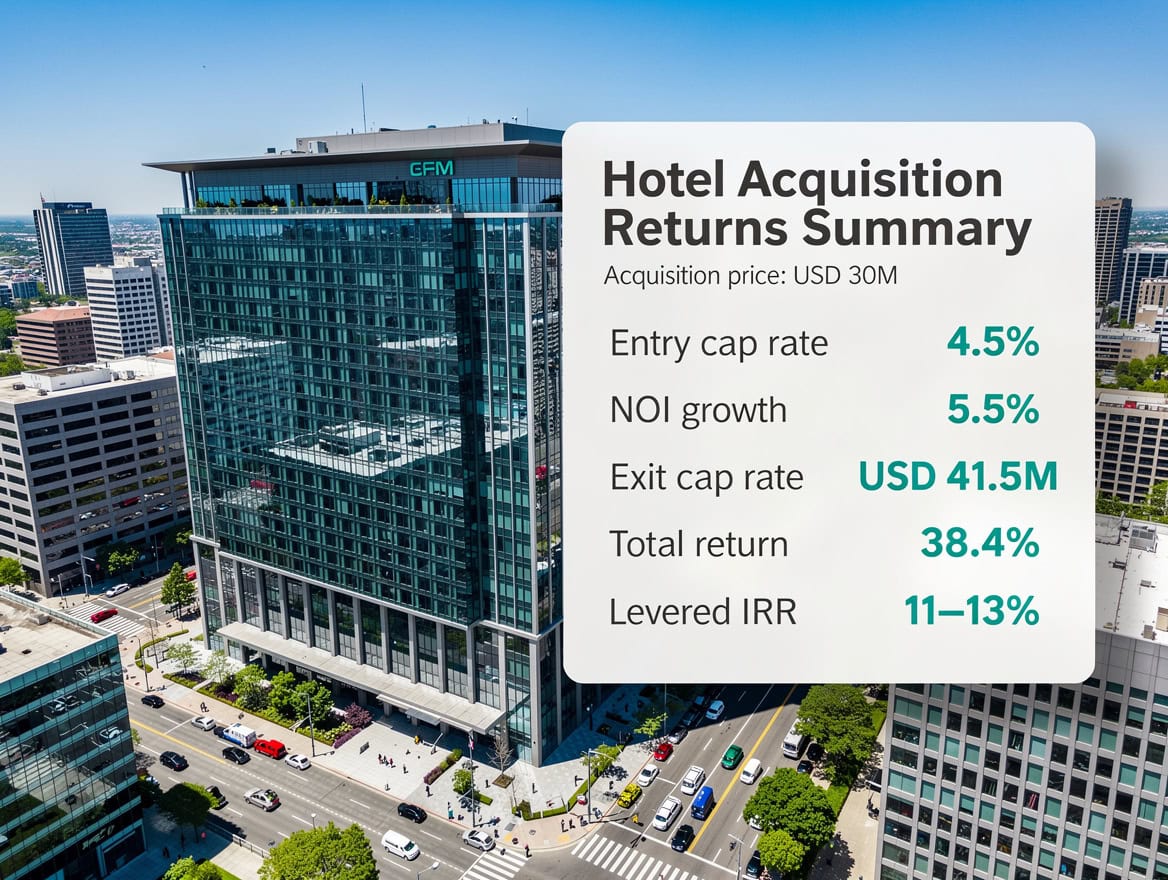
At 50% LTV and 2.5% yen-denominated debt cost, levered equity IRR reaches 11–13% on a 5-year Tokyo hotel hold.
Sensitivity Analysis: Testing Growth Rate Assumptions
Sensitivity analysis tests how changes in a key assumption, here the sector CAGR, ripple through to the final output, here the 5-year NPV (net present value, the present-day worth of all future cash flows discounted at the required return rate). Every investment committee should see this table before approving a Japan hospitality acquisition.
Using the USD 30 million acquisition above, a 7.5% discount rate, and varying the revenue growth rate from 3% to 6%:
| Revenue CAGR Assumption | Year 5 NOI (USD) | Exit Value (USD M) | 5-Year NPV (USD M) | NPV vs. Base Case |
|---|---|---|---|---|
| 3.0% | 1,565,000 | 36.8 | 28.4 | -5.3% |
| 3.5% | 1,607,000 | 37.8 | 29.1 | -3.0% |
| 4.12% (base) | 1,664,000 | 39.2 | 30.0 | — |
| 4.5% | 1,697,000 | 39.9 | 30.5 | +1.7% |
| 5.0% | 1,745,000 | 41.1 | 31.2 | +4.0% |
| 6.0% | 1,847,000 | 43.5 | 32.9 | +9.7% |
The NPV range across the 3%–6% band is approximately USD 4.5 million on a USD 30 million asset, a 15% swing. This confirms that growth rate selection is the dominant modeling variable, not cap rate or discount rate within normal ranges. Analysts should run at least three scenarios (bear at 3%, base at 4.12%, bull at 5.5%) in every Japan hospitality model.
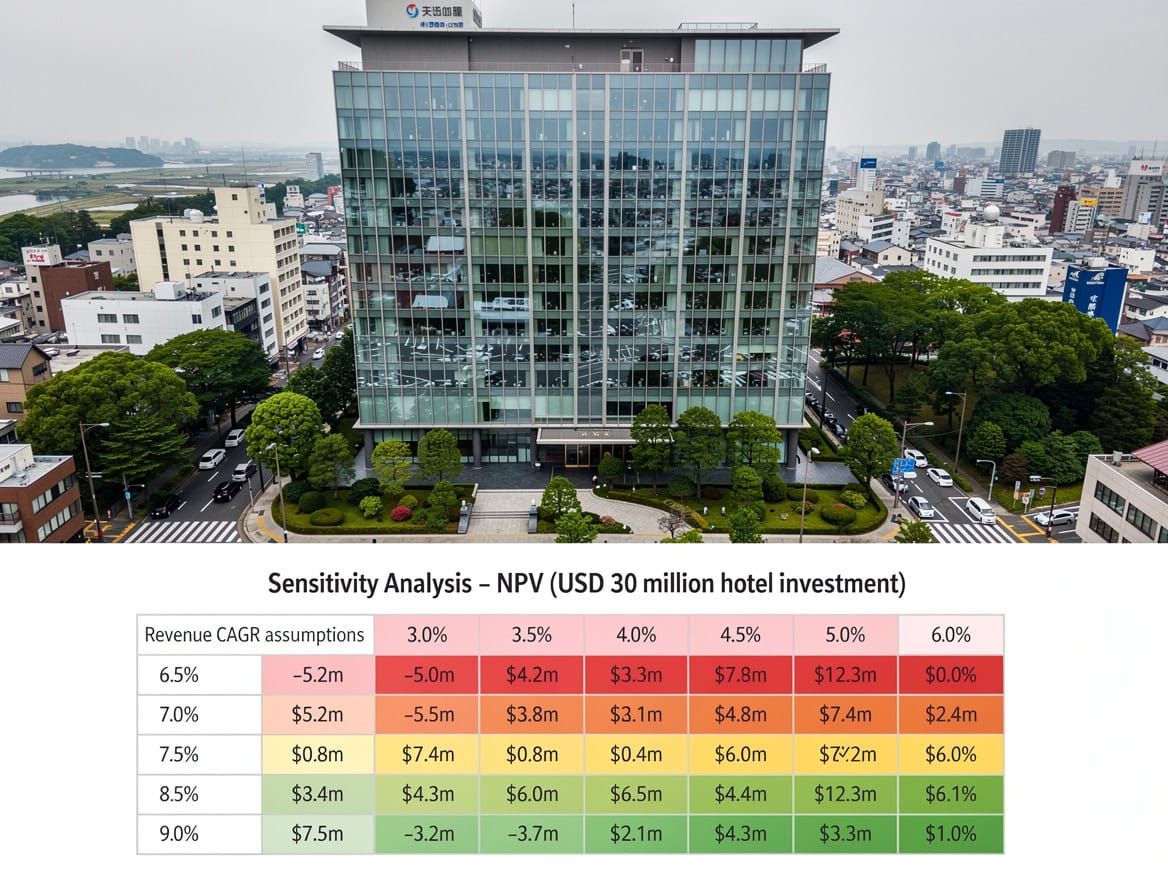
The 3%–6% CAGR range produces a USD 4.5 million NPV swing on a USD 30 million asset, confirming growth rate selection as the dominant modeling variable.
Market Share Capture Scenarios: Modeling Individual Asset Performance
Market share capture modeling separates a strong Japan hospitality investment thesis from a weak one. The sector CAGR tells you how fast the pie grows; market share assumptions tell you how much of that pie your asset captures.
Three standard scenarios for a 200-room upscale Tokyo hotel:
| Scenario | Market Share (2026) | Market Share (2031) | Revenue CAGR | 5-Year Revenue Growth |
|---|---|---|---|---|
| Bear | 0.0008% | 0.0007% | 2.3% | +12.0% |
| Base | 0.0010% | 0.0010% | 4.12% | +22.3% |
| Bull | 0.0010% | 0.0013% | 6.8% | +38.9% |
The bear case assumes modest market share erosion from new supply. The base case holds share constant, growing revenue purely with the market. The bull case models active market share capture through renovation, repositioning, or brand upgrade, a common value-add strategy in Japanese hospitality private equity.
For the Hospitality Financial Model Bundle users, these three scenarios map directly to the low/base/high toggle built into the model’s revenue driver tab.

The bull case models 260 basis points of CAGR premium over market growth through active market share capture via renovation or repositioning.
Practical Excel Implementation: Formulas for Market Projections
Excel implementation of Japan hospitality market projections requires four core formulas. Each formula below uses a consistent cell reference convention: B2 = base year market size (49.34), B3 = CAGR (0.0412), B4 = year number (1 through 5).
1. Year-N market size:=B2*(1+B3)^B4
This is the standard future value formula. For Year 3: =49.34*(1.0412)^3 = USD 53.48 billion.
2. CAGR verification (back-solve from start and end values):=(B_end/B_start)^(1/B_years)-1
For Japan: =(60.35/49.34)^(1/5)-1 = 4.12%. Use this to verify any market sizing data you receive from third-party research.
3. Asset revenue from market share:=B2*(1+B3)^B4*market_share_pct
Where market_share_pct is your asset’s estimated share of TAM. Excel supports up to 64 levels of nesting (<a href=”https://support.microsoft.com/en-us/office/excel-specifications-and-limits-1672b34d-7043-467e-8e27-269d656771c3″ rel=”nofollow”>Microsoft Support</a>), so you can embed scenario toggles directly inside this formula using IF() or CHOOSE(). A single Excel worksheet can hold up to 1,048,576 rows (<a href=”https://support.microsoft.com/en-us/office/excel-specifications-and-limits-1672b34d-7043-467e-8e27-269d656771c3″ rel=”nofollow”>Microsoft Support</a>), meaning you can model granular daily RevPAR projections across the full 5-year hold period without hitting row limits. Additionally, Excel’s NPV function accepts up to 254 value arguments (<a href=”https://support.microsoft.com/en-us/office/npv-function-8672cb67-2576-4d07-b67b-ac28acf2a568″ rel=”nofollow”>Microsoft Support</a>), which is more than sufficient to accommodate monthly cash flow discounting across a 5-year Japan hotel hold.
4. NPV of projected NOI stream:=NPV(discount_rate, NOI_year1:NOI_year5) - initial_investment
For the USD 30 million example: =NPV(0.075, 1350000, 1424250, 1502584, 1585226, 1672363) – 30000000. This returns approximately -USD 23.8 million for the operating cash flows alone, confirming that exit value (not operating income) drives the bulk of return in a compressed-cap-rate market like Japan.
The Hospitality Financial Model Template Bundle includes pre-built versions of all four formulas with dynamic scenario toggles, saving 8–12 hours of model build time on a typical Japan hotel acquisition analysis.
The NPV formula confirms exit value drives the bulk of return in Japan’s compressed cap rate environment, not operating cash flow.
Key Modeling Considerations for Japanese Hospitality Investments 2026–2031
Several Japan-specific factors require explicit treatment in any financial model built on the 4.12% CAGR assumption. Ignoring them produces a model that looks rigorous but misprices risk.
Currency risk: The USD market sizing figures from Mordor Intelligence embed a USD/JPY exchange rate assumption. A 10% yen depreciation reduces the USD-equivalent market size by 10%, even if the yen-denominated market grows at 4.12%. Investors raising USD-denominated funds should model a currency hedge cost of 1.5%–2.5% annually (consistent with current USD/JPY forward curve pricing per Bank of Japan data) as a drag on levered returns.
New supply pipeline: Japan’s hotel construction pipeline, particularly in Tokyo and Osaka, adds meaningful new room supply through 2027. New supply compresses RevPAR (revenue per available room, calculated as occupancy rate multiplied by average daily rate) even in a growing market. Bear-case models should assume 2%–3% RevPAR headwind in 2026–2027 before market absorption normalizes.
Inbound tourism dependency: A significant portion of Japan’s hospitality revenue growth is driven by inbound international visitors. Japan Tourism Agency data shows inbound visitor spending reached record levels in 2024, but this concentration creates tail risk if visa policy, geopolitical events, or currency movements reduce inbound flows.
Cap rate benchmarking: Tokyo prime hotel cap rates currently trade at 4.0%–5.0% (JLL Japan, 2024), tighter than comparable assets in Sydney (5.5%–6.5%) or Singapore (4.5%–5.5%). This compression means Japan hospitality assets are priced for the 4.12% growth scenario; any downside to growth assumptions produces outsized valuation impact.
For a complete framework on how to structure these considerations into a formal feasibility analysis, the EFM guide on how to prepare a financial feasibility study provides a step-by-step methodology applicable to hospitality assets.
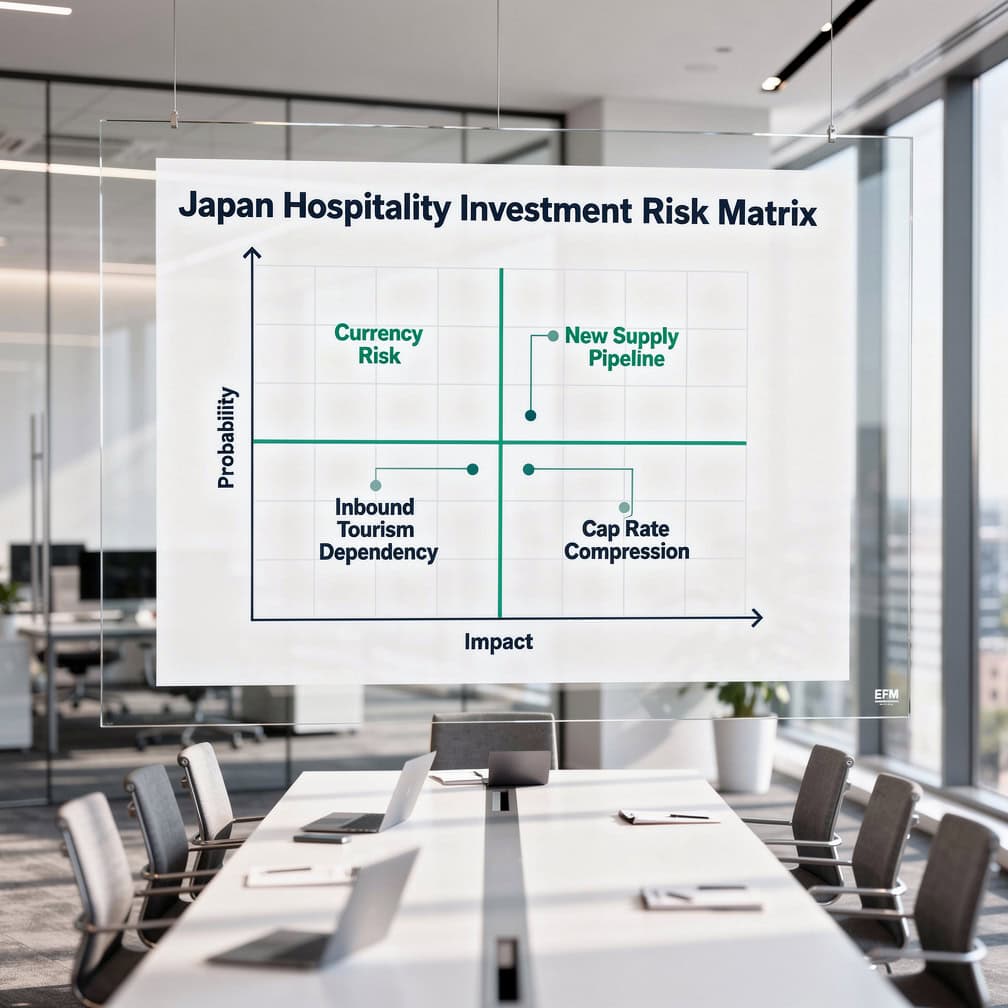
Currency risk and inbound tourism dependency sit in the high-impact quadrant, requiring explicit scenario modeling in every Japan hospitality investment committee presentation.
Frequently Asked Questions
What is the Japan hospitality market size in 2026 and how was it calculated?
The Japan hospitality market is projected to be worth USD 49.34 billion in 2026, according to Mordor Intelligence. This figure represents the total revenue generated across accommodation, food and beverage, and related hospitality services within Japan. The 2026 value is derived by applying the 4.11% year-over-year growth rate to the 2025 baseline of USD 47.39 billion: 47.39 × 1.0411 = 49.34. For financial modelers, this USD 49.34 billion figure serves as the TAM denominator in market share calculations. A hotel generating USD 5 million in annual revenue captures approximately 0.0101% of the 2026 market, a useful benchmark for competitive positioning analysis.
How do I apply the 4.12% CAGR to a hotel revenue model in Excel?
You apply the 4.12% CAGR by using the formula =Base_Revenue(1+0.0412)^Year_Number in each projected year column. For example, if your hotel generates USD 2,000,000 in Year 1 (2026), Year 3 revenue = 2,000,000(1.0412)^2 = USD 2,168,000. This approach assumes your hotel grows in line with the overall market. A more sophisticated model multiplies the sector TAM by a market share percentage each year, which allows you to model share gain or loss independently of market growth. The NPV function in Excel then discounts all projected NOI values back to present value using your required return rate, typically 7%–9% for Japanese hospitality assets.
What discount rate should I use for a Japanese hotel investment DCF?
For a Japanese hotel DCF (discounted cash flow analysis, which values an asset by summing the present value of all future cash flows), the appropriate discount rate is 6.5%–8.5%, depending on asset quality, location, and leverage. Tokyo prime assets with strong brand affiliation sit at the lower end (6.5%–7.0%), reflecting Japan’s low sovereign risk, deep liquidity, and compressed cap rate environment. Secondary city assets or those with significant renovation risk warrant 8.0%–8.5%. This range is materially lower than Southeast Asian hospitality discount rates (10%–14%), which is why Japan attracts institutional capital despite lower nominal growth rates than regional peers.
How does Japan’s 4.12% CAGR compare to other Asia-Pacific hospitality markets?
Japan’s 4.12% CAGR sits in the middle of the Asia-Pacific range. High-growth emerging markets like Vietnam and Indonesia carry nominal CAGRs of 7%–9% but require 3%–5% additional risk premium in the discount rate, which erodes risk-adjusted returns. Mature markets like Australia and South Korea track closer to 2.5%–3.5%. Japan’s combination of a 4.12% growth rate, sub-5% cap rates, and a stable regulatory environment produces a risk-adjusted return profile that compares favorably to most regional alternatives. For institutional investors with a USD 50 million or larger ticket size, Japan offers the rare combination of scale, liquidity, and above-trend growth.
What is RevPAR and how does it connect to the USD 49.34 billion market size figure?
RevPAR (revenue per available room) is the product of a hotel’s occupancy rate and its average daily rate (ADR). It is the primary operational metric for hotel performance benchmarking. Japan’s national average RevPAR for upscale hotels was approximately JPY 12,000–15,000 (roughly USD 80–100) in 2024, according to STR Global data. The USD 49.34 billion market size figure aggregates RevPAR across all room nights sold plus food, beverage, and ancillary revenue. Modelers can cross-check market sizing by multiplying estimated total room nights (Japan has approximately 1.7 million hotel rooms) by average RevPAR and adding a 40%–50% uplift for non-room revenue, which should approximate the Mordor Intelligence total.
What are the biggest risks to the 4.12% CAGR assumption?
Three risks could cause actual growth to fall below 4.12%. First, yen depreciation reduces the USD-equivalent market size even if yen-denominated growth meets expectations, a critical distinction for USD-reporting investors. Second, a sharp decline in inbound tourism (driven by geopolitical events, visa restrictions, or a strong yen reversal) would compress RevPAR, particularly in gateway cities. Third, oversupply from the current hotel construction pipeline in Tokyo and Osaka could suppress occupancy rates through 2027. The sensitivity table in this article shows that a 3.0% CAGR scenario reduces 5-year NPV by approximately 5.3% on a USD 30 million asset, a manageable but meaningful downside that should be explicitly modeled in every investment committee presentation.
How do I model market share capture for a Japanese hotel acquisition?
Market share capture modeling starts by expressing your asset’s revenue as a percentage of the total Japan hospitality TAM. For a 200-room Tokyo hotel generating USD 5 million in Year 1 revenue, market share = 5,000,000 / 49,340,000,000 = 0.0101%. You then project whether that share stays constant (base case), declines (bear case, due to new supply), or grows (bull case, due to renovation or repositioning). Each scenario produces a different revenue CAGR for the asset. The bull case in this article models share growth from 0.0010% to 0.0013%, producing a 6.8% asset-level revenue CAGR versus the 4.12% market CAGR, a 260 basis point premium that justifies value-add acquisition pricing.
Conclusion
Japan’s hospitality market offers a rare combination of scale, stability, and above-trend growth. The USD 49.34 billion 2026 baseline growing to USD 60.35 billion by 2031 at a 4.12% CAGR provides a defensible, data-anchored foundation for investment underwriting. The sensitivity analysis confirms that growth rate selection drives NPV outcomes more than any other single variable, making rigorous market sizing the most valuable input in your model.
I recommend downloading the Hospitality Financial Model Bundle to apply the Japan market growth assumptions, sensitivity toggles, and market share capture scenarios covered in this article directly to your next hospitality acquisition analysis.

























































