
0 ITEMS

GPU & Technology Distributor – LBO, DCF & FCFE Financial Model | 3-Scenario | 10-Year Forecast
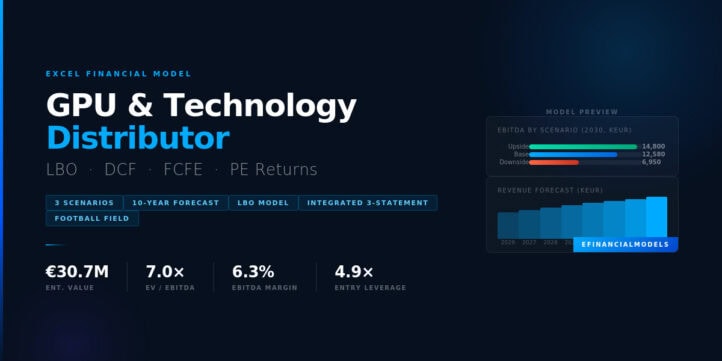
A comprehensive M&A and private equity financial model for a GPU and technology distribution business. Built for PE professionals, M&A advisors, and investment analysts, the model covers a 10-year projection period (2026–2035) across three operating scenarios (Base, Downside, Upside) and includes a fully integrated set of financial statements alongside dedicated valuation and returns modules. KEY MODEL FEATURES: – Integrated P&L, Balance Sheet, and Cash Flow Statement – LBO model with senior debt (€14.8M) and subordinated debt (€6.7M) at 6% blended rate, fully amortized by 2033 – DCF, FCFE, and WACC valuation modules – PE returns analysis and football field valuation summary – Revenue disaggregated by GPU unit volumes, supplier/product line expansion, and market expansion — each with independent growth drivers per scenario – FX operating exposure modeled explicitly (40–60% of net sales in Base case) – Debt schedule, PPE schedule, and charts dashboard included KEY METRICS (Base Case): – Enterprise Value: ~€30.7M | Entry Leverage: 4.9x – Revenue CAGR (2026–2030): ~2.8% | Steady-state EBITDA Margin: ~6.3% – Min DSCR: 1.33x | Min Cash Balance: ~€12.7M | Full Deleveraging: 2033 – Tax rate: 30% | Maintenance Capex: €100k p.a. IDEAL FOR: Independent searchers evaluating technology distribution assets.


GPU & Technology Distributor – LBO, DCF & FCFE Financial Model
This financial model has been purpose-built for private equity professionals, M&A advisors, and investment analysts evaluating acquisition opportunities in the GPU and technology distribution sector. It provides a fully integrated, dynamic framework covering everything from operating assumptions through to investor returns — structured to support both deal evaluation and ongoing portfolio monitoring.
The model follows a cash-free, debt-free acquisition structure and is built around a 10-year projection horizon (2026–2035), with historical actuals anchored from 2021 through 2025. All outputs update dynamically from a single master case selector, allowing instant switching between Base, Downside, and Upside scenarios.
WHAT’S INCLUDED
The model is organized across 15 structured tabs:
– Cover & Model Overview — transaction summary, credit metrics, and key modelling assumptions at a glance
– Assumptions — all drivers centralized in one place, including volume growth, pricing, FX exposure, COGS, OPEX, personnel costs, capex, and supplier bonus stability
– Income Statement — full P&L from gross sales through to net income, with revenue disaggregated by growth driver
– Balance Sheet — fully integrated with P&L and cash flow
– Cash Flow Statement — direct link to BS and IS; tracks operating, investing, and financing cash flows
– PPE Schedule — maintenance capex and depreciation logic
– Debt Schedule — senior and subordinated debt tranches, interest calculations, and amortization waterfall
– DCF Valuation — discounted cash flow analysis with explicit WACC inputs
– WACC Calculation — cost of equity, cost of debt, and blended WACC derivation
– FCFE Valuation — free cash flow to equity methodology as a cross-check
– LBO Modelling — full leveraged buyout structure with entry/exit assumptions and returns bridging
– PE Returns Analysis — IRR and MOIC outputs across cases and exit scenarios
– Football Field — consolidated valuation range visualization across methodologies
– Charts — dashboard of key operating and financial KPIs
REVENUE MODEL
Revenue is built bottom-up from three independent growth drivers:
1. GPU Unit Volumes — driven by market demand allocation growth rates, with GPU unit volumes and average selling prices tracked separately. Base case assumes ~3.5% volume growth in 2026, tapering to ~2.3% by the end of the forecast.
2. Supplier & Product Line Expansion — models incremental revenue from onboarding new suppliers or expanding the product range, growing from 0% uplift in 2026 to ~1.5% per annum from 2028 onward in the Base case.
3. Market Expansion — captures geographic or segment-level market share gains; set to zero in the Base case and modestly positive in the Upside.
Average selling prices are modeled separately for GPU and non-GPU product lines, with 1.0% annual price growth in early years stepping down to 0.8% from 2031 onward.
MARGIN & COST STRUCTURE
– COGS modeled at 95% of gross sales in the Base case, reflecting the thin-margin nature of technology distribution
– Supplier bonuses (Other Operating Income) provide a meaningful margin buffer at 4.9% of gross sales in the Base case
– Personnel expenses held at 1.1% of net sales across the forecast
– OPEX ranges from 1.44% to 1.66% of net sales, reflecting gradual cost scaling
– FX impact explicitly modeled as a drag on EBIT, with Base case assuming 40–60% of net sales exposed to USD purchasing risk
Steady-state EBITDA margin in the Base case is approximately 6.3%, consistent with normalized distribution sector benchmarks.
TRANSACTION & FINANCING STRUCTURE
Enterprise Value: ~€30.7M
Equity Contribution: ~€9.1M (30%)
Senior Debt: ~€14.8M (48%)
Subordinated Debt: ~€6.7M (22%)
Entry EV/EBITDA Multiple: ~7.0x
Entry Leverage: 4.9x
Interest Rate (Senior): 6% (EURIBOR + 400bps)
Amortization: 100% over 7 years
Full Deleveraging Year: 2033
CREDIT & RETURNS METRICS (BASE CASE)
– Minimum DSCR: 1.33x
– Minimum Cash Balance: €12.7M
– Peak Leverage: 4.9x
– Revenue CAGR 2026–2030: ~2.8%
– EBITDA CAGR 2026–2030: ~2.8%
THREE OPERATING SCENARIOS
Each scenario is fully modeled across every assumption driver:
Base Case — normalized operating environment with stable GPU demand growth, 4.9% supplier bonus rate, and maintained cost ratios.
Downside Case — demand contraction and margin compression in the near term (negative GPU volume growth in 2026–2027), higher COGS, elevated OPEX, reduced supplier bonuses, and limited FX mitigation.
Upside Case — improved GPU allocation, expanded supplier terms and product lines, stronger market expansion, lower COGS through better supplier pricing, and increased FX hedging effectiveness.
IDEAL FOR
– Private equity firms running LBO analysis on technology distribution targets
– M&A advisors and investment banks preparing buy-side or sell-side financial analysis
– Corporate development teams stress-testing acquisition economics
– Investment analysts benchmarking distribution sector valuations
Similar ProductsOther customers were also interested in...



 eFinancialModels
Electric Vehicle (EV) Charging Station Financial M...
With this comprehensive 5- or 10-year monthly tool, investors can assess the viability of setting up... Read more

Financial Model for Mobile App | Mobile App Busine...
The Mobile App Financial Plan Template in Excel allows you to develop financial projections when lau... Read more

 HenrySheykin
Food Truck Financial Model Excel Template
The Food Truck Financial Model helps entrepreneurs, founders, business owners, consultants, and anal... Read more

Green Hydrogen Production from Wind Energy Financi...
The Green Hydrogen from Wind Financial Model aims to comprehensively forecast a horizon of 40 years ... Read more

Simple Mutual Non-Disclosure Agreement Template
Protect your business secrets with ease using our Simple Mutual Non-Disclosure Agreement Template. S... Read more

Solar Energy Financial Model
The Solar Energy Financial Model Spreadsheet Template in Excel assists you in preparing a sophistica... Read more

 Peter Graf
The Customer-Centric Financial Model for Restauran...
Starting a restaurant without a financial plan is like driving a car blindfolded. You wouldn´t do i... Read more
You must log in to submit a review.