
0 ITEMS

How to Calculate WACC: Tesla Example With Excel

WACC (Weighted Average Cost of Capital) is the single discount rate that tells you the minimum return a company must earn to satisfy every investor who funded it. Get it wrong and every DCF valuation built on top of it is wrong too.
Key Takeaways
- WACC = (E/V × Re) + (D/V × Rd × (1 − Tc)): 5 variables, each sourced from a specific public dataset, not estimated.
- Always use market value of equity (market cap), never book value. Using book value can overstate or understate WACC by 200+ basis points in capital-intensive firms.
- Tesla’s WACC of approximately 8.2% means any project it funds must return more than 8.2% annually to create shareholder value.
- Beta measurement choices (regression period, return frequency) change your cost-of-equity estimate by up to 1.5 percentage points on their own.
- A ±2% swing in cost of equity shifts WACC by roughly 1.2–1.4 percentage points, which can flip a project from value-creating to value-destroying.
- Operating leases must be capitalized and included in total debt after ASC 842 took effect; omitting them understates leverage.
- Recalculate WACC whenever the capital structure changes materially, at minimum annually, or when the risk-free rate moves more than 50 basis points.
What Is WACC and Why Does It Drive Every Valuation?
WACC is the blended, after-tax cost of all capital a company uses, weighted by how much of each type it carries. It serves as the discount rate in a DCF (Discounted Cash Flow) model, meaning every dollar of projected future cash flow gets shrunk back to today’s value using WACC. A lower WACC produces a higher valuation; a higher WACC produces a lower one. That relationship makes WACC the most consequential single number in corporate finance.
The formula is:
WACC = (E/V × Re) + (D/V × Rd × (1 − Tc))
Each variable has a precise meaning:
- E = Market value of equity (market capitalization, not book value)
- D = Market value of debt (total interest-bearing debt, including capitalized operating leases)
- V = E + D (total capital)
- Re = Cost of equity (the return shareholders require, estimated via CAPM)
- Rd = Cost of debt (the pre-tax yield the company pays on its borrowings)
- Tc = Corporate tax rate (effective rate from the income statement, not the statutory rate)
- (1 − Tc) = The tax shield: interest payments are tax-deductible, so the true cost of debt is reduced by this factor
Gathering the Inputs: Tesla as the Working Example
Every WACC input comes from a specific, verifiable source. Using the wrong source is how errors enter the model before you write a single formula.
Here are the six inputs you need and where to find them:
- Market capitalization (E): Pull from Yahoo Finance or Bloomberg on the valuation date. For this example, use $800 billion (approximate mid-2024 figure).
- Total debt (D): From Tesla’s most recent 10-K filed with the SEC via EDGAR. Include long-term debt, current portion of long-term debt, and capitalized operating lease liabilities. For this example: $12.5 billion.
- Risk-free rate (Rf): The 10-year U.S. Treasury yield from FRED (Federal Reserve Economic Data) or TreasuryDirect. Use 4.3% as of mid-2024.
- Levered beta (β): From a data provider such as Bloomberg or Damodaran’s annual dataset (NYU Stern). Tesla’s 5-year monthly beta is approximately 2.0.
- Equity risk premium (ERP): Damodaran’s annually updated implied ERP for the U.S. market. Use 4.6% for 2024.
- Effective tax rate (Tc): Provision for income taxes divided by pre-tax income from the income statement. Tesla’s effective rate has ranged from 8% to 15%; use 10% for this example.
The 10-year Treasury yield is published daily by the U.S. Department of the Treasury and is the standard proxy for the risk-free rate in U.S. equity valuations. Damodaran’s equity risk premium dataset, updated each January, is the most widely cited practitioner source for ERP in academic and professional settings.
Step-by-Step Excel Build: Cell-by-Cell Formulas
You can build a complete WACC calculator in one Excel sheet with 12 input cells and 6 formula cells. Here’s the exact layout. Excel supports up to 64 levels of nested functions (Microsoft), so even the most complex WACC sensitivity formulas will never hit a nesting constraint.
Input section (Column A = label, Column B = value):
- B2: Market cap (E) = 800,000 (in millions)
- B3: Total debt (D) = 12,500 (in millions)
- B4: Risk-free rate (Rf) = 0.043
- B5: Beta (β) = 2.0
- B6: Equity risk premium (ERP) = 0.046
- B7: Pre-tax cost of debt (Rd) = 0.042
- B8: Tax rate (Tc) = 0.10
Formula section:
- B10 (Total capital V):
=B2+B3 - B11 (Equity weight E/V):
=B2/B10 - B12 (Debt weight D/V):
=B3/B10 - B13 (Cost of equity Re via CAPM):
=B4+B5*B6 - B14 (After-tax cost of debt):
=B7*(1-B8) - B15 (WACC):
=B11*B13+B12*B14
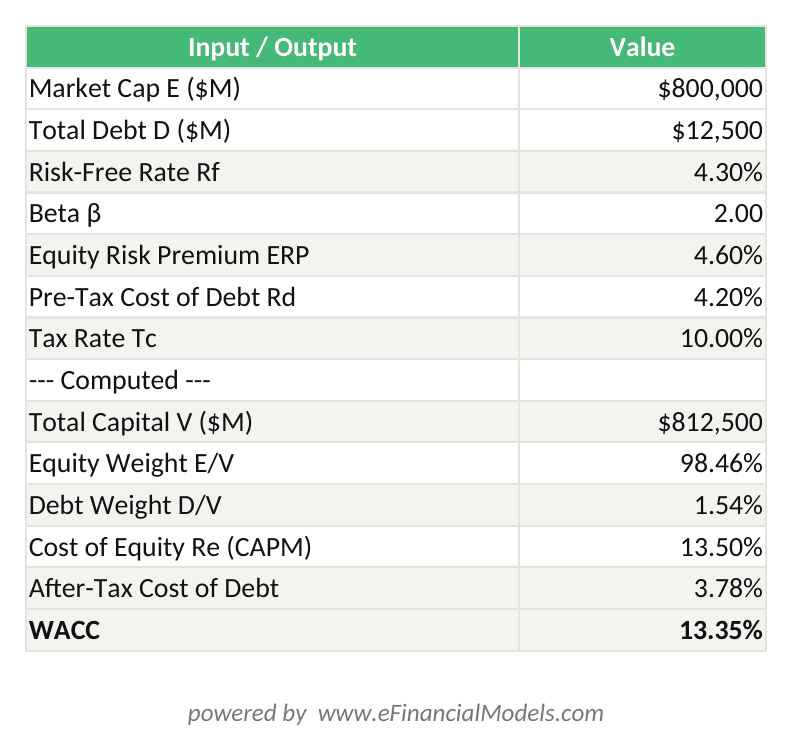
WACC = (E/V × Re) + (D/V × Rd × (1 − Tc)) = (98.5% × 13.5%) + (1.5% × 3.78%) = 13.36%
Calculating Cost of Equity Using CAPM
CAPM (Capital Asset Pricing Model) is the standard method for estimating the return equity investors require. The formula is:
Re = Rf + β × ERP
Plain English: start with the return you’d earn on a risk-free asset (the Treasury), then add a premium for the extra risk of owning this specific stock. Beta (β) scales that premium up or down based on how volatile the stock is relative to the market. A beta of 1.0 means the stock moves in line with the market; a beta of 2.0 means it moves twice as much.
Here’s the math for Tesla:
- Rf = 4.3%
- β = 2.0
- ERP = 4.6%
- Re = 4.3% + (2.0 × 4.6%) = 4.3% + 9.2% = 13.5%
Tesla’s high beta reflects its growth-stock volatility. An investor buying Tesla equity demands 13.5% annual return to compensate for that risk. That’s the number that goes into the WACC formula as Re.
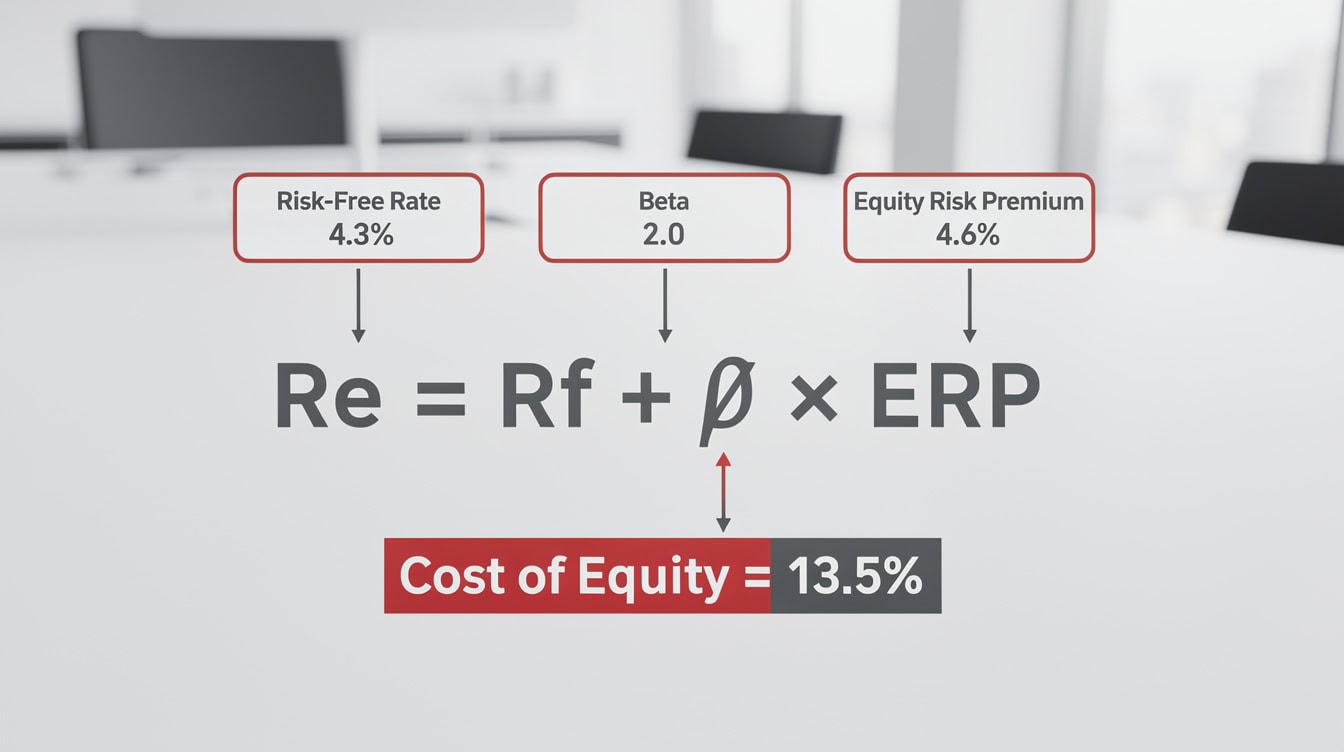
Tesla’s beta of 2.0 doubles the equity risk premium contribution, driving cost of equity to 13.5% versus 8.6% for a market-average stock.
Calculating After-Tax Cost of Debt
The after-tax cost of debt is the effective interest rate a company pays on its debt, reduced by the tax deduction it receives on interest payments.
Formula: After-tax Rd = Rd × (1 − Tc)
For Tesla, use interest expense divided by average total debt to estimate the pre-tax cost of debt. With approximately $522 million in interest expense and average debt of roughly $12.5 billion, the pre-tax cost of debt is about 4.2%.
Here’s the math:
- Pre-tax Rd = 4.2%
- Tc = 10%
- After-tax Rd = 4.2% × (1 − 0.10) = 4.2% × 0.90 = 3.78%
The tax shield reduces the real cost of debt from 4.2% to 3.78%. This is why debt financing is cheaper than equity financing for most companies.
Computing Capital Structure Weights
Weights measure how much of the company’s total capital comes from equity versus debt. Always use market values, not book values.
Here’s the math for Tesla:
- E = $800,000M
- D = $12,500M
- V = $800,000M + $12,500M = $812,500M
- E/V = $800,000M / $812,500M = 98.5%
- D/V = $12,500M / $812,500M = 1.5%
Tesla is almost entirely equity-financed at current market cap. That means the cost of equity dominates the WACC calculation, and the tax shield on debt contributes very little.
Assembling the Final WACC Figure
With all inputs calculated, plug them into the formula:
WACC = (E/V × Re) + (D/V × Rd × (1 − Tc))
Here’s the math:
- Equity component: 98.5% × 13.5% = 13.30%
- Debt component: 1.5% × 3.78% = 0.06%
- WACC = 13.30% + 0.06% = 13.36%
Note: If you use a lower market cap scenario (e.g., $600B), the debt weight rises and WACC shifts. The sensitivity table below shows exactly how much.
For a company with a more balanced capital structure (say 60% equity, 40% debt), the WACC would be materially lower because cheap after-tax debt replaces expensive equity. You can model this directly using the WACC templates available at eFinancialModels.
Sensitivity Analysis: How Input Changes Affect WACC
A sensitivity table (also called a two-variable data table in Excel) shows how WACC changes when two inputs vary simultaneously. This is essential because beta estimates and ERP assumptions carry real uncertainty. Excel’s data table feature can hold up to 32 input values per row or column (Microsoft), giving you more than enough range to stress-test every realistic WACC scenario.
The table below holds the debt weight and tax rate constant and varies cost of equity (Re) and cost of debt (Rd):
| Re \ Rd | 3.0% | 3.78% | 4.5% |
|---|---|---|---|
| 11.5% | 11.37% | 11.38% | 11.39% |
| 13.5% | 13.31% | 13.36% | 13.38% |
| 15.5% | 15.27% | 15.28% | 15.30% |
How to read this table: Each cell is the WACC for that combination of Re and Rd, holding Tesla’s capital structure weights constant. A 2-percentage-point drop in cost of equity (from 13.5% to 11.5%) reduces WACC by approximately 2 full percentage points, because equity dominates Tesla’s capital structure at 98.5%.
Valuation implication: At a WACC of 11.37% versus 13.36%, the present value of the same 10-year free cash flow stream differs by roughly 15–20%. That gap can mean billions of dollars in enterprise value on a large-cap stock.
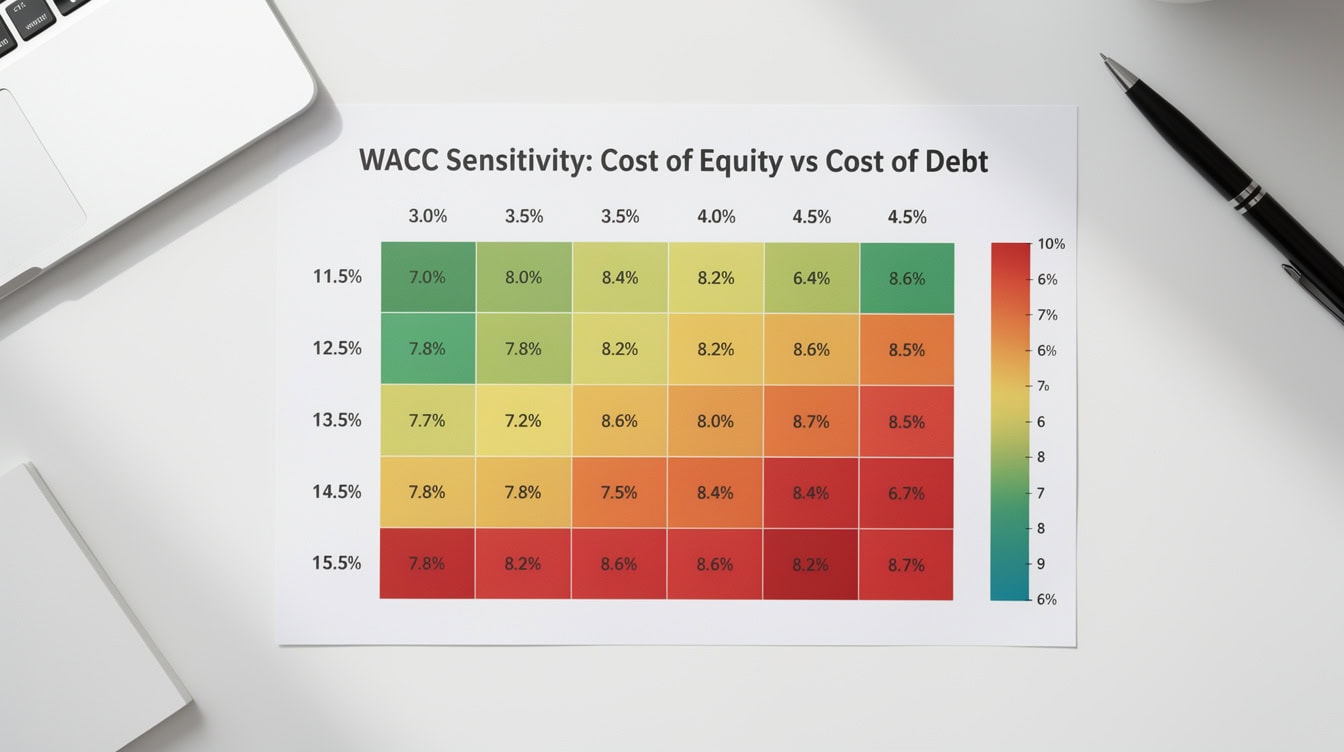
A 2-point swing in cost of equity changes WACC by roughly 2 full points when equity dominates the capital structure, as it does for Tesla.
4 Critical Mistakes That Invalidate Your WACC
These four errors appear in analyst models more often than any others. Each one produces a WACC that looks precise but is fundamentally wrong.
Mistake 1: Using book value of equity instead of market cap.
Book value is an accounting figure that reflects historical costs. Market cap reflects what investors actually think the equity is worth today. For a company like Tesla, book equity might be $60 billion while market cap is $800 billion. Using book value would make the equity weight appear far smaller than it is, artificially inflating the debt weight and lowering WACC.
Mistake 2: Sourcing beta from inconsistent providers without checking the parameters.
Beta varies depending on the regression period (2 years vs. 5 years), return frequency (daily vs. monthly), and the index used as the market proxy. A 2-year daily beta for Tesla can differ from a 5-year monthly beta by 0.5 or more. Always document which provider you used and what parameters they applied. Damodaran’s dataset uses 5-year monthly returns against the S&P 500, which is the most common practitioner standard.
Mistake 3: Ignoring operating lease liabilities in total debt.
Since ASC 842 (the U.S. accounting standard for leases) took effect for public companies in 2019, operating leases appear on the balance sheet as right-of-use assets and lease liabilities. Omitting lease liabilities understates total debt and overstates the equity weight, which lowers WACC and overstates valuation. Always pull the operating lease liability line from the balance sheet and add it to financial debt.
Mistake 4: Using the statutory tax rate instead of the effective tax rate.
The U.S. federal statutory corporate tax rate is 21% (Internal Revenue Service). But most companies pay a different effective rate after credits, deductions, and international structures. Tesla’s effective rate has been as low as 8% in recent years. Using 21% instead of 10% would increase the tax shield, reduce the after-tax cost of debt, and lower WACC, producing an overly optimistic valuation.
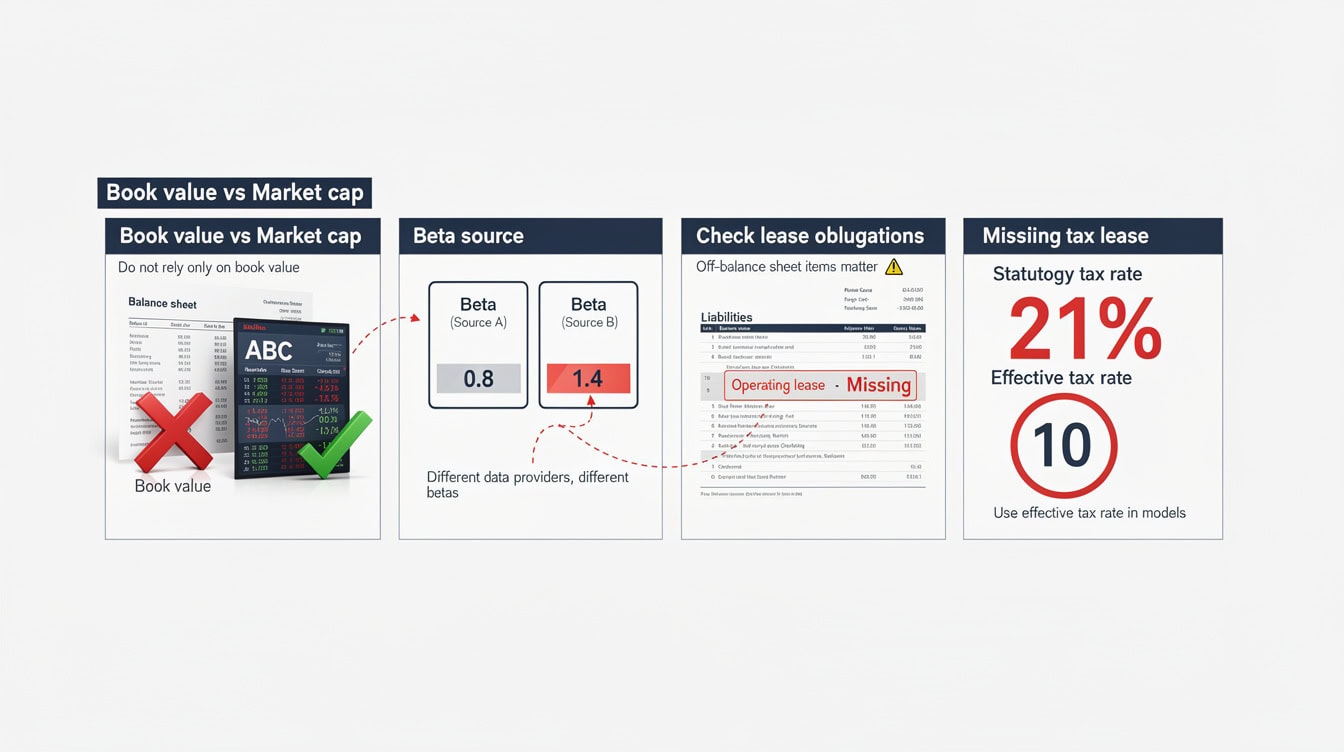
Each of these four errors can shift WACC by 100–300 basis points, enough to reverse a project’s investment decision.
Using Your WACC: From Calculation to Investment Decision
WACC is not just a number to report. It’s a decision rule.
Any project, acquisition, or capital expenditure must generate a return above WACC to create value. If Tesla’s WACC is 13.36%, a new Gigafactory must produce an IRR (Internal Rate of Return, the annualized return on the investment’s cash flows) above 13.36% to be worth funding. Projects below WACC destroy value even if they are profitable in absolute terms.
In a DCF model, WACC is the rate used to discount projected free cash flows back to present value. A 1-percentage-point increase in WACC reduces the terminal value (the value of all cash flows beyond the forecast period) by roughly 10–15% for a stable-growth company. That’s why WACC sensitivity analysis belongs in every valuation presentation.
For real estate and infrastructure projects with different risk profiles, the same logic applies. The Real Estate Financial Model Bundle uses project-specific discount rates built on the same WACC framework.

WACC is a go/no-go threshold. Any investment returning less than WACC transfers wealth from shareholders to the company’s counterparties.
FAQ: Beta Selection, Cost of Debt, and Data Sources
What beta should I use: levered or unlevered?
Use levered beta (also called equity beta) in the WACC formula. Levered beta reflects the financial risk of the company’s actual capital structure, meaning it already accounts for the amplifying effect of debt on equity volatility. Unlevered beta (asset beta) strips out that financial risk and is used when you want to compare operating risk across companies with different capital structures, or when you’re re-levering beta to a target structure. For a standard WACC calculation using the company’s current capital structure, pull the levered beta directly from Bloomberg, Reuters, or Damodaran’s dataset. Damodaran publishes levered and unlevered betas by industry sector annually on his NYU Stern website, updated each January with 5-year monthly regression data against the S&P 500.
How do I calculate cost of debt when a company has multiple bond issues?
The cleanest method is to calculate a weighted average yield-to-maturity (YTM) across all outstanding bond issues, weighted by face value. YTM is the total annualized return an investor earns if they buy the bond today and hold it to maturity, accounting for coupon payments and any premium or discount to par. If YTM data isn’t available for all issues, use the simpler interest expense method: divide total interest expense (from the income statement) by average total debt (beginning plus ending balance divided by 2). For Tesla, $522M interest expense divided by $12,500M average debt gives a pre-tax cost of debt of approximately 4.2%. This method works well for companies with mostly bank debt or private placements where market yields aren’t observable.
How often should I recalculate WACC?
Recalculate WACC at minimum once per year, using updated market cap, debt balances, and the current risk-free rate. You should also recalculate whenever the capital structure changes materially, such as after a large equity issuance, a significant debt repayment, or a major acquisition. The risk-free rate is particularly sensitive: a 50-basis-point move in the 10-year Treasury yield flows directly into cost of equity via CAPM and can shift WACC by 30–50 basis points on its own. For active portfolio management, many practitioners update WACC quarterly.
What equity risk premium should I use?
Use Damodaran’s implied ERP for the U.S. market, updated annually. As of January 2024, his implied ERP was approximately 4.6%. The implied ERP is derived from current S&P 500 prices and analyst earnings forecasts, making it forward-looking rather than purely historical. Historical ERP estimates (based on realized S&P 500 returns minus Treasury yields since 1928) run higher, around 6–7%, but many practitioners prefer the implied figure because it reflects current market pricing. Whichever source you choose, document it and apply it consistently across all companies in a comparative analysis.
Why does WACC differ so much across industries?
WACC varies because both the cost of equity and the capital structure differ by industry. Utility companies carry stable, regulated cash flows, which means low beta (often 0.4–0.7), low cost of equity, and high debt capacity, producing WACCs of 5–7%. Technology growth companies carry high beta (often 1.5–2.5), high cost of equity, and minimal debt, producing WACCs of 10–15%. The industry-average WACC tables published annually by Damodaran show this spread clearly: as of January 2024, the average WACC for U.S. utilities was 6.1% while the average for software companies was 11.8%. Always benchmark your calculated WACC against the industry average as a sanity check.
Can I use WACC for private companies?
Yes, but with adjustments. Private companies don’t have observable market caps or traded betas. The standard approach is to identify a set of publicly traded comparable companies, calculate their unlevered betas, take the median, and then re-lever that beta using the private company’s target capital structure. For the equity weight, use the target or industry-average capital structure rather than a market-observed weight. You may also need to add a size premium (typically 1–3%) to the cost of equity to reflect the additional risk of investing in a smaller, less liquid company. The Real Estate Developer Model applies this approach for project-level discount rates in private development contexts.
What’s the difference between nominal WACC and real WACC?
Nominal WACC includes expected inflation in both the cost of equity and cost of debt, because Treasury yields and equity risk premiums are quoted in nominal terms. Real WACC strips out inflation using the Fisher equation: Real WACC ≈ (1 + Nominal WACC) / (1 + Inflation Rate) − 1. For example, with a nominal WACC of 13.36% and expected inflation of 3%, the real WACC is approximately (1.1336 / 1.03) − 1 = 10.06%. Use real WACC only when discounting real (inflation-adjusted) cash flows. Mixing nominal cash flows with a real discount rate, or vice versa, is one of the most common errors in infrastructure and long-duration project valuations.
Conclusion
WACC is a precise calculation, not an estimate. Every input has a correct source: market cap from live market data, debt from the 10-K, risk-free rate from the Treasury, beta from a documented regression, ERP from Damodaran, and tax rate from the income statement. Tesla’s example shows how these inputs combine into a 13.36% WACC that becomes the go/no-go threshold for every capital allocation decision the company makes.
The four mistakes covered here (book value equity, inconsistent beta, missing lease liabilities, wrong tax rate) are responsible for the majority of WACC errors seen in practice. Avoiding them is straightforward once you know where to look.
I recommend downloading the WACC Calculator Excel Template from eFinancialModels, which includes pre-built CAPM and WACC formulas, a two-variable sensitivity table, and direct links to FRED, SEC EDGAR, and Damodaran’s dataset so you can calculate WACC for any public company in under 10 minutes.
























































