
0 ITEMS

Construction Company Financial Model Excel Template
The Construction Company Financial Model helps users turn a construction business plan into a structured five-year financial forecast. It is designed for contractors, founders, business owners, consultants, analysts, and anyone preparing a funding application, lender package, investor presentation, or internal growth plan. Instead of relying on rough estimates, users can organize revenue assumptions, startup costs, operating expenses, payroll, capital expenditures, cash flow, profitability, and break-even analysis in one editable financial model template built around the economics of a construction company. This template is especially useful for residential construction firms, commercial contractors, renovation and repair businesses, and building service companies that need to understand how project volume, billable hours, hourly rates, customer acquisition cost, subcontractor costs, labor needs, equipment purchases, and overhead affect financial performance. The model provides a practical way to connect marketing spend with new customer acquisition, estimate revenue across multiple construction services, and evaluate whether the business can support its cost structure as it scales. Built for financial planning and decision-making, the Construction Company Financial Model helps users review cash flow dynamics, identify funding requirements, measure profitability, and test low, base, and high scenarios before committing capital. It supports more informed planning around equipment purchases, fleet vehicles, office and workshop setup, fixed monthly overhead, project billing cycles, supplier terms, staffing, and working capital needs. This makes it easier to anticipate cash gaps, assess financial risk, and communicate a clear plan to lenders or stakeholders. The template is fully editable and compatible with Microsoft Excel and Google Sheets, making it easy to tailor assumptions to a specific market, team, pricing strategy, or construction niche. Users can adjust revenue streams, modify costs, update payroll, refine capital expenditure assumptions, and present professional outputs without building a model from scratch. Whether used for launching a new construction company, expanding an existing contractor business, or preparing bank-ready financial projections, this template gives users a ready-to-use framework for evaluating profitability, cash flow, break-even timing, and long-term business performance.


Construction Company Financial Model Overview
The Construction Company Financial Model is a ready-to-use financial model template built to help contractors, founders, business owners, consultants, analysts, and funding applicants plan the economics of a construction business with greater structure and confidence. Construction companies often face large upfront capital requirements, project-based revenue timing, subcontractor costs, material cost fluctuations, payroll needs, equipment purchases, and cash flow pressure between project milestones.
This template brings those moving parts together in one editable model so users can forecast revenue, startup costs, operating expenses, cash flow, profitability, and funding needs over a multi-year planning period. It is useful for residential construction companies, commercial contractors, renovation and repair service providers, and building contractor businesses that need lender-ready projections, investor-facing outputs, or a practical internal planning tool.
By connecting assumptions such as active customers, billable hours, hourly rates, customer acquisition cost, payroll, overhead, capital expenditures, and financing needs, the model helps users replace guesswork with a clear financial roadmap for launch, expansion, or strategic decision-making.
All-in-One Dashboard
The all-in-one dashboard gives users a centralized view of the most important assumptions and outputs in the Construction Company Financial Model. This section is designed to bring together the core drivers of the business, such as revenue growth, project volume, pricing, costs, cash position, profitability, funding needs, and key performance indicators, so users do not have to search through multiple tabs to understand the overall financial picture.
Inputs may include customer acquisition assumptions, service pricing, average billable hours, startup investment, monthly overhead, payroll, direct project costs, and capital expenditure plans. Outputs can include projected revenue, gross profit, EBITDA, net income, cash balance, break-even timing, and return metrics.
For planning and funding purposes, the dashboard is useful because it provides a quick summary of whether the construction company is financially viable under the current assumptions. Lenders, investors, and internal stakeholders can use this view to understand the model’s results quickly, while business owners can use it to monitor how changes to pricing, project volume, or costs affect the overall forecast.
Low, Base, and High Scenario Analysis
The low, base, and high scenario analysis component helps users test how the construction company may perform under different market and operating conditions. Construction businesses are highly sensitive to project demand, customer acquisition cost, labor availability, subcontractor pricing, material costs, payment timing, and overhead decisions, so a single forecast is often not enough for serious planning.
This section allows users to compare a conservative case, an expected case, and an optimistic case by adjusting assumptions such as active customer growth, average billable hours per project, hourly rates, marketing efficiency, gross margin, direct costs, and operating expenses. The outputs may show differences in revenue, EBITDA, cash flow, ending cash balance, payback period, and break-even timing across scenarios.
This is valuable for decision-making because users can stress-test whether the business can survive slower project acquisition, higher costs, or delayed payments, while also understanding the upside potential of stronger demand or improved margins. For funding discussions, scenario analysis demonstrates that the user has considered risk, not just a best-case projection.
Professional Charts
The professional charts component turns financial results into clear visual summaries that can be used for presentations, business plans, lender meetings, investor updates, and internal reviews. Construction financial projections can be complex because revenue may come from multiple service lines, costs may vary by project type, and cash flow may change significantly from month to month depending on billing terms and capital expenditures.
This section helps simplify the story by displaying key outputs such as revenue trends, expense trends, profitability, cash balance, EBITDA growth, margin performance, and possibly service line contribution in presentation-ready charts. Inputs come from the broader financial model, including revenue assumptions, direct project costs, payroll, overhead, capital spending, and financing assumptions.
The resulting visuals help users identify trends, communicate the timing of profitability, show the relationship between growth and cash flow, and make financial data easier for non-financial stakeholders to understand. For a construction company seeking bank financing or investor support, these charts can make the forecast more credible and easier to discuss because they translate detailed calculations into a concise financial narrative.
ROE Components and DuPont Analysis
The ROE components and DuPont analysis section helps users understand what is driving return on equity within the construction company. Rather than showing only a single return metric, this component breaks return on equity into underlying drivers such as profitability, asset efficiency, and financial leverage. In a construction business, these drivers can be influenced by net margins, equipment utilization, fleet and machinery investment, working capital management, debt financing, and the ability to generate revenue from invested capital.
Inputs may include net income, revenue, total assets, equity, debt levels, capital expenditures, and projected balance sheet items. Outputs can show how efficiently shareholder capital is being used, whether returns are improving as the business scales, and which factors are contributing most to ROE. This is useful for investors, owners, and analysts because a construction company can appear profitable while still using capital inefficiently, especially if equipment purchases, vehicles, and facilities are not generating enough project volume. DuPont analysis helps users go deeper than surface-level profitability and evaluate whether the business model is creating sustainable returns on invested equity.
Revenue Inputs
The revenue inputs section is where users define the commercial assumptions that drive the construction company’s top-line forecast. This component may include key assumptions such as number of active customers, marketing spend, customer acquisition cost, average billable hours per project, hourly rates, service mix, and revenue streams across new residential construction, commercial construction, and renovation or repair services.
By linking marketing spend to new customer acquisition and connecting project activity to billable hours and pricing, the model helps users build a more realistic revenue forecast than a simple year-over-year growth estimate. Outputs from this section feed into monthly and annual revenue projections, service-level sales forecasts, gross profit calculations, and scenario analysis. This is especially useful for planning because construction revenue depends on both demand generation and operational capacity.
Users can test how changes in hourly rates, project volume, customer acquisition efficiency, or service mix affect revenue and profitability. For business plans and lender packages, the revenue inputs also make assumptions more transparent, helping stakeholders understand exactly how the company expects to generate sales.
Bank-Ready Reports
The bank-ready reports component provides lender-friendly financial outputs that help users present the construction company’s projections in a structured and professional format. Banks and lenders typically want more than a sales forecast; they want to see income statement projections, cash flow forecasts, balance sheet logic, funding needs, repayment capacity, profitability trends, and whether cash remains positive during the forecast period.
This section consolidates the model’s calculations into reports that can support loan applications, financing discussions, business plan appendices, and stakeholder reviews. Inputs come from the full model, including revenue assumptions, startup costs, operating expenses, payroll, direct costs, capital expenditures, financing assumptions, and working capital timing. Outputs may include projected profit and loss statements, cash flow statements, balance sheet summaries, EBITDA, net income, ending cash balance, and key lender metrics.
For construction companies, these reports are particularly important because large equipment purchases, vehicles, materials, and project payment timing can create liquidity risk. The bank-ready format helps users communicate how much capital is needed, how funds may be used, and how the business expects to generate enough cash flow to operate and repay financing.
Revenue Breakdown
The revenue breakdown section gives users a detailed view of how different construction services contribute to total revenue. Instead of treating the business as one generic revenue line, this component separates income by revenue stream, such as new residential construction, commercial construction, and renovation or repair services. Inputs may include customer volume by service category, average billable hours, pricing or hourly rates, conversion assumptions, project mix, and growth rates over time. Outputs can show monthly and annual revenue by service line, percentage contribution to total revenue, and the impact of each service category on overall growth.
This is valuable because different construction services often have different margins, sales cycles, labor requirements, equipment needs, and cash flow timing. A renovation job may generate faster cash conversion, while commercial construction may create larger projects but longer payment cycles. By reviewing revenue at a more detailed level, users can identify which service lines are most important to growth, which may deserve more marketing investment, and which may require additional staffing or capital. This section also helps lenders and investors understand the business model beyond a single revenue number.
KPI Dashboard
The KPI dashboard component tracks the performance metrics that matter most for managing and evaluating a construction company. While financial statements show the overall results, key performance indicators help users understand the operational drivers behind those results. This section may track metrics such as revenue growth, gross margin, EBITDA margin, net profit margin, cash balance, customer acquisition cost, average revenue per customer, active customers, payback period, return on equity, and potentially industry benchmark comparisons.
Inputs are drawn from revenue assumptions, cost structure, marketing spend, payroll, capital investments, and projected financial statements. Outputs provide a concise view of business health and help users assess whether performance is improving, stable, or under pressure. This is useful for decision-making because construction businesses need to monitor both profitability and liquidity, especially when projects require upfront labor, materials, subcontractors, and equipment usage before full payment is received. The KPI dashboard can also support monthly management reviews, investor updates, and lender conversations by showing whether the company is meeting targets and how its performance compares with planned benchmarks.
Startup Costs and CAPEX Planning
The startup costs and CAPEX planning component helps users estimate the initial investment required to launch or expand a construction company. Construction businesses often require meaningful upfront spending before revenue begins, including heavy equipment, fleet vehicles, tools, workshop or storage facility setup, office setup, software, licensing, insurance, deposits, initial marketing, and working capital reserves. This section allows users to organize those costs in a structured way, separating one-time startup expenses from ongoing operating costs and larger capital expenditures.
Inputs may include the cost of excavators, skid steers, trucks, trailers, safety equipment, office equipment, project management software, facility improvements, and other launch items. Outputs can show total startup capital required, timing of cash outflows, funding gaps, and the impact of capital purchases on cash flow and balance sheet projections. This is useful for budgeting and funding because underestimating startup capital can create operational problems before the business has time to build a project pipeline. By using this section, users can plan how much money is needed before launch, decide whether to buy or lease equipment, and present a clearer use-of-funds schedule to lenders or investors.
Break-Even Analysis
The break-even analysis component helps users identify when the construction company is expected to become profitable and what level of revenue or project activity is required to cover costs. This section connects revenue assumptions, gross margins, fixed overhead, payroll, direct project costs, and operating expenses to determine the point where income is sufficient to offset the company’s cost structure. Inputs may include average pricing, billable hours, direct labor, subcontractor fees, material costs, rent, insurance, administrative expenses, marketing spend, software, salaries, and other fixed monthly expenses. Outputs may show the break-even month, break-even revenue, required project volume, and the relationship between gross margin and fixed costs.
For construction business planning, break-even analysis is especially useful because early-stage companies often face losses while building customer demand and absorbing initial equipment, staffing, and overhead costs. Understanding the break-even point helps users plan working capital, set sales targets, evaluate pricing strategy, and determine whether cost reductions or higher-margin projects are needed. It also gives lenders and stakeholders a clear answer to one of the most important questions in any financial forecast: when the business can sustain itself through operations.
File types:
Excel – Single-User: .xlsx
Excel – Multi-User: .xlsx
Similar ProductsOther customers were also interested in...


 HenrySheykin
Roofing Service Financial Model Excel Template
The Roofing Service Financial Model Template helps contractors, founders, consultants, and business ... Read more
Construction Management Financial Model Excel Temp...
The Construction Management Financial Model helps users turn a construction project management busin... Read more
Remodeling Service Financial Model Excel Template
This Remodeling Service Financial Model financial model template helps contractors, founders, busine... Read more
Property Preservation Financial Model Excel Templa...
The Property Preservation Financial Model helps entrepreneurs, operators, consultants, analysts, and... Read more
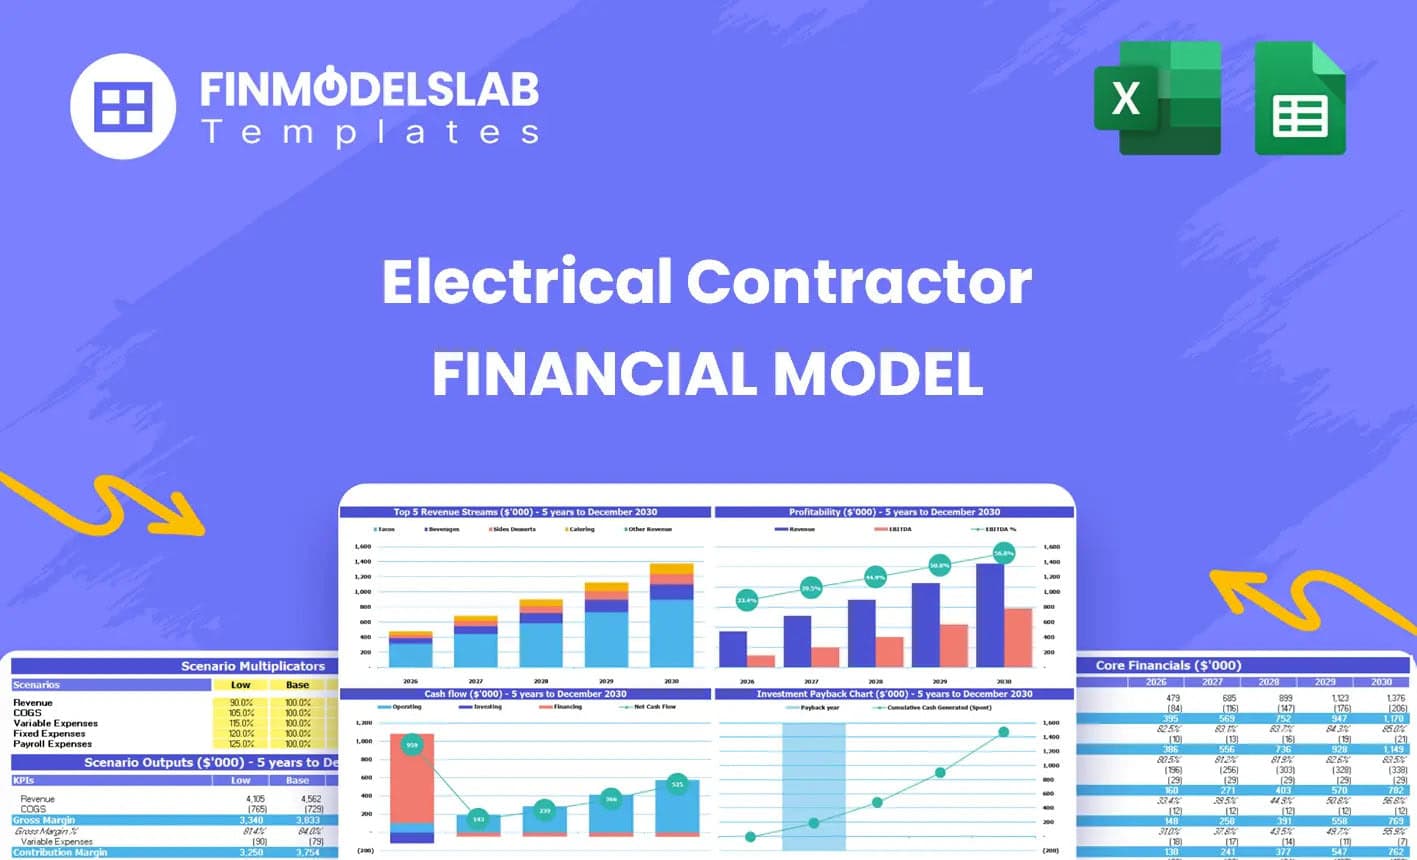
Electrical Contractor Financial Model Excel Templa...
The Electrical Contractor Financial Model helps users build a structured financial forecast for an e... Read more
 Jason Varner
Equipment Rental Cash Flow Model
Highly dynamic financial model that is specific to renting equipment out. High attention paid to the... Read more

Construction Contractor Business – Cash Flow...
This financial model lets the user plan out cash requirements and expected returns of running a cons... Read more

 Giorgos
Artisan Contractor Business – 5 Year Financial M...
Financial Model providing an advanced 5-year financial plan for an Artisan Contractor Business scena... Read more
 David
David
Construction/Engineering Project Business Financia...
3 statement 5 year rolling financial projection Excel model for a startup /existing business engaged... Read more

Carpentry Business – 5 Year Financial Model
Financial Model providing an advanced 5-year financial plan for a startup or operating Carpentry Bus... Read more
Reviews
 Template
We apreciate your templates, your work it is outstanding.
Kindest regards.
213 of 526 people found this review helpful.
Help other customers find the most helpful reviews
Did you find this review helpful?
You must log in to submit a review.