
0 ITEMS

Construction Management Financial Model Excel Template
The Construction Management Financial Model helps users turn a construction project management business plan into a structured five-year financial forecast. Instead of starting with a blank spreadsheet, entrepreneurs, business owners, consultants, analysts, and founders can work from a ready-to-use model designed around the economics of construction management services. The template helps organize revenue assumptions, startup costs, operating expenses, payroll, capital needs, cash flow, profitability, and funding requirements in one connected planning tool. Built for business planning, investor preparation, lender discussions, and internal decision-making, this financial model template gives users a practical way to understand how a construction management company may perform under different assumptions. Users can adjust billable hours, service pricing, customer acquisition costs, staffing plans, fixed overhead, variable costs, and capital expenditures to reflect their own strategy. The model is especially useful for businesses offering full project management, retainers, pre-construction consulting, site coordination, or advisory services where revenue depends on client volume, project scope, hourly rates, and team capacity. The template supports detailed financial planning by connecting operating assumptions to projected financial statements, including profit and loss, cash flow, and balance sheet outputs. It helps users estimate when the business may become profitable, how much startup capital may be required, whether monthly cash balances remain healthy, and how changes in revenue or cost assumptions affect overall performance. With scenario analysis, dashboards, charts, KPI tracking, revenue breakdowns, and investor-focused outputs, the model helps users evaluate risks and opportunities before committing resources. This Construction Management Financial Model is designed to save time while still providing the flexibility needed for serious planning. All key inputs are editable, making it suitable for startups, growing firms, consultants preparing client work, and established construction service businesses considering expansion. Whether the goal is to prepare a business plan, support a funding request, test break-even timing, review profitability, or make better strategic decisions, the template provides a professional framework for building credible financial projections.
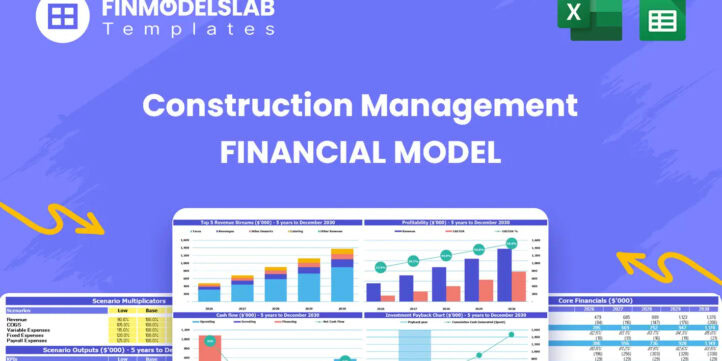


![Excel dashboard screenshot showing revenue projections, cash flow charts, and KPI tables across multiple sections (Revenue, COGS & OPEX, Capital, KPIs). Typical charts include stacked bars and line markers for 2026–2030.] ,"Excel dashboard with financial metrics and charts: revenue, expenses, and cash flow across years 2026–2030.](https://www.efinancialmodels.com/wp-content/uploads/edd/2026/05/construction-management-financial-model-dashboard-financialmodelslab_43984c84-c980-47d4-9271-e70d2be00fd6-scaled.jpg "construction-management-financial-model-dashboard-financialmodelslab_43984c84-c980-47d4-9271-e70d2be00fd6 | eFinancialModels")


Financial Model Overview
The Construction Management Financial Model is a ready-to-use financial model template built for entrepreneurs, founders, consultants, analysts, and business owners who need to plan, evaluate, or present the financial outlook of a construction management business. It brings together the core assumptions that drive this type of company, including billable service revenue, project management retainers, pre-construction consulting, customer acquisition, staffing, operating expenses, capital investment, cash flow, and profitability.
The model is designed to help users replace guesswork with a structured forecast that can support business planning, funding discussions, lender presentations, investor reviews, and internal decision-making. Because construction management businesses often depend on service capacity, client volume, hourly rates, milestone billing, subcontractor coordination, and disciplined cash management, this template gives users a practical framework for testing whether the business can scale profitably over a five-year period. The inputs are editable, the outputs are automated, and the structure is designed to help non-financial users create a more professional and defensible financial plan without building the spreadsheet from scratch.
All-in-One Dashboard
The all-in-one dashboard gives users a central view of the most important inputs and outputs in the Construction Management Financial Model. This section is useful because it brings key assumptions and financial results into one place, allowing users to quickly review the business plan without moving through every supporting schedule. Inputs may include revenue drivers, customer assumptions, pricing, staffing levels, cost percentages, financing assumptions, and timing details, while outputs may show projected revenue, gross profit, EBITDA, net income, cash balance, margins, and other high-level performance indicators.
For a construction management company, the dashboard helps connect operational choices, such as how many clients are served, how many hours are billed per month, and how much is spent on marketing or payroll, to the financial results that investors and lenders care about. It is especially helpful for reviewing the model before a meeting, checking whether the forecast remains aligned with the business plan, and identifying areas that need further refinement. Instead of relying on scattered spreadsheet tabs, users can use the dashboard as a control center for financial planning and decision-making.
Low, Base, and High Scenario Analysis
The low, base, and high scenario analysis section helps users test how the construction management business may perform under different market and operating conditions. This component is valuable because construction-related revenue can vary depending on client acquisition, project timing, construction activity, contract size, billing rates, and the company’s ability to maintain utilization across its team.
Users can model a conservative case with slower customer growth or lower billable hours, a base case that reflects the expected operating plan, and a high case that shows upside potential from stronger demand, higher pricing, or improved operating efficiency. The model can then translate those assumptions into different revenue, margin, cash flow, and profitability outcomes.
This gives founders and business owners a more realistic view of risk and opportunity instead of relying on one fixed forecast. For funding preparation, scenario analysis also helps demonstrate that management understands the key drivers of the business and has considered both downside protection and growth potential. It can support strategic decisions such as when to hire additional project managers, how much marketing budget to commit, whether to expand service lines, and how much working capital should be kept available if results are below plan.
Professional Charts
The professional charts section converts financial projections into visual reports that are easier to review, explain, and present to stakeholders. In a construction management financial plan, the underlying data can become detailed very quickly, especially when the model includes multiple revenue streams, monthly cash flow, payroll assumptions, expense categories, profitability measures, and multi-year projections. Charts help simplify this complexity by showing trends in revenue growth, gross margin, EBITDA, net profit, cash balance, cost structure, and other performance indicators.
Users can rely on these visuals when preparing investor presentations, lender packages, board updates, internal strategy reviews, or business plan exhibits. The charts are also useful for spotting patterns that may not be obvious in rows of numbers, such as a seasonal cash dip, a rising expense ratio, a delayed break-even point, or a widening gap between revenue growth and payroll growth.
For a construction management company, visual reporting can make it easier to communicate how the business expects to grow from early client acquisition to a more mature operation with recurring project work, higher utilization, and improved margins. This section helps users present their financial story in a clear and polished way.
ROE Components and DuPont Analysis
The ROE components and DuPont analysis section helps users understand how efficiently the construction management business may generate returns on shareholder capital. Return on equity is often viewed as a high-level investor metric, but the DuPont approach breaks it into more useful operating pieces, typically showing how profitability, asset efficiency, and leverage contribute to overall performance. In this model, the section can help users see whether return on equity is being driven mainly by strong margins, efficient use of assets, or the capital structure of the business.
For a construction management company, this is especially useful because the business may have a mix of professional service revenue, technology investment, vehicles, office setup, working capital needs, and financing assumptions. Inputs may include net income, revenue, assets, equity, debt, and operating profitability, while outputs help explain whether the company is using its resources effectively.
This section supports investor conversations by moving beyond basic sales and profit projections and showing how financial performance translates into capital returns. It can also help management identify improvement opportunities, such as increasing billable utilization, improving margins, reducing underused assets, or choosing a more balanced financing structure.
Revenue Inputs
The revenue inputs section is where users define the assumptions that drive the sales forecast for the construction management business. This component is one of the most important parts of the Construction Management Financial Model because it links practical commercial assumptions to projected revenue.
Inputs may include service lines such as full project management, initial project retainers, and pre-construction consulting, along with pricing, billable hours, client volume, marketing budget, customer acquisition cost, customer allocation, retention, growth rates, and timing of new customer acquisition. For example, a user can estimate how many clients are acquired from a specific marketing budget, how many monthly hours each client requires, and what hourly rate or retainer amount applies to each service category.
The model can then calculate monthly and annual revenue over the forecast period. This is useful for planning because revenue in construction management is not simply a single sales number; it depends on client mix, project complexity, capacity, and the ability to consistently convert prospects into paying customers. By making these drivers editable, the template allows users to tailor the forecast to their specific market, pricing strategy, and operating model while maintaining a structured and credible approach.
Bank-Ready Reports
The bank-ready reports section organizes financial outputs in a format suitable for lenders, funding partners, and other financial stakeholders. Banks and lenders typically want to see more than a simple revenue forecast. They often review profitability, cash flow, debt capacity, balance sheet strength, working capital, repayment ability, and the assumptions behind the numbers.
This component helps users present projected financial statements and summary outputs in a clear, lender-friendly structure. It may include automated income statement, cash flow statement, balance sheet, debt assumptions, financing inputs, and key summaries that show how the business expects to generate enough cash to meet obligations. For a construction management company, these reports can be especially important if the business needs funding for platform development, vehicles, office setup, hiring, marketing, or early operating expenses.
The reports help show whether the launch plan is financially realistic, whether cash reserves are adequate, and whether the business can support any planned financing. This section is useful for loan applications, investor due diligence, grant submissions, partner discussions, or internal approval processes because it translates detailed model assumptions into professional financial outputs that stakeholders can evaluate more easily.
Revenue Breakdown
The revenue breakdown section provides a detailed view of how total revenue is generated across the company’s different service lines and customer categories. Rather than showing only one consolidated sales figure, this component helps users understand which parts of the construction management business contribute the most to growth, margins, and cash generation.
Inputs may include pricing by service, billable hours, retainer amounts, client counts, service mix, monthly ramp-up assumptions, and growth rates for each revenue stream. Outputs may show revenue by full project management, initial project retainers, pre-construction consulting, or other services the user adds to the model. This is useful because each revenue stream may behave differently. Full project management may generate higher recurring monthly billings but require more staffing capacity, retainers may improve cash flow early in a project, and consulting services may provide flexible revenue with different margin characteristics.
By breaking revenue into specific streams, users can identify which services deserve more marketing focus, which pricing assumptions need adjustment, and how changes in client mix affect overall profitability. This section also improves the credibility of the forecast because investors and lenders can see the operational logic behind revenue growth instead of reviewing a single unexplained total.
KPI Dashboard
The KPI dashboard tracks performance metrics that help users evaluate whether the construction management business is operating efficiently and moving toward its financial goals. A strong forecast should not only show revenue and profit; it should also help users monitor the drivers behind those outcomes. This section may include metrics such as EBITDA margin, gross margin, customer acquisition cost, revenue per client, billable hours, cash balance, payroll as a percentage of revenue, operating expense ratios, return on equity, payback period, and other performance indicators relevant to the business.
These KPIs can be used to compare projections against targets, industry benchmarks, or management expectations. For a construction management company, KPI tracking is valuable because operational efficiency is closely tied to profitability. If customer acquisition cost rises, billable utilization falls, payroll grows faster than revenue, or project-related costs increase, margins can change quickly.
The KPI dashboard helps users identify these issues early and make better decisions about pricing, hiring, marketing spend, cost control, and growth strategy. It also supports stakeholder communication by presenting a concise summary of financial health and operating performance in a format that is easier to understand than detailed spreadsheet schedules alone.
Startup Costs and Capital Expenditure Planning
The startup costs and capital expenditure planning section helps users estimate the initial investment required to launch or expand a construction management business. This component is important because early-stage construction management companies may need to fund several cost categories before revenue becomes stable, including office setup, technology systems, proprietary platform development, vehicles for site visits, software subscriptions, professional fees, licenses, insurance, initial marketing, deposits, and working capital reserves.
Users can adjust each line item to match their own launch strategy, whether they are starting a lean consulting operation, building a more technology-enabled project management platform, or preparing a larger team-based firm. The section helps generate a clear view of total capital required, timing of spending, and the amount of funding needed before operations can support themselves. It also connects startup investment to later financial statements, so users can see how capital expenditures affect cash flow, depreciation, assets, and financing needs.
For business planning and fundraising, this section is especially useful because it gives investors, lenders, and founders a transparent breakdown of where the money will go and why the requested funding amount is necessary. It helps prevent underestimating launch needs and supports more disciplined budgeting from the start.
Break-Even Analysis
The break-even analysis section helps users identify when the construction management business may generate enough revenue to cover its total costs. This component is essential for founders, investors, and lenders because it shows the point at which the business moves from operating at a loss to reaching sustainable profitability. Inputs may include fixed overhead, payroll, variable costs, subcontractor-related costs, marketing spend, customer acquisition assumptions, pricing, billable hours, revenue mix, and gross margin assumptions.
The model can use these inputs to estimate the month or year in which revenue equals total expenses and to show how changes in pricing, client volume, cost structure, or service mix affect the break-even point. For a construction management company, this is particularly useful because early costs such as hiring, technology, insurance, marketing, and office setup may occur before the client base is fully developed. Break-even analysis helps users determine whether the business plan is realistic, how much runway may be needed, and which operational levers can accelerate profitability.
Similar ProductsOther customers were also interested in...


 HenrySheykin
Roofing Service Financial Model Excel Template
The Roofing Service Financial Model Template helps contractors, founders, consultants, and business ... Read more
Remodeling Service Financial Model Excel Template
This Remodeling Service Financial Model financial model template helps contractors, founders, busine... Read more
Property Preservation Financial Model Excel Templa...
The Property Preservation Financial Model helps entrepreneurs, operators, consultants, analysts, and... Read more

Construction Company Financial Model Excel Templat...
The Construction Company Financial Model helps users turn a construction business plan into a struct... Read more
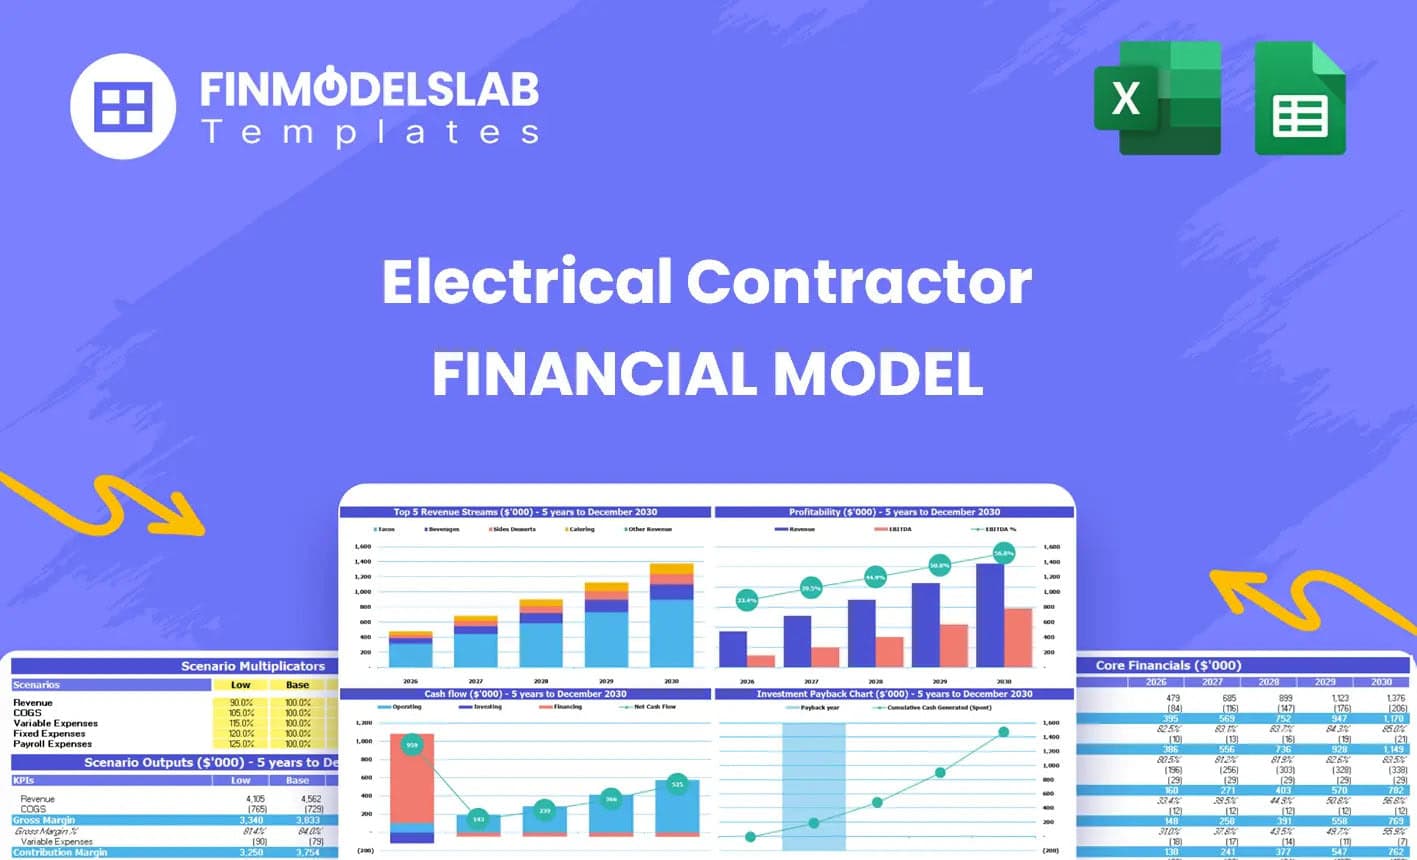
Electrical Contractor Financial Model Excel Templa...
The Electrical Contractor Financial Model helps users build a structured financial forecast for an e... Read more

 Giorgos
Artisan Contractor Business – 5 Year Financial M...
Financial Model providing an advanced 5-year financial plan for an Artisan Contractor Business scena... Read more

 David
David
Construction/Engineering Project Business Financia...
3 statement 5 year rolling financial projection Excel model for a startup /existing business engaged... Read more

Carpentry Business – 5 Year Financial Model
Financial Model providing an advanced 5-year financial plan for a startup or operating Carpentry Bus... Read more
You must log in to submit a review.