
0 ITEMS

Electrical Contractor Financial Model Excel Template
The Electrical Contractor Financial Model helps users build a structured financial forecast for an electrical contracting business without starting from a blank spreadsheet. It is designed to support practical planning around service revenue, customer acquisition, project mix, labor capacity, material costs, overhead, cash flow, profitability, and funding needs. Whether you are launching a new electrical services company, expanding an existing contractor business, preparing a business plan, or presenting numbers to lenders and investors, this template gives you a ready-to-use framework for turning assumptions into clear financial projections. Built for entrepreneurs, business owners, consultants, analysts, founders, and people preparing funding documents, the model organizes the major financial drivers of an electrical contractor operation in one editable file. Users can adjust revenue assumptions across residential services, commercial contracts, smart home projects, and new construction work, while also planning startup costs, operating expenses, payroll, direct costs, and capital expenditures. The template is useful for estimating the level of investment required, understanding monthly performance, and identifying how pricing, billable hours, service mix, customer acquisition, and staffing choices affect long-term results. The model includes five-year projections that connect revenue, expenses, profit, cash flow, and key performance metrics. It helps users evaluate whether the business can cover fixed overhead, manage working capital, absorb material and labor costs, and reach sustainable profitability. The structure supports break-even analysis, scenario planning, KPI tracking, bank-ready reports, visual charts, and investor-focused metrics such as payback, return on equity, and internal rate of return. This makes it suitable for both internal decision-making and external presentations. Instead of relying on rough estimates, users can work from a customizable financial planning tool tailored to the electrical contracting industry. The template can be edited in Microsoft Excel or Google Sheets, making it practical for collaboration with partners, advisors, lenders, or management teams. It saves time, improves consistency, and helps users test decisions before committing cash, hiring technicians, purchasing service vans, bidding for larger jobs, or scaling operations. For anyone building a financial plan for an electrical contractor business, this model provides a professional starting point for forecasting, budgeting, and making more confident business decisions.


Financial Model Overview
The Electrical Contractor Financial Model is a ready-to-use financial model template built to help users plan, forecast, and evaluate an electrical contracting business with greater structure and clarity. Electrical contractors manage several moving parts at once, including hourly labor rates, service calls, commercial contracts, smart home installations, new construction work, material costs, technician productivity, service vans, tools, payroll, rent, insurance, fuel, permits, and working capital.
This template brings those drivers into one organized model so entrepreneurs, business owners, consultants, analysts, and funding applicants can estimate revenue, startup investment, operating expenses, cash flow, profitability, and long-term financial performance. It is useful for launching a new electrical services company, preparing a bank or investor presentation, comparing growth scenarios, or improving the financial planning process for an existing contractor business. With editable assumptions, pre-built calculations, and professional outputs, users can replace guesswork with a practical forecast that supports planning, budgeting, funding discussions, and operational decision-making.
All-in-One Dashboard
The all-in-one dashboard gives users a central view of the model’s most important inputs and outputs, making it easier to understand the financial position of the electrical contractor business without digging through every calculation tab. This section is designed to summarize the core assumptions that drive the forecast, such as customer acquisition, service mix, pricing, labor utilization, material costs, fixed expenses, payroll, capital spending, and financing needs. It also presents key outputs such as revenue, gross profit, EBITDA, net income, cash balance, payback period, and other high-level metrics that matter to owners, lenders, and investors.
For an electrical contractor, this is especially useful because profitability depends on the relationship between billable hours, technician productivity, job pricing, direct costs, and overhead absorption. The dashboard helps users quickly see whether the business plan is financially balanced, whether cash reserves appear sufficient, and whether growth targets are supported by the cost structure. It is also helpful for presentations, internal reviews, and decision-making because it condenses the model into an easy-to-read summary that can be updated as assumptions change.
Low Base High Scenario Analysis
The low, base, and high scenario analysis section helps users test how the electrical contractor financial forecast changes under different business conditions. Instead of relying on one fixed projection, users can compare conservative, expected, and optimistic cases by adjusting assumptions such as customer acquisition cost, marketing budget, average billable hours, service pricing, project volume, material cost percentage, labor efficiency, technician hiring pace, or overhead requirements.
This is valuable because electrical contracting businesses can experience variability in demand, project timing, commercial contract wins, construction cycles, labor availability, and supplier pricing. A low case may show what happens if customer growth is slower or costs are higher than expected, while a high case can show the potential upside of stronger demand, better scheduling, higher utilization, or expanded service offerings. The outputs help users evaluate the impact on revenue, margins, cash flow, break-even timing, and funding requirements. This component supports better risk management and planning because it allows founders and business owners to prepare for multiple outcomes rather than building a plan around a single assumption set.
Professional Charts
The professional charts section converts the financial forecast into visual reports that are easier to interpret and present to stakeholders. It may include charts for revenue growth, expense categories, EBITDA, net profit, cash balance, revenue mix, margin trends, and other key financial indicators. For an electrical contractor business, charts are useful because they make it easier to show how revenue scales from residential services, commercial contracts, smart home projects, and new construction work while costs grow across labor, materials, vehicles, rent, insurance, marketing, and administrative expenses.
Visual outputs help users identify patterns that may not be obvious in rows of numbers, such as periods of cash pressure, margin improvement, rapid overhead growth, or shifts in service profitability. These charts can support business plan presentations, lender meetings, investor discussions, partner reviews, and internal strategy sessions. By providing presentation-ready visuals, the template helps users communicate the financial story of the electrical contractor business in a clear and professional format, making the model more useful for both analysis and decision-making.
ROE Components and DuPont Analysis
The ROE components and DuPont analysis section helps users understand the drivers behind return on equity rather than looking at one return metric in isolation. This component breaks performance into financial relationships that may include profitability, asset efficiency, and leverage, helping users see how net margin, asset utilization, and capital structure influence overall return.
For an electrical contractor business, this is important because returns can be affected by several operational and financing decisions, including how much equipment and vehicle investment is required, how efficiently technicians generate revenue, how much profit remains after labor and material costs, and whether growth is funded through owner capital, debt, or retained earnings.
By analyzing return on equity in a structured way, users can better understand whether weaker returns are caused by low margins, underused assets, excessive overhead, or an inefficient financing structure. The output is useful for investors, lenders, owners, and analysts who want to evaluate not just whether the business is profitable, but whether it is using capital effectively. This section supports more informed decisions around pricing, asset purchases, debt levels, growth investment, and profitability improvement.
Revenue Inputs
The revenue inputs section is where users define the commercial assumptions that drive sales for the electrical contractor business. This may include marketing budget, customer acquisition cost, customer volume, conversion assumptions, service categories, hourly rates, average job duration, project frequency, and the mix between residential services, commercial contracts, smart home installations, and new construction work. Because an electrical contractor can earn revenue through multiple service lines, this section gives users a more realistic way to model growth than using one generic sales number.
For example, small residential jobs may have different hourly rates, margins, scheduling requirements, and repeat patterns than larger construction or commercial projects. The template uses these inputs to calculate revenue over time and connect customer demand with capacity, labor needs, and cost assumptions. This component is useful because it allows users to test how changes in pricing, marketing spend, customer acquisition efficiency, service mix, or billable hours affect the overall forecast. It also helps create a more defensible business plan because the revenue projection is tied to specific operating assumptions rather than unsupported top-down estimates.
Bank-Ready Reports
The bank-ready reports section provides structured financial outputs that can be shared with lenders, investors, advisors, partners, or internal decision-makers. These reports typically include forecasted profit and loss, cash flow, balance sheet outputs, key assumptions, and relevant financial metrics that help stakeholders evaluate the business.
For an electrical contractor, bank-ready reporting is especially important when seeking funding for service vans, tools, equipment, working capital, office setup, hiring, insurance, or expansion. Lenders often want to see whether the business can generate enough cash to cover operating costs, debt service, payroll, and ongoing investment needs. Investors and partners may focus on profitability, payback, growth potential, return on equity, and the credibility of the underlying assumptions.
This section helps users present the forecast in a clean and organized format, reducing the time required to prepare financial documentation. It also improves credibility because the financial statements and summaries are connected to the same editable assumptions used throughout the model. Users can update the forecast as their plan changes and quickly regenerate outputs for funding conversations or business reviews.
Revenue Breakdown
The revenue breakdown section gives users a detailed view of how different service lines contribute to total sales. Instead of showing only one revenue figure, the model separates income by categories such as residential services, commercial contracts, smart home projects, and new construction work. This is valuable for an electrical contractor because each revenue stream can have a different pricing structure, demand pattern, margin profile, and operational requirement. Residential service calls may provide steady volume but smaller job sizes, while commercial work and new construction projects may generate larger revenue amounts with different scheduling, billing, and material cost dynamics.
Smart home projects may involve specialized labor, premium pricing, and technology-related costs. By breaking revenue into detailed streams, users can identify which services are expected to drive growth, which are most profitable, and how changes in the mix affect margins and cash flow. This component supports better pricing decisions, marketing allocation, staffing plans, and strategic focus. It also helps users communicate the business model more clearly in a business plan or lender presentation by showing where revenue is expected to come from and how it evolves over the forecast period.
KPI Dashboard
The KPI dashboard tracks performance metrics and benchmark-style indicators that help users evaluate the health of the electrical contractor business. This section may include metrics such as revenue growth, gross margin, EBITDA margin, net profit margin, cash balance, customer acquisition cost, payback period, return on equity, billable hour performance, cost ratios, and other operating indicators relevant to an electrical services company. For business owners and managers, KPIs are useful because they translate the financial forecast into practical measurements that can be monitored over time.
If margins are too low, the model can help users investigate whether the issue comes from pricing, material costs, labor efficiency, or overhead. If cash flow is tight, the KPI dashboard can help highlight the timing of receivables, capital expenditures, payroll, or seasonal revenue patterns. The dashboard is also useful for comparing projected performance against industry expectations and internal targets. For consultants, analysts, and founders preparing funding materials, this section provides a concise way to show that the business plan is being evaluated through measurable financial and operational indicators rather than broad assumptions alone.
Startup Cost and CAPEX Planning
The startup cost and CAPEX planning section helps users estimate the initial investment required to launch or expand an electrical contractor business. This component may include service vans, major tools and equipment, office and warehouse setup, IT systems, software, licensing, insurance deposits, branding, initial marketing, permits, safety equipment, training, working capital, and other pre-opening or expansion-related costs. Electrical contractors often require meaningful upfront investment before revenue begins, especially when technicians need vehicles, tools, inventory, uniforms, scheduling systems, and field equipment to operate efficiently.
This section organizes those costs so users can understand how much capital is needed, when the spending occurs, and how the investment affects the balance sheet and cash flow forecast. It is useful for funding preparation because banks and investors generally want to know exactly how requested capital will be used. It also supports internal budgeting by helping owners avoid underestimating launch costs or overlooking cash reserves needed for the early operating period. By separating one-time startup costs from ongoing expenses, the template gives users a clearer picture of both the initial funding requirement and the recurring cost structure of the business.
Break-Even Analysis
The break-even analysis section helps users identify when the electrical contractor business is expected to cover its total costs and begin generating sustainable profit. This component uses revenue assumptions, direct costs, payroll, fixed overhead, startup spending, and operating expenses to estimate the point at which income is sufficient to offset the cost structure. For an electrical contractor, break-even timing can be influenced by pricing, customer volume, billable technician hours, service mix, material cost percentage, fuel costs, rent, insurance, administrative staffing, and the pace of marketing investment.
Understanding break-even is useful because it gives owners, founders, and lenders a clear milestone to evaluate early business performance. If the forecast shows that break-even is delayed, users can test changes such as increasing rates for specialized services, improving scheduling efficiency, controlling variable costs, focusing on higher-margin work, or reducing unnecessary overhead. If the model shows a faster break-even timeline, users can evaluate whether the assumptions are realistic and whether the business has enough capacity to deliver the required volume. This section supports decision-making by turning profitability planning into a measurable target, helping users manage risk and plan cash reserves before and after launch.
File types:
Excel – Single-User: .xlsx
Excel – Multi-User: .xlsx
Similar ProductsOther customers were also interested in...



 David
David
Construction/Engineering Project Business Financia...
3 statement 5 year rolling financial projection Excel model for a startup /existing business engaged... Read more
 City Finance
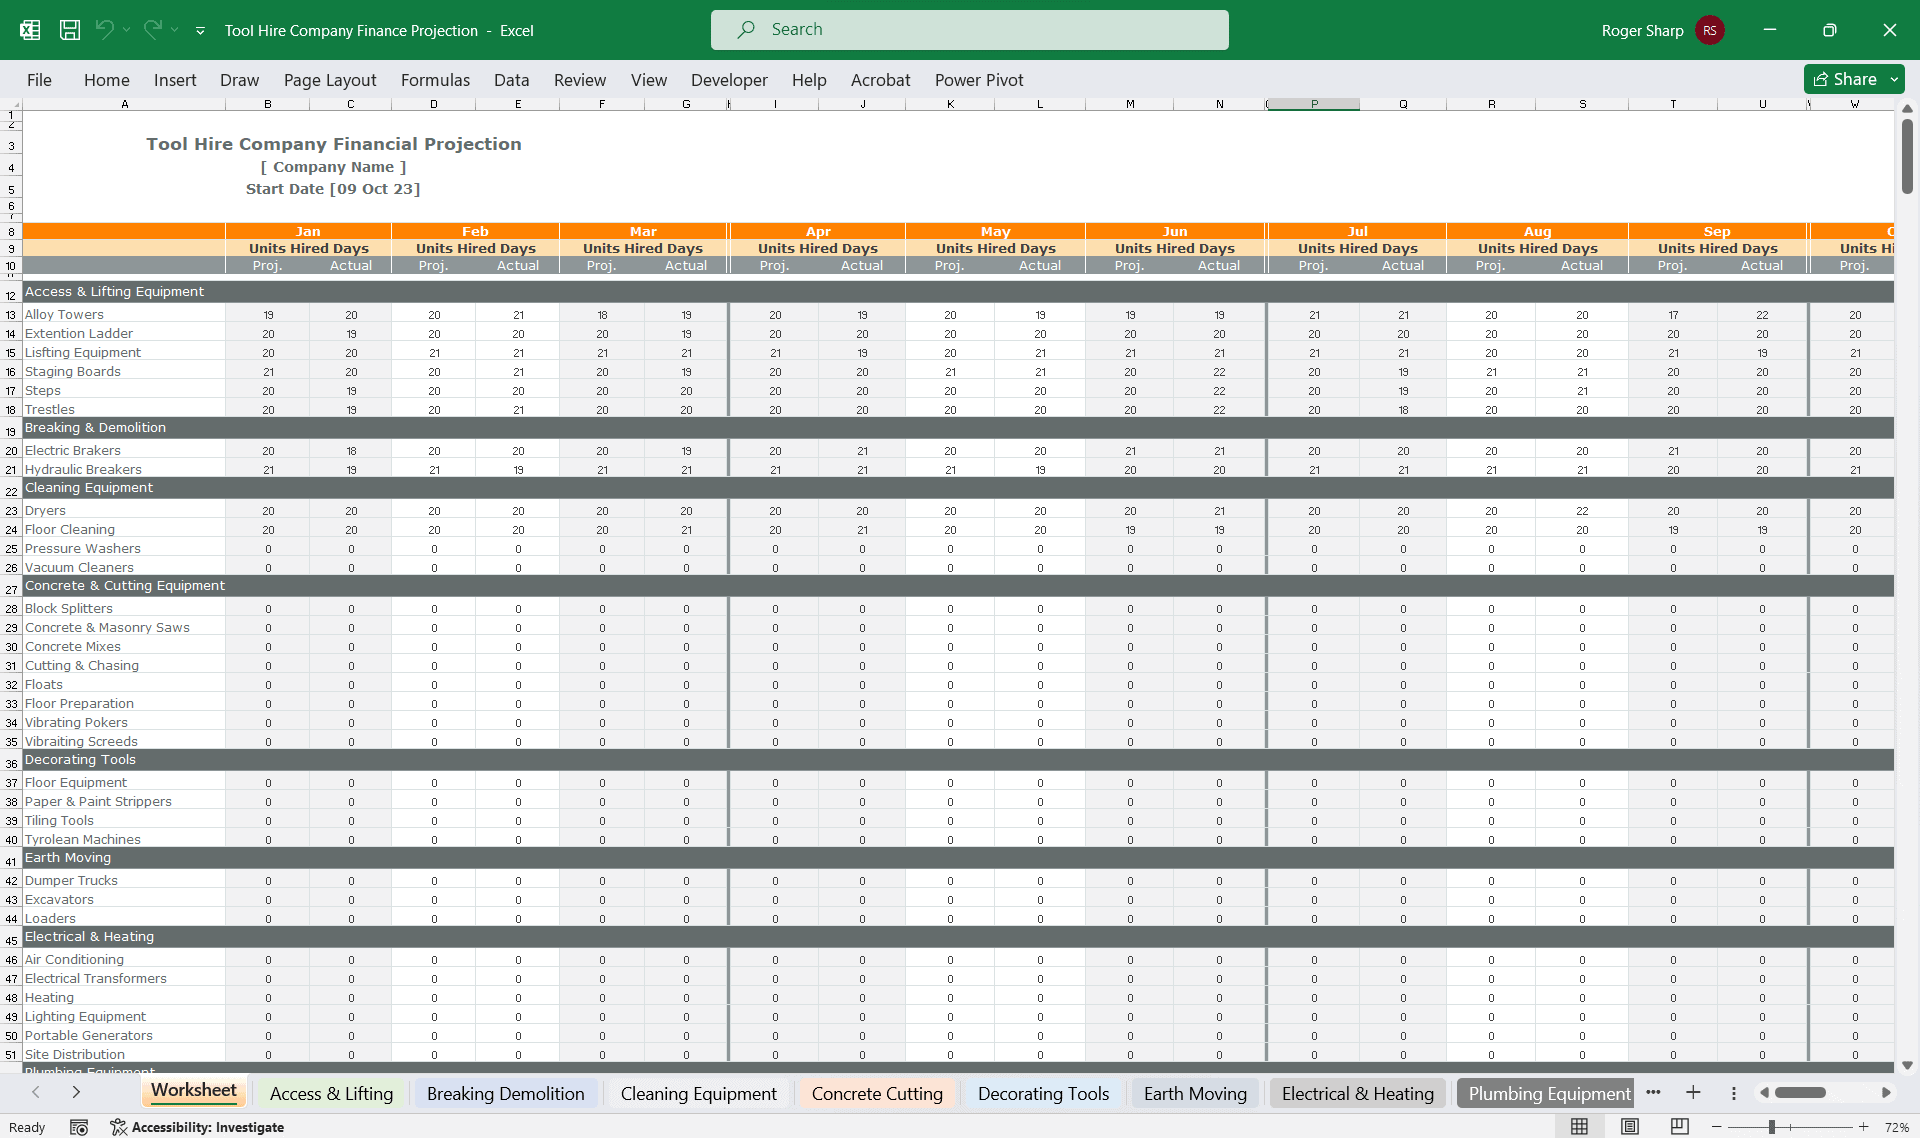
Tool Hire Company Finance Model
A very comprehensive editable Excel spreadsheet for tracking your tool hire financials throughout th... Read more

 SB Consulting
Project Finance Excel Model – 10 Year Projec...
The template creates a financial model for your individual project finance initiative The model is s... Read more
 Bassem Mneimne
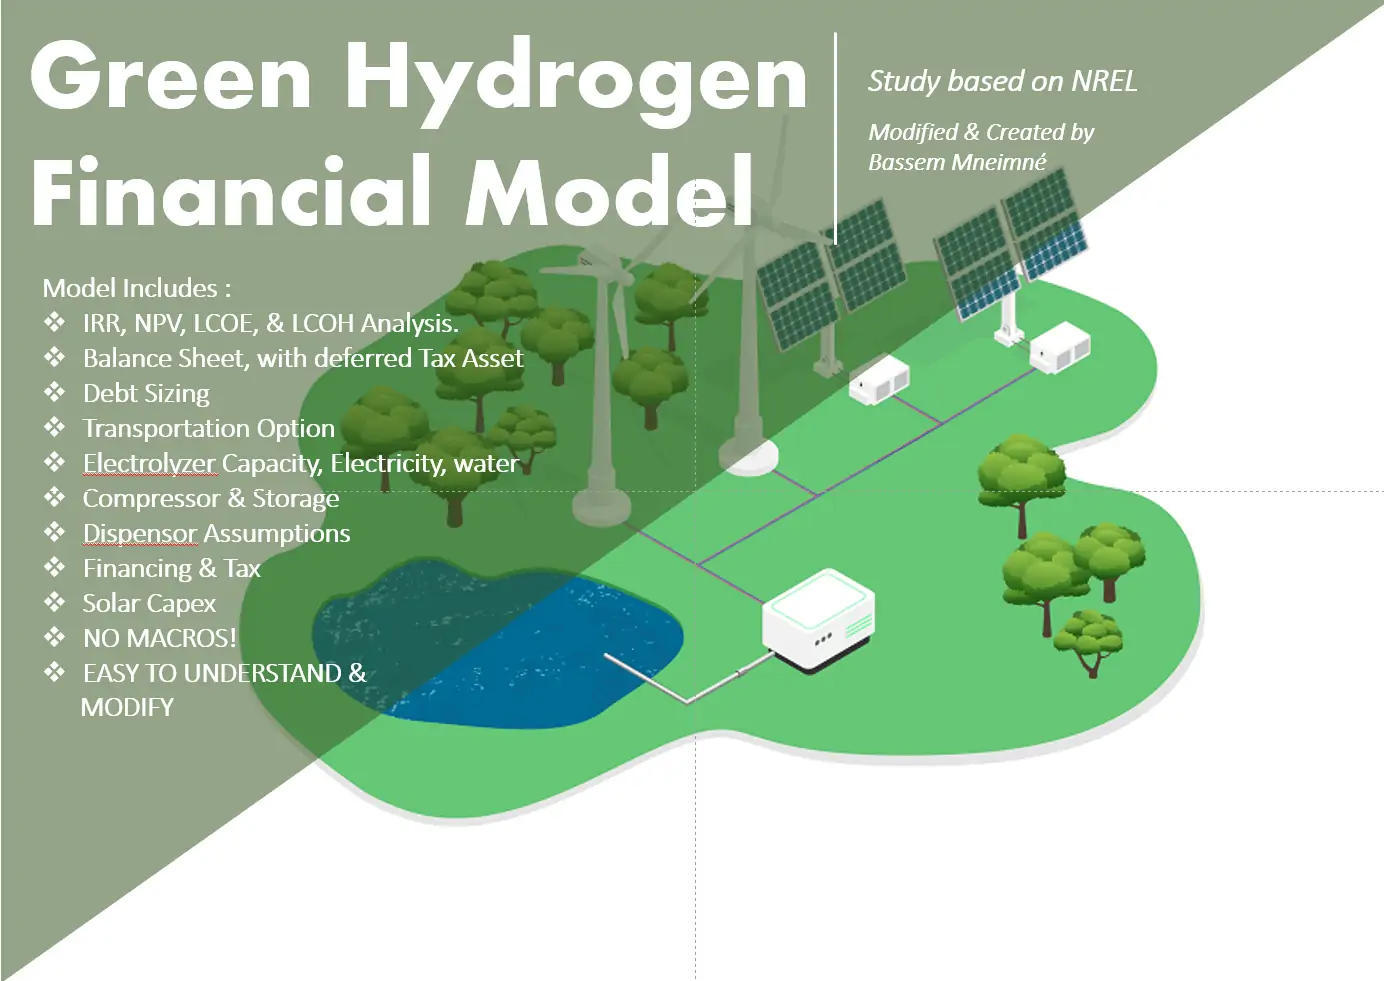
Green Hydrogen (Simple Electrolysis Financial Mode...
The Model Incorporates data provided by different available sources to Model an Electrolysis financi... Read more

 Pushkar
Discounted Cash Flow (DCF) Valuation Excel Model (...
This is a very detailed and user-friend financial model with the three financial statements i.e. Inc... Read more

 Giorgos
Artisan Contractor Business – 5 Year Financial M...
Financial Model providing an advanced 5-year financial plan for an Artisan Contractor Business scena... Read more

Carpentry Business – 5 Year Financial Model
Financial Model providing an advanced 5-year financial plan for a startup or operating Carpentry Bus... Read more

 eFinancialModels
Crane Truck Rental Company Financial Model
Step into the world of crane rental business success with our Crane Truck Rental Company Financial M... Read more

Plumbing Business Financial Model – 5 Year Forec...
Financial Model presenting an advanced 5-year financial plan for a startup or operating Plumbing Bus... Read more
You must log in to submit a review.