
0 ITEMS

Game Center Business Plan Financial Model Excel Template
The Game Center Financial Model Financial Model Template helps entrepreneurs, founders, business owners, consultants, and analysts turn a game center concept into a structured five-year financial forecast. It is designed for gaming cafes, arcade lounges, entertainment centers, esports venues, video game lounges, and mixed-use game centers that generate income from gaming time, arcade play, events, tournaments, food and beverage sales, and related add-ons. Instead of building a financial model from scratch, users can start with a ready-to-use framework that connects revenue assumptions, startup costs, operating expenses, payroll, cash flow, profitability, and investment needs in one organized planning tool. This template is useful for business planning, investor presentations, loan applications, internal budgeting, and early-stage decision-making. Users can enter assumptions for customer traffic, pricing, utilization, revenue mix, cost of goods sold, staffing levels, rent, utilities, marketing, equipment purchases, and other financial drivers. The model then helps translate those inputs into projected financial statements, cash flow forecasts, profit expectations, and key performance indicators. This gives users a clearer view of whether the business can support its cost structure, when it may become profitable, and how much capital may be needed before and after launch. For a game center, financial planning is especially important because the business often requires meaningful upfront investment in leasehold improvements, arcade machines, gaming PCs, consoles, furniture, software, kitchen or snack bar setup, deposits, and launch marketing. The template helps organize these startup costs while also forecasting ongoing expenses such as payroll, rent, supplies, maintenance, payment processing, utilities, insurance, and marketing. By reviewing the relationship between visitor volume, spending per customer, margins, and fixed costs, users can make more informed decisions about pricing, staffing, capacity, promotions, and expansion timing. The Game Center Financial Model also supports profitability analysis, break-even analysis, cash flow monitoring, and scenario planning so users can evaluate base, conservative, and optimistic outcomes. This is valuable for testing assumptions before committing capital, presenting a credible plan to lenders or investors, and managing the business after opening. The template is fully editable, compatible with Excel and Google Sheets, and built to save time while giving users a professional financial planning structure tailored to the game center business model.


![Excel dashboard titled Returns on Invested Capital for ABC Company with a bar chart and ROIC line for 2026–2030 (informational image).] ,](https://www.efinancialmodels.com/wp-content/uploads/edd/2026/05/game-center-financial-model-roic-financialmodelslab_a89c3807-968f-4e53-ad38-bc84d7a5e5d6-scaled.jpg "game-center-financial-model-roic-financialmodelslab_a89c3807-968f-4e53-ad38-bc84d7a5e5d6 | eFinancialModels")


Financial Model Overview
The Game Center Financial Model Financial Model Template is a ready-to-use planning tool built for entrepreneurs, founders, business owners, consultants, and analysts who need to evaluate the financial potential of a game center before launch, funding, or expansion. A game center can combine several revenue sources, including console and PC gaming sessions, arcade play, birthday parties, corporate events, tournaments, memberships, food and beverage sales, and merchandise. Because the business may also require significant upfront investment in equipment, fit-out, technology, furniture, and working capital, a structured financial model is essential for turning assumptions into a practical forecast. This template helps users organize the commercial and operating logic of the business, connect inputs to outputs, and review projected revenue, costs, profit, cash flow, balance sheet movement, break-even timing, payback period, and investor return metrics over a multi-year period.
All-in-One Dashboard
The all-in-one dashboard brings the core inputs and core outputs of the Game Center Financial Model into one central view, helping users understand the business at a glance without searching through every worksheet. This section is designed to summarize the key assumptions that drive the forecast, such as visitor volume, average spending, revenue stream mix, pricing, operating costs, staffing, startup investment, and funding structure. It also displays the main outputs that matter for planning and decision-making, such as total revenue, EBITDA, net profit, cash balance, break-even month, payback period, internal rate of return, and return on equity. For a game center business, this is particularly useful because profitability depends on the interaction between capacity, traffic, pricing, event bookings, food and beverage margins, fixed rent, payroll, and equipment investment. The dashboard gives founders and stakeholders a fast way to review whether the plan is financially realistic, whether funding needs are covered, and whether the business can progress from launch losses to sustainable profitability.
Low, Base, and High Scenario Analysis
The Low, Base, and High scenario analysis section allows users to test how the Game Center Financial Model changes under different business conditions. Instead of relying on one forecast, users can compare conservative, expected, and optimistic cases by adjusting the most important assumptions behind customer traffic, average revenue per visit, event demand, arcade usage, food and beverage sales, cost inflation, payroll needs, and operating margins. The low case can help identify downside risk, minimum cash requirements, and the impact of slower ramp-up after opening. The base case can be used as the primary business plan forecast for budgeting and funding discussions. The high case can show the upside potential if marketing performs well, utilization is stronger, events grow faster, or premium services generate higher customer spending. For founders and investors, this component is valuable because it turns uncertainty into a structured planning process. It helps users prepare for different outcomes, decide how much cash cushion to maintain, and understand which assumptions have the greatest effect on revenue, profit, and cash flow.
Professional Charts
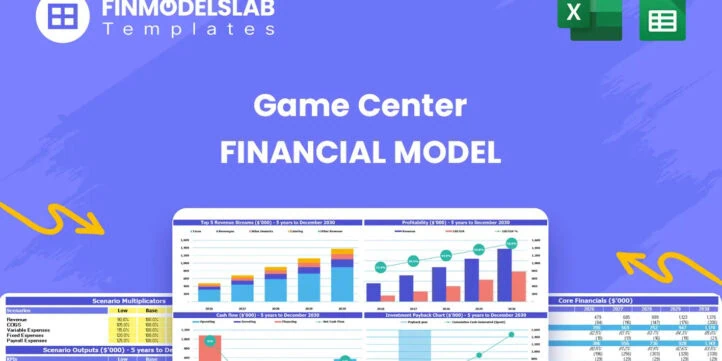
The professional charts section converts the financial forecast into clear visuals that are suitable for business plans, investor decks, loan discussions, internal updates, and management reviews. A game center financial plan can include many moving parts, so charts help users communicate trends in a faster and more intuitive way than rows of numbers alone. This component may display revenue growth, revenue mix, gross margin, EBITDA movement, net profit, cash balance, cost structure, break-even progress, and return metrics over the forecast period. These visuals help users see whether the business is gaining traction, whether operating expenses are becoming more efficient as revenue scales, and whether cash balances remain healthy during the early growth phase. Professional charts are especially useful when presenting to lenders, partners, landlords, or investors who need a quick understanding of the business model. By making the output presentation-ready, the template saves time on formatting and helps users explain the financial story behind the game center in a polished and credible way.
ROE Components and DuPont Analysis
The ROE components and DuPont analysis section helps users understand the drivers behind return on equity rather than looking at a single return percentage in isolation. For a game center, return on equity can be influenced by profit margin, asset intensity, and the way the business is financed. This component breaks down return performance into underlying factors, helping users see whether equity returns are being driven by operational profitability, efficient use of assets, or leverage. Inputs may include net income, revenue, total assets, equity, debt levels, and balance sheet changes over the forecast period. Outputs may include return on equity, margin-related insights, asset turnover, leverage effect, and year-by-year movement in return performance. This is useful for business owners and investors because game centers are often asset-heavy businesses that require investment in arcade machines, gaming PCs, consoles, furniture, kitchen equipment, and leasehold improvements. DuPont-style analysis helps users identify whether improving margins, increasing utilization, controlling capital spending, or adjusting the funding mix could improve returns.
Revenue Inputs
The revenue inputs section is where users define the assumptions that drive the top line of the Game Center Financial Model. This component is tailored to the game center business model and may include separate inputs for console and PC gaming time, arcade play, event packages, food and beverage orders, merchandise sales, memberships, tournaments, and other optional income streams. Users can adjust assumptions such as number of visits, price per session, hourly rates, arcade spend per customer, event bookings, average event value, food and beverage attachment rate, average order value, and annual growth. These inputs are important because small changes in traffic, pricing, utilization, or customer spending can have a major effect on profitability. For example, an increase in event package sales or food and beverage penetration may improve margins and accelerate break-even. This section helps entrepreneurs replace vague revenue expectations with clearly documented assumptions that can be reviewed, challenged, and refined. It is also useful for funding documents because it shows how projected sales are built from real operating drivers rather than unsupported estimates.
Bank-Ready Reports
The bank-ready reports section provides lender-friendly financial outputs that can support loan applications, funding conversations, and formal business planning. Banks and financing partners typically want to see more than projected revenue; they need to understand profitability, cash flow, debt service capacity, assets, liabilities, and the assumptions behind the forecast. This component organizes the financial model into professional outputs such as the profit and loss statement, cash flow statement, balance sheet, key financial summaries, and potentially debt-related metrics. For a game center, this is valuable because financing may be needed for leasehold improvements, gaming equipment, arcade machines, kitchen setup, technology, deposits, and working capital. The reports help users demonstrate how borrowed funds may be used, how the business expects to generate cash, and whether the forecast supports repayment over time. Clean bank-ready outputs can also improve communication with accountants, advisors, investors, and partners by presenting the business plan in a structured format that connects operating assumptions to financial results.
Revenue Breakdown
The revenue breakdown section gives users a detailed view of how each income stream contributes to total game center revenue. Rather than treating the business as one generic sales line, this component separates revenue sources such as console and PC gaming, arcade play, birthday parties, private events, corporate packages, tournaments, food and beverage, merchandise, and other add-on services. Inputs may include volume, pricing, frequency, customer behavior, spend per visit, and growth assumptions for each revenue category. Outputs may show monthly and annual revenue by stream, percentage contribution by stream, year-over-year growth, and the relative importance of each offering. This is useful because a game center’s financial performance often depends on a diversified income base. Gaming time may drive consistent traffic, arcade play may provide recurring casual spending, events may create high-ticket revenue, and food and beverage may improve margins if managed well. By reviewing the revenue breakdown, users can identify which activities deserve more marketing focus, which services may need pricing adjustments, and whether the overall business is too dependent on one income source.
KPI Dashboard
The KPI dashboard focuses on performance metrics and benchmarks that help users evaluate whether the game center is operating in line with expectations. While financial statements show the final results, key performance indicators help explain what is happening inside the business. This component may track metrics such as total visitors, revenue per visitor, average transaction value, event bookings, utilization, gross margin, EBITDA margin, payroll as a percentage of revenue, rent as a percentage of revenue, cash runway, break-even progress, and return metrics. It may also support comparison against industry-style benchmarks, helping users evaluate whether margins, growth rates, and cost ratios appear reasonable for an amusement, gaming, or entertainment venue. For business owners, this is useful after launch because the model can become a management tool rather than only a planning document. For investors and lenders, KPI visibility makes the forecast more transparent by showing the operational assumptions behind the financial outputs. The KPI dashboard supports better decision-making around pricing, staffing, promotions, cost control, and capacity planning.
Startup Cost Breakdown
The startup cost breakdown section organizes the initial investment required to open or prepare a game center for operations. A game center often has substantial pre-opening costs, so this component helps users estimate funding needs before revenue begins. Inputs may include leasehold improvements, arcade machines, gaming PCs, consoles, monitors, furniture, network infrastructure, point-of-sale systems, software, security systems, kitchen or snack bar equipment, signage, licenses, permits, deposits, initial inventory, insurance, professional fees, pre-opening payroll, launch marketing, and working capital reserves. Outputs may show total startup capital required, capital expenditure categories, pre-opening expense categories, and the amount of funding needed from equity, debt, or other sources. This is useful for budgeting and fundraising because it reduces the risk of overlooking major costs that could create a cash gap after launch. It also helps users evaluate trade-offs, such as whether to buy more arcade machines upfront, phase equipment purchases over time, or preserve more cash for the first months of operations. A clear startup cost breakdown makes the launch plan more realistic and easier to explain to stakeholders.
Break-Even and Payback Analysis
The break-even and payback analysis section helps users understand when the game center may become self-sustaining and when the initial investment may be recovered. Break-even analysis connects revenue, gross margin, fixed costs, variable costs, payroll, rent, and operating expenses to identify the point where the business begins covering its costs. Payback analysis evaluates how long it may take for cumulative cash flows to recover the initial startup investment. Inputs may include projected monthly revenue, cost of goods sold, staffing costs, rent, utilities, maintenance, marketing, loan payments, startup capital, and cash flow assumptions. Outputs may include break-even month, required revenue to break even, cumulative cash flow, payback period, and return-related insights. This component is valuable because a game center may operate at a loss during the early ramp-up period while customer awareness grows and utilization improves. Knowing the break-even timeline helps users plan cash reserves, secure the right amount of funding, set operating targets, and decide whether pricing, staffing, marketing, or event strategy needs adjustment to reach profitability sooner.
File types:
Excel – Single-User: .xlsx
Excel – Multi-User: .xlsx
Similar ProductsOther customers were also interested in...


 HenrySheykin
Trampoline Park Business Financial Model Excel Tem...
The Trampoline Park Financial Model helps entrepreneurs, founders, consultants, analysts, and busine... Read more
Paintball Financial Model Excel Template
The Paintball Financial Model helps entrepreneurs, founders, consultants, analysts, and business own... Read more

Bingo Hall Business Plan Financial Model Excel Tem...
The Bingo Hall Financial Model helps users turn a bingo venue concept into a structured, editable fi... Read more
Arcade Business Plan Financial Model Excel Templat...
The Arcade Financial Model helps users turn an arcade, game room, or family entertainment center con... Read more

 Giorgos
Golf & Entertainment Center – 5 Year Financi...
Financial Model providing an advanced 5-year financial plan for a startup or operating Golf & En... Read more

Escape Room Financial Model – 5 Year Forecast
Financial Model providing an advanced 5-year financial plan for a startup or operating Escape Room B... Read more

Family Entertainment Center – 5 Year Financial M...
Financial Model providing an advanced 5-year financial plan for a startup or operating Family Entert... Read more

Bowling & Billiards Center – Dynamic 10 Year...
Financial Model providing a dynamic up to 10-year financial forecast for a startup or existing Bowli... Read more

 Jair
Jair
Indoor Golf Business Model
This template is a detailed and user-friendly financial model that takes into account the specifics ... Read more
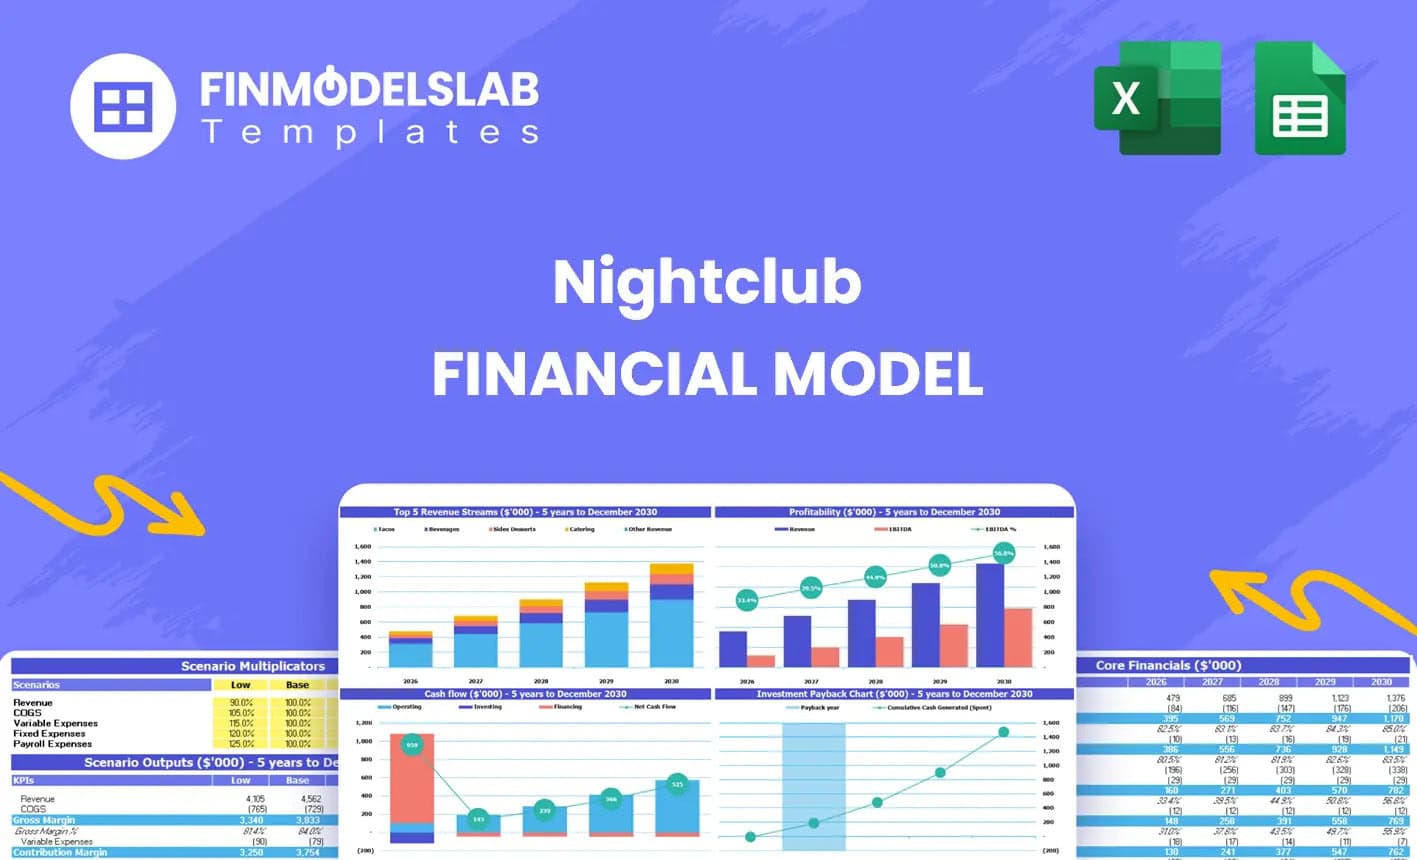
Nightclub Financial Model Excel Template
The Nightclub Financial Model helps users turn a nightlife business concept into a structured financ... Read more
You must log in to submit a review.