
0 ITEMS

Collectibles And Antiques Marketplace Financial Model Excel Template
The Antique Store Financial Model helps entrepreneurs, business owners, consultants, founders, and analysts turn an antique retail concept into a structured financial forecast. Instead of relying on scattered assumptions, the template gives users a ready-to-use planning framework for estimating revenue potential, startup costs, operating expenses, payroll, inventory-related costs, cash flow, profitability, and funding needs. It is especially useful for antique shops, vintage furniture stores, fine art and collectibles retailers, antique jewelry sellers, and hybrid retail businesses that want to understand how visitor traffic, buyer conversion, repeat customers, and sales mix can affect long-term performance. This financial model template is designed for practical business planning and funding preparation. Users can adjust assumptions such as daily store visitors, conversion rates, average order values, revenue streams, cost of goods sold, staffing, rent, marketing, utilities, professional fees, and other operating expenses. The model helps connect these assumptions to five-year financial projections, making it easier to evaluate whether the business can move from launch investment to sustainable profitability. It also supports decision-making by showing how changes in pricing, traffic, margins, and expense levels may affect cash flow and profit over time. For an antique store, financial planning is especially important because inventory purchases, restoration costs, store fit-out, display fixtures, and working capital needs can create pressure before sales reach maturity. This template helps users think through those requirements in advance, estimate the cash required to open and operate, and identify the period when the business may become self-sustaining. It can support business plans, bank loan applications, investor presentations, internal budgeting, and expansion analysis for existing retailers considering a new location or a broader product mix. The Antique Store Financial Model is fully editable and built for use in Microsoft Excel and Google Sheets, making it suitable for both finance professionals and non-financial users. It helps organize assumptions, review key financial statements, assess profitability, test scenarios, evaluate break-even timing, and present results in a professional format. By using a structured model instead of starting from scratch, users can save time, improve forecast quality, and make more confident decisions about launching, funding, or growing an antique store.
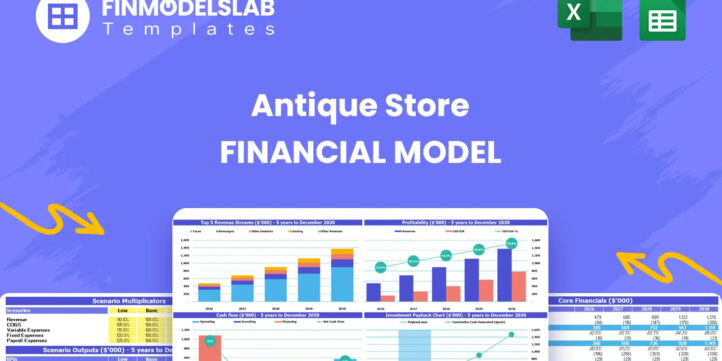


Financial Model Overview
The Antique Store Financial Model is a ready-to-use financial model template built to help users plan, forecast, and evaluate an antique retail business with more structure and confidence. Antique stores often require careful planning because they combine retail sales, inventory acquisition, restoration or preparation costs, showroom presentation, customer traffic, repeat buyer behavior, and working capital management. This template brings those moving parts into one organized model so entrepreneurs, business owners, consultants, analysts, and founders can estimate revenue, startup investment, operating expenses, cash flow, profitability, and funding needs over a five-year projection period. It is useful for new antique shops, vintage furniture retailers, collectible stores, fine art and jewelry resellers, and established operators planning expansion. By connecting assumptions to financial statements and decision-ready outputs, the model helps users build a clearer business case, prepare for investor or lender conversations, and understand what the business must achieve to become financially sustainable.
All-in-One Dashboard
The all-in-one dashboard gives users a central view of the most important inputs and outputs in the Antique Store Financial Model. Instead of reviewing multiple disconnected schedules, users can quickly see the assumptions that drive the forecast and the financial results those assumptions produce. This section may include key inputs such as store traffic, visitor-to-buyer conversion rates, repeat customer behavior, sales mix, gross margin assumptions, staffing levels, expense categories, and investment requirements. It also summarizes outputs such as revenue, EBITDA, net profit, cash balance, payback timing, and overall business performance. For an antique store, this is valuable because many decisions depend on the relationship between foot traffic, inventory quality, sales conversion, and operating cost discipline. The dashboard allows owners and advisors to review the plan at a high level before digging into the details, making it useful for business planning, investor discussions, lender reviews, and internal decision-making.
Low, Base, and High Scenario Analysis
The low, base, and high scenario analysis component helps users understand how the antique store may perform under different operating conditions. The base case can represent the most realistic plan, while the low case can reflect a more conservative outcome with lower visitor traffic, slower conversion improvement, weaker repeat purchases, or higher costs. The high case can show upside potential if the store attracts stronger demand, improves merchandising, sells more high-margin items, or builds a loyal customer base faster than expected. This component is useful because antique retail performance can vary based on location, seasonality, sourcing quality, local demand, tourism, marketing effectiveness, and economic conditions. By testing multiple cases, users can see how sensitive the business is to changes in revenue drivers and expense assumptions. The scenario analysis can help identify risk points, estimate possible funding gaps, prepare contingency plans, and communicate a more balanced forecast to investors, banks, partners, or internal stakeholders.
Professional Charts
The professional charts component turns the financial forecast into visual outputs that are easier to understand and present. Charts can display revenue growth, gross profit, operating expenses, EBITDA, net income, cash flow, cash balance, revenue mix, and other important trends across the projection period. For an antique store business plan, visual presentation matters because many stakeholders want to quickly understand whether the business is growing, when losses narrow, how margins improve, and whether cash reserves remain sufficient. This section helps users communicate the story behind the numbers without requiring every reader to inspect the formulas or line-by-line schedules. It can be especially helpful for investor decks, loan applications, management presentations, and strategic reviews. The charts also support better decision-making because they make patterns easier to spot, such as rising expenses, delayed profitability, concentration in one revenue stream, or periods where cash flow may become tight.
ROE Components and DuPont Analysis
The ROE components and DuPont analysis section helps users evaluate return on equity by breaking performance into the drivers behind the final result. Rather than only showing a single return metric, this component can analyze how profitability, asset efficiency, and financial leverage contribute to the overall return generated by the antique store. Inputs may include net income, revenue, total assets, equity, and balance sheet assumptions, while outputs can show margins, asset turnover, leverage effects, and return on equity over time. This is useful for investors and owners who want to understand whether returns are being created by genuine operating profitability, efficient use of inventory and assets, or financing structure. In an antique store, where capital may be tied up in inventory, fixtures, renovations, and working capital, this analysis can reveal whether the business is using its resources effectively. It strengthens financial planning by connecting operating decisions to investor-level performance metrics.
Revenue Inputs
The revenue inputs component is where users define the commercial assumptions that drive the antique store forecast. These assumptions may include daily store visitors, traffic by weekday, customer conversion rates, repeat customer percentages, average transaction values, product category mix, growth rates, and seasonality patterns. For an antique store, revenue is often shaped by both foot traffic and the ability to convert visitors into buyers through product curation, pricing, store design, reputation, and customer service. The model can also reflect different revenue categories such as antique furniture, fine art, vintage jewelry, collectibles, décor, restoration-related services, or other store-specific offerings. By entering these assumptions in a structured way, users can see how changes in traffic, pricing, and sales mix affect total revenue. This section is valuable because it turns a general sales goal into a forecast based on measurable drivers, making the plan more realistic, explainable, and easier to adjust as better market data becomes available.
Bank-Ready Reports
The bank-ready reports component provides lender-friendly financial outputs that help users present the antique store in a clear and professional format. These reports may include projected profit and loss statements, cash flow forecasts, balance sheets, financing summaries, debt repayment schedules, and key performance metrics. Banks and lenders typically want to understand whether the business can generate enough cash to cover operating expenses, repay debt, maintain working capital, and absorb periods of slower sales. This section organizes the forecast into reports that support credit review and funding discussions. For an antique store, this is especially important because the business may need capital for renovation, inventory acquisition, display cases, lighting, delivery vehicles, launch marketing, and early operating losses. The reports help show how the funding will be used, when revenue is expected to grow, and whether the projected cash flow can support repayment obligations. This makes the template useful for loan applications, investor packages, and formal business plans.
Revenue Breakdown
The revenue breakdown component gives users a detailed view of how sales are generated across the antique store’s revenue streams. Instead of only showing total revenue, this section can separate income by category, such as antique furniture, fine art, vintage jewelry, collectibles, décor, accessories, restoration services, or other custom product lines. Inputs may include category-level sales mix, average order values, growth assumptions, margin expectations, and changes in customer demand over time. Outputs help users see which revenue streams contribute most to overall sales and which categories may provide the strongest profitability. This is particularly useful in antique retail because different product types can have very different sourcing costs, turnover speeds, selling prices, and margin profiles. A store may generate fewer transactions from high-value furniture or art while relying on smaller items for steady cash flow. The revenue breakdown helps users plan inventory strategy, merchandising focus, marketing priorities, and purchasing decisions based on the financial role each category plays.
KPI Dashboard
The KPI dashboard component tracks the performance metrics that matter most for managing an antique store. These may include visitor traffic, conversion rate, repeat customer rate, average transaction value, revenue per visitor, gross margin, operating margin, EBITDA margin, inventory-related cost ratios, cash balance, break-even timing, payback period, and return metrics. The purpose of this section is to turn the financial model into an ongoing management tool rather than a one-time forecast. Users can compare projected performance against actual results, identify where the business is ahead or behind plan, and make informed adjustments. For example, if visitor traffic is strong but conversion is weak, the issue may relate to pricing, merchandising, staff sales approach, or product selection. If revenue is growing but cash remains tight, the issue may be inventory purchasing, margins, or expense timing. The KPI dashboard helps owners, consultants, and advisors monitor progress, communicate performance, and make practical operating decisions.
Startup Cost Breakdown
The startup cost breakdown component helps users estimate the initial investment required to open or prepare the antique store for operations. This section can include store renovation and fit-out, display cases, lighting, signage, point-of-sale systems, delivery vehicle costs, opening inventory, security systems, licenses, permits, deposits, professional fees, launch marketing, and initial working capital. Outputs may summarize the total funding requirement, separate one-time capital expenditures from pre-opening expenses, and show how much cash is needed before the business begins generating meaningful revenue. For an antique store, this component is especially important because the physical retail environment and initial inventory base can strongly influence customer perception and sales potential. Underestimating launch costs can lead to cash shortages before the store has enough traffic or repeat customers to support operations. This section helps users budget realistically, prepare funding requests, prioritize spending, and understand the financial commitment required to move from concept to opening day.
Break-Even Analysis
The break-even analysis component helps users understand when the antique store is expected to cover its costs and begin operating on a sustainable basis. It can calculate the point where revenue is sufficient to offset cost of goods sold, payroll, rent, utilities, marketing, insurance, professional fees, inventory-related expenses, and other operating costs. Depending on the model setup, it may also account for the initial startup investment and cumulative cash position, helping users distinguish between monthly operating break-even and full payback of launch costs. This section is valuable because antique stores may take time to build reputation, refine sourcing channels, develop repeat customers, and improve conversion rates. Knowing the projected break-even point helps users plan funding, manage expectations, set sales targets, and evaluate whether the business has enough working capital to survive the early growth phase. It also supports decision-making by showing which levers, such as traffic, conversion, margins, staffing, or expense control, have the biggest impact on reaching profitability sooner.
File types:
Excel – Single-User: .xlsx
Excel – Multi-User: .xlsx
Similar ProductsOther customers were also interested in...


 HenrySheykin
Etsy & Ebay Store Financial Model Excel Templa...
The Etsy and eBay Store Financial Model helps marketplace sellers, founders, consultants, and busine... Read more
Fashion Marketplace Financial Model Excel Template
The Fashion Retail Financial Model helps entrepreneurs, founders, business owners, consultants, and ... Read more

Toys Marketplace Financial Model Excel Template
The Toy Marketplace Financial Model Template helps founders, entrepreneurs, consultants, analysts, a... Read more

Electronics Marketplace Financial Model Excel Temp...
The Online Marketplace Financial Model Template helps entrepreneurs, founders, consultants, analysts... Read more

Arts, Crafts And Gifts Marketplace Financial Model...
The Handmade Goods Marketplace Financial Model helps founders, entrepreneurs, consultants, and analy... Read more

 Pushkar
Online Car Rental – 3 Statement Financial Mo...
Online Car Rental Platform Business Plan Model is a perfect tool for a feasibility study on launchin... Read more

 JILL LIU
Subscription Meal Kit Financial & DCF Valuatio...
We are glad to present our new integrated, dynamic and ready-to-use Subscription Meal Kit Financial ... Read more
 anthony
Bundle – Business Financial Forecasting Mode...
The purpose of this Bundle of Business Forecasting and Financial Models is to assist Business Owners... Read more

 Yash
Beauty on Demand Marketplace Financial Model
This Financial Model is related to Startup marketplace model operating in the space of Beauty on Dem... Read more
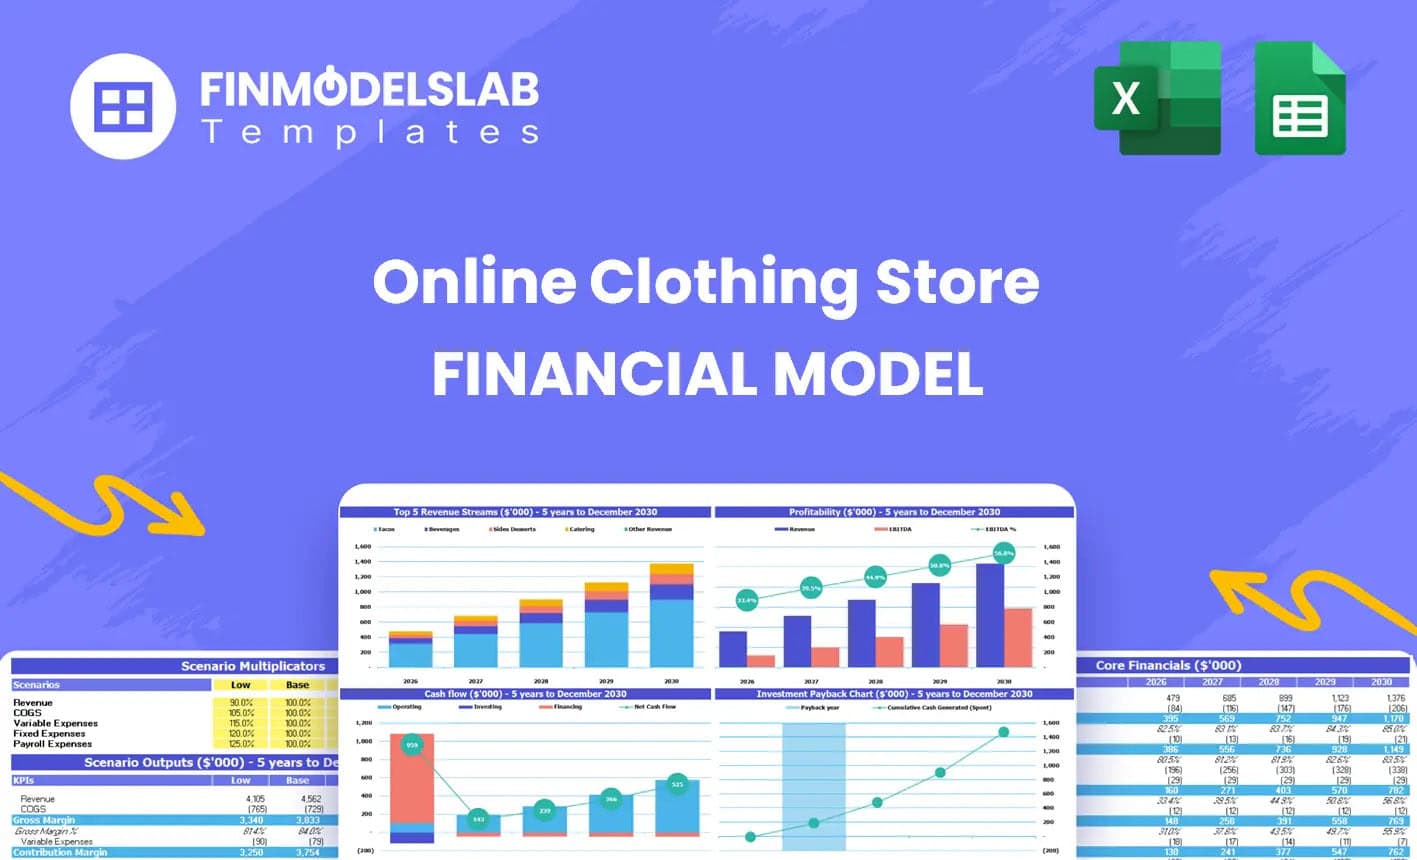
Online Clothing Store Financial Model Excel Templa...
The Online Clothing Store Financial Model helps founders, entrepreneurs, business owners, consultant... Read more
You must log in to submit a review.