
0 ITEMS

Fast Casual Restaurant Financial Model Excel Template
The Fast Casual Restaurant Financial Model helps entrepreneurs, restaurant owners, consultants, analysts, and business planners turn a fast casual dining concept into a structured financial forecast. Instead of building restaurant projections from a blank spreadsheet, users can start with a ready-to-use model designed around the economics of a fast casual restaurant, including customer traffic, average check size, food and beverage sales, cost of goods sold, staffing, startup investment, operating expenses, cash flow, and profitability. The template is built to support both new restaurant launches and expansion planning for existing operators who need a clear view of how the business may perform over time. This financial model template is especially useful for preparing business plans, investor presentations, loan applications, internal budgets, and strategic decision-making documents. It helps users organize key revenue assumptions, estimate weekday and weekend customer volumes, model menu category performance, and understand how pricing and sales mix affect gross margin. It also helps clarify the upfront funding required to open the restaurant, including leasehold improvements, kitchen equipment, furnishings, inventory, deposits, and other launch expenses that can have a major impact on early cash flow. Beyond revenue and startup costs, the model supports practical financial planning by connecting operating expenses, payroll, COGS, and cash flow in one forecast. Users can evaluate whether the restaurant can cover its fixed and variable costs, when it may reach break-even, how much working capital may be needed, and how profitability could grow across a five-year projection period. The template also allows users to test different assumptions so they can compare more conservative and more optimistic outcomes before committing capital, negotiating funding, or making operational decisions. Designed to be editable and presentation-ready, the Fast Casual Restaurant Financial Model gives users a professional framework for building credible financial projections without hiring a consultant or developing a complex model from scratch. It can be customized for different service styles, menu strategies, pricing levels, staffing plans, and growth targets. Whether you are opening your first fast casual concept, evaluating a franchise-style opportunity, expanding an existing restaurant brand, or advising a client, this template helps convert assumptions into financial outputs that are easier to understand, explain, and use for confident decision-making.


Financial Model Overview
The Fast Casual Restaurant Financial Model is a ready-to-use financial model template built to help entrepreneurs, operators, consultants, analysts, and founders evaluate the financial potential of a fast casual dining concept. A restaurant business depends on many connected assumptions, including daily covers, average check size, menu mix, food and beverage costs, labor scheduling, rent, utilities, equipment, build-out investment, marketing, and working capital. This template brings those assumptions into one structured model so users can forecast revenue, startup costs, operating expenses, cash flow, profitability, investor returns, and long-term financial performance. It is designed for business planning, funding preparation, lender discussions, investor presentations, internal budgeting, and operational decision-making. By using an editable framework with pre-built formulas, users can replace guesswork with a more organized forecast and quickly understand how changes in traffic, pricing, cost control, payroll, and capital investment affect the restaurant’s path to sustainability.
All-in-One Dashboard
The all-in-one dashboard gives users a central place to review the most important inputs and outputs of the Fast Casual Restaurant Financial Model. This component connects the model’s core assumptions with summary results, allowing users to see the relationship between customer volume, average check, revenue, costs, cash flow, EBITDA, profitability, and investment performance without moving through every detailed worksheet. Inputs may include launch timing, daily covers, sales mix, pricing assumptions, cost percentages, staffing plans, startup capital, and financing assumptions, while outputs may show projected sales, gross profit, operating income, cash position, break-even timing, and return metrics. For a fast casual restaurant, this is useful because business performance changes quickly when traffic, ticket size, labor, or food cost assumptions move even slightly. The dashboard helps owners and stakeholders interpret the financial plan at a glance, making it easier to communicate results in business plans, funding meetings, management reviews, and strategic planning discussions.
Low, Base, and High Scenario Analysis
The Low, Base, and High scenario analysis component helps users test how the restaurant could perform under different operating conditions. Instead of relying on one fixed forecast, the model allows users to compare conservative, expected, and optimistic cases using key drivers such as weekday and weekend covers, average check size, menu pricing, sales growth, food cost percentages, labor costs, rent, marketing spend, and other operating assumptions. The outputs may show how each scenario affects revenue, gross margin, EBITDA, net income, monthly cash flow, funding requirements, break-even timing, and investor payback. This is especially important for fast casual restaurants because the difference between a successful launch and a cash-constrained operation can depend on traffic ramp-up, customer retention, supplier pricing, and labor efficiency. Scenario analysis helps users understand downside risk, set realistic targets, prepare contingency plans, and present a more credible financial story to investors, lenders, or internal decision-makers.
Professional Charts
The professional charts component translates the financial forecast into clear visual reports that can be used in presentations, business plans, funding documents, and management discussions. These charts may visualize revenue growth, sales mix, gross profit, EBITDA, net income, cash balance, operating expenses, startup investment, break-even timing, and other key financial trends across the projection period. For a fast casual restaurant, visual reporting is valuable because stakeholders often need to quickly understand how the business scales from launch to maturity, how profitability improves as customer traffic increases, and how cash flow behaves during the early months after build-out and opening. The charts help users move beyond rows of spreadsheet data and present the financial model in a format that is easier to interpret. They are also useful for comparing scenarios, highlighting cost pressure, showing the impact of growth, and supporting investor or lender conversations with a polished, presentation-ready view of the restaurant’s projected performance.
ROE Components and DuPont Analysis
The ROE components and DuPont analysis section helps users understand the drivers behind return on equity rather than looking at one return metric in isolation. This component may break ROE into profitability, efficiency, and leverage-related factors, helping users see whether returns are being driven by operating margin, asset utilization, financing structure, or a combination of these elements. Inputs may include projected net income, revenue, total assets, owner equity, debt, and balance sheet assumptions, while outputs can show how changes in margin performance, investment intensity, and capital structure influence shareholder returns. For a fast casual restaurant, this is useful because the business often requires substantial upfront investment in leasehold improvements, kitchen equipment, furnishings, inventory, and working capital before meaningful revenue is generated. DuPont-style analysis helps founders, investors, and analysts evaluate whether the restaurant is using capital efficiently and whether projected returns are supported by realistic operating performance rather than excessive financial leverage.
Revenue Inputs
The revenue inputs component is where users define the commercial assumptions that drive the restaurant’s sales forecast. For a fast casual restaurant, revenue is typically shaped by customer traffic, average check size, day-of-week patterns, menu category mix, and the ramp-up period after opening. This section may allow users to enter assumptions for weekday covers, weekend covers, average ticket values, operating days, brunch or dinner demand, beverages, desserts, coffee, catering, delivery, or other applicable revenue streams. Outputs generated from these assumptions may include monthly revenue, annual revenue, sales by category, revenue growth, and the relationship between volume and profitability. This component is useful because revenue planning for a restaurant should be grounded in operational reality rather than broad annual estimates. By modeling covers and check size directly, users can test whether the dining room capacity, service format, pricing strategy, and demand expectations are strong enough to support rent, payroll, food costs, marketing, debt service, and the overall business plan.
Bank-Ready Reports
The bank-ready reports component organizes the financial model into lender-friendly outputs that can support loan applications, funding requests, credit reviews, and stakeholder discussions. These reports may include forecasted profit and loss statements, cash flow statements, balance sheet summaries, debt repayment schedules, capital investment needs, profitability metrics, and coverage-related indicators. For a fast casual restaurant, this is particularly important because lenders and funding partners often want to understand how much capital is needed, what the funds will be used for, whether the business can service debt, and how the restaurant will maintain liquidity during the ramp-up period. Inputs may include startup costs, loan amounts, interest rates, repayment terms, operating expenses, revenue assumptions, and working capital reserves. The outputs help users present a structured and credible financial case instead of a loose collection of estimates. This makes the template useful for founders seeking restaurant financing, operators preparing expansion documents, and consultants building financial plans for clients.
Revenue Breakdown
The revenue breakdown component gives users a more detailed view of how sales are generated across the restaurant’s different revenue streams. Instead of presenting revenue as one total number, this section can separate categories such as dinner food, beverages, brunch food, desserts, coffee, delivery, catering, or other menu lines that fit the fast casual concept. Inputs may include each category’s share of total sales, pricing assumptions, expected customer behavior, daypart performance, and growth over time. Outputs may show monthly and annual revenue by stream, contribution to total sales, category-level trends, and the impact of menu mix on gross profit. This is useful because not all restaurant revenue carries the same margin. Beverages, desserts, and certain add-ons may generate stronger profitability than lower-margin food items, while delivery or third-party channels may introduce additional fees. A revenue breakdown helps users understand which parts of the business drive growth, which offerings deserve more marketing attention, and how menu strategy affects the overall financial forecast.
KPI Dashboard
The KPI dashboard component tracks the key performance indicators that matter most for evaluating a fast casual restaurant’s financial health. These may include revenue growth, gross margin, food cost percentage, beverage mix, labor cost percentage, EBITDA margin, net profit margin, average check, covers per day, cash balance, payback period, return on equity, and other operational or financial benchmarks. Inputs are drawn from the model’s assumptions and forecasted financial statements, while outputs are presented as summarized metrics that help users compare projected performance against targets or industry expectations. This component is useful because restaurant owners and investors need more than total sales to assess performance. A restaurant with strong revenue can still struggle if labor scheduling is inefficient, food costs are too high, cash reserves are thin, or margins do not improve as volume grows. The KPI dashboard helps users monitor whether the financial plan is balanced, identify weak points, and make better decisions around pricing, staffing, purchasing, marketing, and expansion.
Startup Costs and Capital Requirements
The startup costs and capital requirements component helps users estimate the initial investment needed to open and operate the fast casual restaurant before it becomes self-sustaining. This section may include leasehold improvements, kitchen equipment, point-of-sale systems, dining room furnishings, signage, permits, professional fees, deposits, pre-opening payroll, training, launch marketing, initial food and beverage inventory, smallwares, technology, insurance, and working capital reserves. Inputs may be entered as one-time costs, timing-based costs, or category-level budgets, while outputs can show total funding needed, use of funds, capital required before opening, and the cash cushion needed during the first months of operation. This is useful because restaurant projects frequently face cost overruns, delayed openings, and early cash flow pressure. A clear startup cost breakdown helps users avoid undercapitalization, prepare more accurate funding requests, evaluate whether outside financing is needed, and communicate the investment plan to lenders, investors, partners, or landlords with greater confidence.
Break-Even Analysis
The break-even analysis component helps users identify when the restaurant’s revenue is expected to cover its operating costs and begin generating profit. This section may use assumptions for fixed costs, variable costs, COGS, payroll, rent, utilities, marketing, operating expenses, average check, gross margin, and monthly revenue growth to estimate the sales level or time period required to reach break-even. Outputs may include break-even revenue, break-even month, margin of safety, contribution margin, and the impact of different traffic or pricing assumptions on profitability timing. For a fast casual restaurant, break-even analysis is one of the most important planning tools because the early months after opening often include high fixed costs, ramping customer demand, staffing adjustments, and cash flow uncertainty. By understanding the level of covers, average check, and cost control required to reach break-even, users can set realistic operating targets, plan marketing campaigns, manage working capital, and explain the restaurant’s path to viability in funding discussions.
File types:
Excel – Single-User: .xlsx
Excel – Multi-User: .xlsx
Similar ProductsOther customers were also interested in...


 HenrySheykin
Donut Shop Financial Model Excel Template
The Donut Shop Financial Model helps entrepreneurs, founders, business owners, consultants, and anal... Read more

Fast Food Financial Model Excel Template
The Fast Food Restaurant Financial Model helps entrepreneurs, founders, restaurant owners, consultan... Read more

Drive-Thru Restaurant Financial Model Excel Templa...
The Drive-Thru Restaurant Financial Model Template helps users turn a quick-service restaurant conce... Read more

Food Court Financial Model Excel Template
The Food Court Financial Model helps entrepreneurs, founders, business owners, consultants, and anal... Read more

 Giorgos
Food Truck Financial Model – 5 Year Financial Fo...
This Financial Model presents an advanced 5-year financial plan for a startup or operating Food Truc... Read more

Pizzeria Financial Model – 5 Year Financial Fore...
Financial Model providing advanced financial planning & analysis for a Pizzeria business. Suitab... Read more
Cloud Kitchen Financial Model – 5 Year Financial...
A Cloud Kitchen—also referred to as a “ghost kitchen” or “virtual kitchen”—is a commerci... Read more

 Peter Graf
Karaoke Lounge Financial Model
The idea of this Karaoke Lounge Financial Model is, that you offer 3 separate Karaoke rooms for litt... Read more

 Excel Business Resou...
Fast Food Restaurant Financial Model Template
Maximize fast food financials with our user-friendly financial model template. Easily forecast sales... Read more
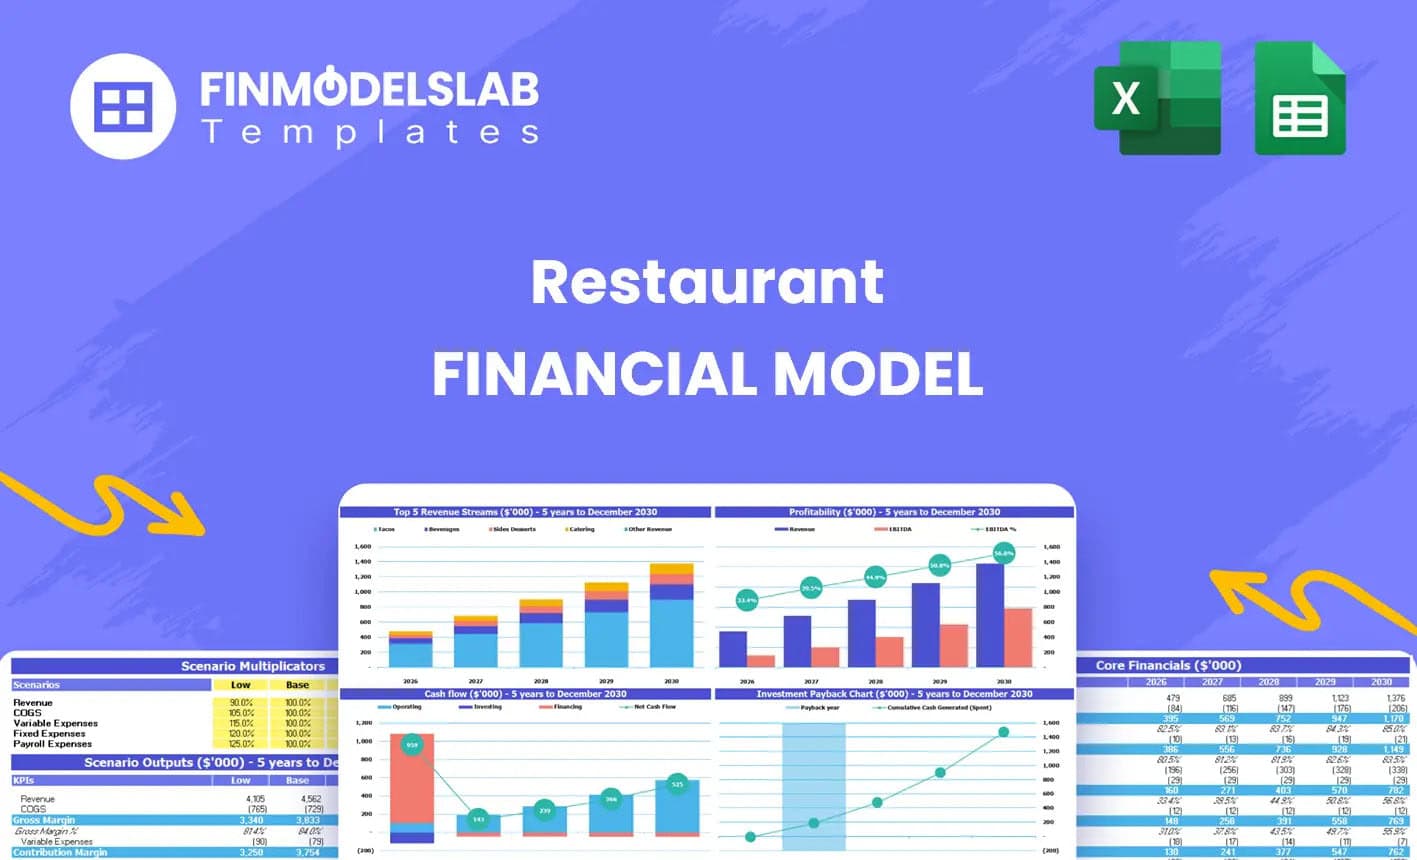
Restaurant Financial Model Excel Template
" The Restaurant Financial Model helps users turn a restaurant concept into a structured, editable f... Read more
You must log in to submit a review.